


Abstract
(2S,3R,4R,5S,6R)-2-(3-(4-Ethoxybenzyl)-4-chlorophenyl)-6-hydroxymethyl-tetrahydro-2H-pyran-3,4,5-triol (dapagliflozin; BMS-512148) is a potent sodium-glucose cotransporter type II inhibitor in animals and humans and is currently under development for the treatment of type 2 diabetes. The preclinical characterization of dapagliflozin, to allow compound selection and prediction of pharmacological and dispositional behavior in the clinic, involved Caco-2 cell permeability studies, cytochrome P450 (P450) inhibition and induction studies, P450 reaction phenotyping, metabolite identification in hepatocytes, and pharmacokinetics in rats, dogs, and monkeys. Dapagliflozin was found to have good permeability across Caco-2 cell membranes. It was found to be a substrate for P-glycoprotein (P-gp) but not a significant P-gp inhibitor. Dapagliflozin was not found to be an inhibitor or an inducer of human P450 enzymes. The in vitro metabolic profiles of dapagliflozin after incubation with hepatocytes from mice, rats, dogs, monkeys, and humans were qualitatively similar. Rat hepatocyte incubations showed the highest turnover, and dapagliflozin was most stable in human hepatocytes. Prominent in vitro metabolic pathways observed were glucuronidation, hydroxylation, and O-deethylation. Pharmacokinetic parameters for dapagliflozin in preclinical species revealed a compound with adequate oral exposure, clearance, and elimination half-life, consistent with the potential for single daily dosing in humans. The pharmacokinetics in humans after a single dose of 50 mg of [14C]dapagliflozin showed good exposure, low clearance, adequate half-life, and no metabolites with significant pharmacological activity or toxicological concern.
Type 2 diabetes mellitus is a chronic disease prevalent around the world, characterized by hyperglycemia caused by excessive hepatic glucose production, a deficiency in insulin secretion, and/or peripheral insulin resistance. As the disease advances, complications result from the hyperglycemia, such as retinopathy, neuropathy, nephropathy, and other macrovascular diseases (Edelman, 1998; Porte, 2001). Although present antidiabetic agents can achieve the needed reduction in plasma glucose, no single current medication is optimal to achieve sustained glycemic control without side effects, such as hypoglycemia. The often necessary combination therapy also can generate additional side effects. For example, treatment with thiazolidinediones (glitazones) in combination with insulin is related to an increased risk of congestive heart failure as a result of edema events (Nesto et al., 2004). There are very few therapies, with the exception of the novel dipeptidyl peptidase 4 inhibition, that do not cause an increase in body weight or risk of hypoglycemia (Barnett, 2006). In addition, agents that increase the production of insulin stress the pancreatic β cells, which results in eventual hypertrophy and loss of differentiation of those cells, contributing to the progression of the disease (List et al., 2009).
Thus, the development of alternative agents acting by novel mechanisms has become necessary to control glucose levels in patients with progressing hyperglycemia (Rotella, 2004; Skyler, 2004; Mohler et al., 2009). Some emerging small molecules primarily lower blood glucose levels by modulating targets that affect glucose metabolism (glucokinase, glycogen phosphorylase) or by regulating glucose homeostasis (AMP-activated protein kinase). One such novel mechanism by which blood glucose levels can be lowered is by removing glucose from the bloodstream via inhibition of the sodium glucose cotransporter (SGLT).
Under normal conditions, plasma glucose is filtered in the kidney glomerulus and in healthy individuals is almost totally (99%) reabsorbed (Deetjen et al., 1992). This reabsorption process is mediated by two sodium-dependent glucose cotransporters: SGLT1 and SGLT2. SGLT1 is a low-capacity, high-affinity transporter expressed in the gut, heart, and kidney (Wright et al., 1993), and SGLT2 is a high-capacity, low-affinity transporter expressed mainly in the S1 segment of the proximal tubule of the nephron (Kanai et al., 1994). The SGLT2 in the proximal tubule is estimated to facilitate approximately 90% of renal glucose reabsorption, and the remaining 10% is likely mediated by SGLT1 that resides in the distal S3 segment of the proximal tubule (Wallner et al., 2001).
Nonselective SGLT inhibitors have been described, such as the natural product phlorizin (Ehrenkranz et al., 2005), which is an O-glucoside dihydrochalcone found in the root and bark of certain fruit trees. Phlorizin was not suitable for development as a drug candidate because of low bioavailability and rapid clearance as a consequence of hydrolysis by O-glucosidases present in the gut, liver, and kidney. In addition, the finding that a defective SGLT1 transporter in the gut is responsible for glucose and galactose malabsorption disorders in patients (Turk et al., 1991) suggests that pursuit of SGLT2 inhibitors exhibiting comparable (less than 10-fold) SGLT1 selectivity to phlorizin would increase the risk of unacceptable diarrhea.
Selective inhibition of SGLT2 has been proposed to aid in the normalization of plasma glucose levels in diabetic patients by preventing the renal glucose reabsorption process and promoting glucose excretion in urine (Oku et al., 1999). Dapagliflozin is a potent, selective SGLT2 inhibitor in vitro and also shows increased glucose excretion and highly efficacious plasma glucose lowering in preclinical species (Han et al., 2008; Meng et al., 2008). Dapagliflozin is not only selective for SGLT2 (1200-fold over SGLT1) but also is more metabolically stable than previously described SGLT inhibitors because it is a C-glucoside rather than an O-glucoside (Ellsworth et al., 2008; Meng et al., 2008). Proof-of-concept and Phase 2b studies in patients with type 2 diabetes have been conducted with various doses of dapagliflozin and published previously (Komoroski et al., 2009a,b; List et al., 2009). Dapagliflozin exhibits an insulin-independent mechanism of action, providing both short-term and longer-term (HbA1c levels) efficacy (List et al., 2009). In studies with the SGLT inhibitor phlorizin, this insulin-independent mechanism was shown to alleviate the loss of β cell function, normalizing the blood glucose levels without increasing plasma insulin or changing levels of nonesterified fatty acids in plasma (Jonas et al., 1999).
Once C-glycoside SGLT2 inhibitors were identified as being pharmacologically attractive compounds, with very good selectivity for the target and potency in both in vitro and in vivo assessments, studies were conducted to characterize the in vitro absorption, metabolism, drug-drug interaction potential, and pharmacokinetics in mice, rats, dogs, and monkeys and to aid in compound selection. Based on the data from these evaluations, dapagliflozin was selected for progression into clinical trials, and the absorption, distribution, metabolism, and excretion (ADME)-related data are presented here. As dapagliflozin progressed as the development candidate, a mass balance study with radiolabeled dapagliflozin was conducted in healthy volunteers, and some brief results from that study are also reported here.
Materials and Methods
Chemicals and Equipment.
Dapagliflozin and a chemical standard corresponding to the O-deethylated metabolite (M8) were synthesized at Bristol-Myers Squibb Co. (Princeton, NJ) and were at least 99% pure based on high-performance liquid chromatography (HPLC) purity analysis. A standard of hydroxylated metabolite (M12) was purified from a large-scale incubation of dapagliflozin with rat liver microsomes. Structural characterization data for dapagliflozin and synthesized or purified metabolites can be found in the Supplemental Data. [14C]Dapagliflozin (specific activity of 2.07 μCi/mg and a radiochemical purity of 99.5%) was synthesized in the Bristol-Myers Squibb Radiochemistry Department (New Brunswick, NJ). All the other chemicals were reagent grade or better and were obtained from Sigma-Aldrich (St. Louis, MO) unless otherwise specified. For the Caco-2 permeability and protein binding studies, 24-well plates were obtained from Corning Life Sciences (Lowell, MA). Caco-2 cells were obtained from American Type Culture Collection (Manassas, VA). Dulbecco's modified Eagle's medium, nonessential amino acids, l-glutamine, penicillin-G, and streptomycin were purchased from JRH Biosciences (Lenexa, KS). Fetal bovine serum was obtained from HyClone Laboratories (Logan, UT). Rat-tail collagen type I was purchased from Collaborative Research (Bedford, MA). HTS-Transwell inserts (surface area, 1 cm2) with a polycarbonate membrane (0.4-μm pore size) were purchased from Corning Life Sciences (Lowell, MA). Verapamil was obtained from Sigma-Aldrich.
Control blood from rat, dog, monkey, and human; control plasma from rat, dog, and human; and control monkey serum were obtained from Bioreclamation (Hicksville, NY). For the cytochrome P450 (P450) inhibition studies, midazolam, 1-hydroxymidazolam, (S)-mephenytoin, (S)-4′-hydroxymephenytoin, hydroxybupropion, 6α-hydroxypaclitaxel, and pooled human liver microsomes (HLMs) were obtained from BD Gentest (Woburn, MA). Ecolite liquid scintillation mixture was purchased from MP Biomedicals (Solon, OH). Cryopreserved hepatocytes from male Sprague-Dawley rat, male beagle dog, male cynomolgus monkey, and human (three donors) were obtained from In Vitro Technologies (Baltimore, MD). Balb/C mouse hepatocytes were prepared in Bristol-Myers Squibb laboratories using standard techniques (Seglen, 1976) and used on the day of isolation. For analysis of radioactivity in samples from the hepatocyte incubations used for metabolite identification, a TopCount NXT microplate scintillation and luminescence counter (PerkinElmer Life and Analytical Sciences, Waltham, MA) was used.
For the P450 induction studies, phosphate-buffered saline, tissue culture media (Dulbecco's modified Eagle's medium and Chee's medium), and additives were purchased from Invitrogen (Carlsbad, CA). Extracellular matrix proteins (collagen type 1 and Matrigel) were purchased from BD Biosciences Discovery Labware (Bedford, MA), and culture dishes (60-mm Permanox) were obtained from Nalge Nunc International (Rochester, NY). Lactate dehydrogenase assay kit was purchased from Promega (Madison, WI). For the P450 induction assay, the substrates, metabolites, and internal standards included phenacetin, acetaminophen, N-(4-hydroxyphenyl-2,3,5,6-d4) acetamide, bupropion, hydroxybupropion (obtained from BD Gentest), testosterone, and 6β-hydroxytestosterone and were obtained from Sigma-Aldrich unless otherwise noted.
Animals.
All the procedures involving animals and their care were conducted in conformity with the guidelines that are in compliance with the Bristol-Myers Squibb Institutional Animal Care and Use Committee. Adult male Sprague-Dawley rats (200–283 g) were obtained from Harlan (Indianapolis, IN). Rats were surgically prepared with indwelling jugular vein cannulas (oral animals) or indwelling jugular vein cannulas and carotid artery cannulas (intra-arterial animals) 1 day before drug administration. Adult male beagle dogs (11.6–14.8 kg) were from an in-house colony. Those that received the intravenous doses had chronically implanted femoral vein access ports. Adult male cynomolgus monkeys (6.2–7.1 kg) were from an in-house colony. All the monkeys used had chronically implanted femoral vein access ports. All the animals were fasted overnight before dosing and were fed 4 h after dosing. All the animals had free access to water and were conscious throughout the study.
Drug.
For all the pharmacokinetic studies in animals, dapagliflozin was formulated in polyethylene glycol/water/ethanol (45:45:10, v/v/v) at a concentration of 1 mg/ml.
Drug treatment.
Two groups of three rats each were given a single oral or intra-arterial dose of dapagliflozin (1 mg/kg). A single dose of dapagliflozin (6.6 mg/kg) was administered orally and intravenously to three beagle dogs in a crossover fashion. In an analogous crossover study, dapagliflozin (6 mg/kg) was administered orally and intravenously to three cynomolgus monkeys.
Sampling.
For rats, blood samples were collected from the jugular vein cannulas at 10 and 30 min and 1, 2, 4, 6, 8, and 12 h after both the intra-arterial and oral administration. For dogs and monkeys, blood samples were collected from the jugular vein at 10, 15, 30, and 45 min and 1, 2, 4, 6, 8, 12, 24, 32, and 48 h after intravenous administration and at 15, 30, and 45 min and 1, 2, 4, 6, 8, 12, 24, 32, and 48 h after oral administration. All the blood samples were collected into syringes containing K3EDTA salt. The plasma fraction was immediately separated by centrifugation (14,000g, 10 min, 4°C), frozen on dry ice, and stored at −20°C until the samples were analyzed. For dogs and monkeys, urine was also collected over the duration of the study. Plasma and urine samples were treated with 2 volumes of acetonitrile (ACN) containing internal standard. After centrifugation to remove precipitated proteins, an aliquot of supernatant was analyzed by liquid chromatography/tandem mass spectroscopy (LC/MS/MS).
Clinical Study.
The protocol, amendments, and informed consent for this study were approved by the Institutional Review Board/ Independent Ethics Committee and conducted in accordance with good clinical practices. Six healthy adult males were enrolled in an open-label, nonrandomized, single-dose study. Subjects were given a single oral dose of 50 mg of [14C]dapagliflozin solution, containing approximately 125 μCi of total radioactivity (TRA). The dose volume was 10 ml (5 mg/ml in polyethylene glycol/water, 30:70, v/v) of solution and was followed by the administration of 240 ml of water. Blood samples were collected from an indwelling catheter or by direct venipuncture into tubes containing K2EDTA at 0.25, 0.5, 0.75, 1, 1.5, 2, 2.5, 3, 4, 6, 8, 12, 24, 36, 48, 72, 96, 120, 144, 168, 192, 216, 240, 264, 288, and 312 h. Blood samples were centrifuged for 15 min at 1000g to obtain plasma and stored at −20°C until analysis for TRA and dapagliflozin concentrations by a validated LC/MS/MS method. Additional blood samples were obtained at 1, 4, 12, 48, and 144 h after the dose for biotransformation analysis. Urine and feces were also collected. Urine was collected in chilled urine collection jugs and stored refrigerated during the collection period (0–12 and 12–24 h on day 1 and then every 24 h on subsequent days). Aliquots taken for TRA and drug analysis and remaining bulk urine were stored at −70°C until analysis.
In Vitro Studies.
Caco-2 permeability studies and P-glycoprotein interaction studies.
Caco-2 cells were seeded onto 12-well polycarbonate filter membrane at a density of 60,000 cells/cm2. The permeability studies were conducted as described previously (Kamath et al., 2008) but with the addition of a potent inhibitor of P-glycoprotein (P-gp; GF120918, 4 μM) to both the apical and the basolateral compartments in the bidirectional permeability studies. The ability of dapagliflozin to inhibit P-gp was evaluated by assessing the inhibition of the transport of digoxin, a P-gp substrate, through Caco-2 cell monolayers and was conducted as described previously (Kamath et al., 2008).
Plasma protein binding.
The protein binding of dapagliflozin in rat, dog, and human plasma was determined in a 96-well equilibrium dialysis apparatus using dialysis membranes with a 12,000- to 14,000-Da molecular mass cutoff (HTDialysis, LLC, Gales Ferry, CT). The dialysis buffer was 0.133 M sodium phosphate buffer, pH 7.4. Plasma (previously frozen) was spiked with dapagliflozin (1 mM in ACN) to achieve final concentrations of 10 μM. The dialysis was conducted in triplicate for 4 h at 37°C. Aliquots of plasma dialysates were analyzed using an LC/MS/MS method. The unbound fraction (fu) was calculated as the concentration of dapagliflozin in the plasma dialysate divided by the concentration in the spiked plasma. Values are reported as mean ± S.D. for three determinations.
Serum protein binding.
The in vitro protein binding of dapagliflozin in monkey serum was determined by ultrafiltration using Centrifree UP devices with a molecular mass cutoff of >30,000 Da (Millipore Corporation, Billerica, MA). Dapagliflozin (1 mM in ACN) was added to serum in triplicate to yield final concentrations of 10 μM. The serum binding study was conducted at room temperature. After the spiked serum samples were added to the filtration devices, they were centrifuged at a 33° fixed angle for 15 min at 10,000g. Aliquots of serum ultrafiltrate were analyzed using an LC/MS/MS method. The fu was calculated as the concentration of dapagliflozin in the serum ultrafiltrate divided by the concentration in the spiked serum. Values are reported as mean ± S.D. for three determinations.
Blood cell partitioning.
Dapagliflozin (1 mM in ACN) was added to samples of rat, dog, and monkey blood in triplicate to yield final concentrations of 10 μM. Samples were incubated in triplicate at 37°C in a shaking water bath for 2 h. For testing in human blood, 0.5 mM dapagliflozin in ACN/water (1:1, v/v) was added to samples of human blood in triplicate to yield a final concentration of 5 μM, and these samples were incubated at 37°C in an incubator containing 95% O2/5% CO2 for 2 h. Aliquots of blood were removed at 2 h and split into two portions. One portion was treated with an equal volume of water and centrifuged to obtain supernatant. The remaining blood was centrifuged to obtain plasma. Samples were analyzed using LC/MS/MS. A blood/plasma partitioning ratio for dapagliflozin was calculated from the concentrations in blood and plasma.
P450 inhibition studies in pooled HLMs.
A stock solution (30 mM) was prepared by dissolving dapagliflozin in dimethyl sulfoxide (DMSO) and was stored at 2 to 8°C before preparation of solutions of dapagliflozin at concentrations of 0, 0.0045, 0.018, 0.09, 0.36, 1.8, 9, and 45 μM. To determine the IC50 values, HLMs (Lot BMS022 pooled from 19 individuals and Lot 27 pooled from 38 individuals; 0.05–0.25 mg/ml microsomal protein) were incubated in triplicate as described previously (Yao et al., 2007).
P450 induction studies in hepatocytes and sample analysis.
Primary cultures of human hepatocytes were prepared at CellzDirect (Pittsboro, NC) from human liver tissue from three donors (Hu472, Hu476, and Hu477). The P450 induction studies were conducted by CellzDirect, and a brief description of the study is shown below. A fresh stock solution of dapagliflozin was prepared in DMSO on the first day of dosing. Stock solutions were diluted daily in modified Chee's medium to achieve the final dosing concentrations of 0.2, 2, and 20 μM for dapagliflozin and a final DMSO concentration of 0.1%. Primary human hepatocytes were prepared from human liver tissue from three donors. Hepatocytes were isolated by a collagenase perfusion method described previously (LeCluyse et al., 2005). Final cell viability before plating was determined by the trypan blue exclusion test and was greater than 75% in all the cases.
Hepatocyte cultures were treated for 3 consecutive days with medium containing dapagliflozin (0.2, 2, and 20 μM), solvent (0.1% DMSO) controls, or prototypical inducers. Rifampicin (10 μM), phenobarbital (1 mM), and 3-methylcholanthrene (2 μM) were the prototypical inducers used as positive controls for the human hepatocyte cultures. Both daily microscopic inspections of the cultures and monolayers and monitoring of lactate dehydrogenase leakage were used as a measure of cytotoxicity. For RNA determination, cells under identical conditions were incubated for 48 h. No cytotoxicity (changes in cell morphology or attachment) was observed during the incubation period. After the 3-day treatment with test article and controls, cultures of hepatocytes from each treatment group were rinsed twice with ice-cold Hanks' balanced salt solution. Homogenization buffer (50 mM Tris-HCl, pH 7.0, 150 mM KCl, 2 mM EDTA) was added to each dish (0.5 ml/dish), and cells were scraped with a cell scraper. Harvested cells from each treatment were pooled and sonicated with a Vibra-Cell probe sonicator (Sonics and Materials, Danbury, CT) at 40 W for 15 to 20 s. Cell lysates were centrifuged at 9000g for 20 min at 4°C. Supernatants were collected and centrifuged at 100,000g for 60 min at 4°C. Final microsomal pellets were resuspended in 0.25 M sucrose with a Potter-Elvehjem style homogenizer fitted with a Teflon pestle. A small aliquot was taken for protein determination (bicinchoninic acid protein assay), and all the samples were stored at −70°C. Microsomes were diluted in 100 mM potassium phosphate buffer at pH 7.4, spiked with marker substrate, and were equilibrated to 37°C. Total incubation volumes were approximately 0.5 ml, and all the incubations were performed in triplicate. Metabolic reactions were initiated by the addition of NADPH (1 mM final concentration) and stopped at the indicated time points by addition of organic solvent. Samples were then extracted and analyzed for acetaminophen, hydroxybupropion, and 6β-hydroxytestosterone.
After a 48-h incubation, cells from each treatment group were washed with Hanks' balanced salt solution, lysed with RLT buffer (QIAGEN, Valencia, CA) and 1% β-mercaptoethanol, harvested, and stored at −70°C until RNA analysis was done. RNA was isolated using the RNeasy kits (QIAGEN), and total RNA was quantified using a NanoDrop spectrophotometer (Thermo Fisher Scientific, Waltham, MA).
Hepatocyte incubations.
A stock solution of [14C]dapagliflozin (5.6 mM) was prepared in ethanol. [14C]Dapagliflozin, at a concentration of 30 μM, was incubated with fresh hepatocytes from mouse and cryopreserved hepatocytes from rat, dog, monkey, and human for 3 h. A cell concentration of 1 million cells/ml was used. Control substrates 7-ethoxycoumarin and 7-hydroxycoumarin were incubated for 1 h at concentrations of 100 μM. Trypan blue exclusion was used to assess viability. The incubations were carried out in Krebs-Henseleit buffer, pH 7.4, for 3 h in a 37°C chamber that was maintained under an oxygen/carbon dioxide (95:5) and 95% humidity atmosphere. At the end of the incubation, 2 volumes of ACN were added to each sample. The samples were centrifuged at 2500g for 10 min. A 100-μl portion of the supernatant was analyzed by liquid chromatography/mass spectrometry (LC/MS) and scintillation counting. Extent of metabolism of dapagliflozin was calculated by comparing dapagliflozin concentration at 0 h versus 3 h. Cell viability and control substrate turnover were within acceptable limits.
Rat liver microsomal incubation to produce M12.
A stock solution of dapagliflozin was prepared in ACN. Dapagliflozin, at a concentration of 0.98 mM, was incubated at 37°C for 5 h in a 250-ml mixture containing 0.1 M potassium phosphate buffer, pH 7.4, 4.9 mM MgCl2, 6 mM NADPH, 0.48 mg/ml bovine serum albumin, 580 units/ml catalase, and 2 mg/ml protein of pooled rat liver microsomes. The incubation mixture was extracted three times with ethyl acetate (300 ml, 200 ml, and then 200 ml). The combined ethyl acetate extract was evaporated to dryness with a rotary evaporator, and the residue was dissolved in 3 ml of DMSO. After removal of insoluble material by centrifugation (12,000g for 3 min), the DMSO solution was subjected to semipreparative HPLC separation.
Analysis.
Samples from the Caco-2 permeability studies were analyzed on an HPLC system that consisted of the 2690 Waters separation module and a Waters 996 photodiode array detector (Waters, Milford, MA). The column used was YMC octyl dodecyl sulfate (ODS)-AQ 4.6 × 150 mm, 3-μm particle, maintained at 25°C, and a flow rate of 1 ml/min. Caco-2 samples (100 μl) were injected without any sample preparation. An ACN/water gradient system was used for the separation. The amount of ACN in the gradient was increased in a stepwise fashion from 5% ACN to 90% ACN over 6 min, held for 7 min, then re-equilibrated to 5% ACN over 5 min. The mobile phases also contained 0.115% trifluoroacetic acid. Quantitation was based on the UV peak area of dapagliflozin (at 210 nm) in the samples.
Analysis of the metabolites from the probe substrates used in the microsomal incubations was conducted using assays that were developed and validated at Bristol-Myers Squibb Co. (Yao et al., 2007). Quantitation of the metabolites from the three probe substrates used in the P450 induction studies was conducted as described previously (LeCluyse et al., 2005).
The analysis of metabolite profiles in hepatocytes was conducted on an HPLC system that consisted of two Shimadzu LC10AD pumps, a model SCL system controller, a model SIL 10 AD autoinjector, and a model SPD M10A diode-array detector (Shimadzu Scientific Instruments, Inc., Columbia, MD). The column used was Zorbax C18 (4.6 × 250 mm, 5 μm) column (Agilent Technologies, Santa Clara, CA) run at ambient temperature and a flow rate of 0.8 ml/min. Hepatocyte samples were treated with two volumes of ACN, vortexed, centrifuged at 2500g for 10 min, and 25 μl of supernatant was injected onto the LC/MS. The solvent systems used for the separation were composed of ACN and ammonium acetate (10 mM) in water containing 0.1% formic acid. The amount of ACN in the gradient was increased in a stepwise fashion from 10% ACN to 45% ACN over 35 min, to 60% ACN over 5 min, held for 2 min, and then re-equilibrated to 10% ACN over 10 min. The HPLC eluent was split, with 20% going to the mass spectrometer and 80% collected for TopCount scintillation counting (PerkinElmer Life and Analytical Sciences). The fraction collection interval on the TopCount was every 15 s. Profiles were prepared by plotting net counts per minute (CPM) values (CPM from column void volume were subtracted from CPM of subsequent fractions) against retention time. For analysis of positive controls in the hepatocyte study, the same HPLC system was used as above but with a YMC ODS AQ C18 (2.0 × 50 mm, 3 μm) column.
For the purification of M12 from a rat microsomal incubation, extract samples dissolved in DMSO were analyzed on an HPLC system equipped with an ASI-100 autosampler injector (Dionex, Sunnyvale, CA), a UVD 340 UV detector (Dionex), two Varian Prep Star Mode 218 pumps (Varian Inc., Palo Alto, CA), and an ISCO Foxy 200 fraction collector (Teledyne Isco, Lincoln, NE). The column used was a YMC ODS-AQ, 20 × 150 mm, S5 (Waters), and a flow rate of 10 ml/min was used. An ACN/water gradient system was used for the separation. The amount of ACN in the gradient was increased in a stepwise fashion starting with 10% ACN held for 5 min, then to 32% ACN over 2 min, held at 32% ACN for 13 min, and then re-equilibrated to 10% ACN. M12 eluted around 17 min in this system. Fractions containing M12 were pooled and lyophilized.
For the analysis of dapagliflozin in preclinical samples, the HPLC system consisted of two Shimadzu LC10AD pumps, a PerkinElmer Life and Analytical Sciences PE Series 200 autosampler, and a Hewlett Packard (Palo Alto, CA) Series 1100 heated column compartment. The column used was a ProntoSil C30 column, 2 × 50 mm, 5-μm particles (MAC-MOD Analytical, Inc., Chadds Ford, PA), maintained at 60°C. Plasma and urine samples were treated with 3 volumes of ACN (containing a proprietary Bristol-Myers Squibb compound as an internal standard), vortexed, centrifuged at 2500g for 10 min, and 10 μl of supernatant was injected onto the LC/MS. The solvent systems used for the separation were composed of ACN and ammonium acetate (10 mM) in water. The amount of ACN in the gradient was increased in a stepwise fashion from 0% ACN to 100% ACN over 6 min, held for 1.5 min, and then re-equilibrated to 0% ACN over 1 min. The HPLC was interfaced to a Micromass triple quadrupole mass spectrometer (Micromass, Manchester, UK) equipped with an electrospray interface. Data acquisition used multiple reaction monitoring. Positively charged ions representing the [M+NH4]+ for dapagliflozin and [M+H]+ for the internal standard were selected in MS1 and collisionally dissociated with argon to form specific product ions that were subsequently monitored by MS2. The transitions monitored were m/z 426→167 for dapagliflozin (ES+) and m/z 459→427 for the internal standard.
The blood cell partitioning study with human blood was run at a later time, and the analysis of those samples used an HPLC system consisting of two Shimadzu LC10AD pumps and a LEAP Technologies (Carrboro, NC) HTC PAL autosampler. The column used was a YMS ODS (2 × 50 mm, 3-μm particles; Waters) maintained at room temperature. Samples were treated with two volumes of ACN containing [13C6]dapagliflozin, vortexed, and centrifuged at 2500g for 20 min at 4°C. Aliquots of 150 μl in duplicate were transferred to a 96-well shallow filter plate (Millipore Corporation), which was preloaded with 75 μl of ACN and stacked with a 96-deep well receiver plate. After centrifugation, 250 μl of water was added to the receiver plate and mixed with the filtrate. The supernatant (10 μl) was injected onto the LC/MS. The solvent systems used for the separation were composed of ACN and water. The amount of ACN in the gradient was increased in a stepwise fashion from 20% ACN to 80% ACN over 2.5 min, held for 0.3 min, and then re-equilibrated to 20% ACN over 1.2 min. The HPLC was interfaced to a 4000 Q TRAP hybrid triple-quadrupole linear ion trap mass spectrometer equipped with a Turbo V source (Applied Biosystems, Foster City, CA) and run in negative ionization mode. Data acquisition used multiple reaction monitoring. Negatively charged ions representing the [M-H]− for dapagliflozin were selected in MS1 and collisionally dissociated with argon to form specific product ions that were subsequently monitored by MS2. The transitions monitored were m/z 407→329 for dapagliflozin (ES−) and m/z 413→323 for [13C6]dapagliflozin (internal standard).
For the analysis of dapagliflozin in the clinical samples, the HPLC system consisted of two Shimadzu LC10AD pumps and a PerkinElmer Life and Analytical Sciences PE Series 200 autosampler. Samples were extracted from human plasma and urine using a Waters Oasis HLB solid-phase extraction well plate. One hundred fifty microliters of plasma sample was pipetted into a 96-well plate, and then 50 μl of internal standard solution ([13C6]dapagliflozin in ACN) and 200 μl of water were added. The Waters Oasis solid phase extraction plate was conditioned according to manufacturer directions. Samples were loaded into the extraction wells, followed by 400 μl of water and then 400 μl of 10% methanol in water. Samples were eluted with 2 × 300 μl of ACN. Eluate was evaporated at 40°C under nitrogen and reconstituted in 100 μl of 0.1% ammonium hydroxide in 10% ACN in water. The sample was vortexed, centrifuged at 1500g for 3 min, and 10 μl of supernatant was injected onto the HPLC. The chromatographic separation was carried out on a SunFire C18 column, 2.1 × 50 mm, 5-μm particles (Waters), and run at ambient temperature. The solvent systems used for the separation were composed of ACN and water. The amount of ACN in the gradient was increased in a stepwise fashion from 20% ACN to 30% over 0.5 min, then to 80% ACN over 2.5 min, held for 0.3 min, then re-equilibrated to 20% ACN over 0.2 min, and held for 1 min. The HPLC was interfaced to a Quattro Ultima mass spectrometer (Waters) equipped with an electrospray interface and run in negative ionization mode. Data acquisition used selective reaction monitoring. The transitions monitored were the same as those for the human blood cell partitioning study.
Plasma samples at 1, 4, and 12 h were profiled for metabolites using the same HPLC procedure as for the hepatocyte incubations [the total radioactivity measurements were below quantifiable limit (BQL) after 24 h; therefore, the 48- and 144-h samples were not profiled]. The plasma samples were loaded into the extraction wells, followed by 400 μl of water, and then 2 × 400 μl of 10% methanol in water. Samples were eluted with 2 × 400 μl of methanol. The eluted fractions were evaporated to dryness under nitrogen and reconstituted in 400 μl of methanol/water (25:75, v/v). After centrifugation, a 100-μl portion was analyzed by HPLC for biotransformation profiling and mass spectral analysis. Radioactivity at the retention time correlating to the glucuronide conjugate of dapagliflozin M15 was also quantified and converted to concentration using a specific activity of 2.07 μCi/mg. Total radioactivity was determined in these plasma samples by liquid scintillation counting.
Pharmacokinetic data analysis.
All the plasma concentration versus time data of dapagliflozin were analyzed by noncompartmental methods (Gibaldi, 1982) using the KINETICA software program (version 4.2; Thermo Fisher Scientific). For the analysis of preclinical samples, the area under the concentration/time curve (AUC)0-n and AUCtot values were calculated using a combination of linear and log trapezoidal summations. The total body clearance (CL), mean residence time (MRT), half-life (t1/2), and steady-state volume of distribution (Vss) were calculated using noncompartmental methods after intravenous administration: CL = dose/AUCT; MRT = area under the moment curve/AUC; t1/2 = MRT · 0.693; and Vss = CL · MRT. Plasma clearance values were corrected for blood to plasma ratios, experimentally obtained in the various species, to compare blood clearance values with standard values for liver blood flow reported in the literature (Davies and Morris, 1993). The Vss values were compared with total body water reported for the various species (Davies and Morris, 1993). The absolute oral bioavailability (expressed as percentage) was estimated by comparing the ratio of dose-normalized AUC values after oral doses with those after intravenous doses. To obtain the percentage of dose excreted in urine, the amount of dapagliflozin excreted in the urine in a given time interval was divided by the total dose given and multiplied by 100 to obtain the percentage of dose excreted in that interval. To calculate renal clearance (CLR), the amount of drug excreted in the urine over a 24-h period was divided by AUCpo and was compared with glomerular filtration rate (GFR) · fu to assess whether net active renal transport was present (if CLR > GFR · fu, net renal secretion is suggested; if CLR < GFR · fu, net renal absorption is suggested). GFR values for the different species were obtained from the literature (Davies and Morris, 1993).
For the analysis of clinical samples, the slopes of the terminal phases of the plasma dapagliflozin and plasma TRA concentration-time profiles, λ, were determined by log-linear regression of at least three data points that yielded a minimum mean square error. The absolute values of λ were used to estimate the apparent terminal half-lives of plasma dapagliflozin and plasma TRA by t1/2 = 2/λ. The areas under the plasma dapagliflozin and TRA concentration-time curves from zero extrapolated to infinite time, AUCtot, were calculated by log- and linear-trapezoidal summations over the collection time, with the last quantifiable plasma concentration being divided by λ and the product added to the total area. The total apparent (oral) body clearance was calculated using CL/oral bioavailability (F) = dose/AUC. The calculated half-life is after an oral dose.
For the clinical urine samples, the percentage of total radioactivity excreted in the urine was calculated as described above based on the total radioactive dose. For dapagliflozin excretion, chromatographic separation of the dapagliflozin and scintillation counting was described in the above sections, and the percentage of dose excreted was calculated as described above.
Prediction of CL and CL/F in humans.
Allometric scaling was used to estimate the human clearance of dapagliflozin by using the body weight of the animal and the corresponding clearance values. The animal clearance values after correction for interspecies differences in plasma protein binding (data not shown) were also used and that predicted clearance compared with the value from simple allometry. To compare the predicted clearance from allometry with the apparent clearance after an oral dose, the predicted clearance was divided by the average oral bioavailability of the animal species (64%).
Results
Caco-2 Permeability and P-gp Interactions.
The permeability coefficient of dapagliflozin in the apical (A) to basolateral (B) direction was 60 nm/s at an initial concentration of 50 μM at pH 7.4. This value is comparable with compounds that exhibit moderate absorption in humans (Marino et al., 2005). Under the same conditions, the average B-to-A permeability coefficient value of dapagliflozin was 227 nm/s (BA/AB ratio of 3.8). In the presence of a P-gp inhibitor, the A-to-B permeability of dapagliflozin was 159 nm/s, and the B-to-A permeability was 188 nm/s (BA/AB ratio decreased to 1.2). The BA/AB ratio of 3.8 and the decrease of P-gp-mediated efflux (in the presence of a P-gp inhibitor) suggest that dapagliflozin may be a P-gp substrate.
To evaluate whether dapagliflozin inhibits the transport of P-gp substrates, the permeability of digoxin was measured across Caco-2 cell monolayers in the presence and absence of dapagliflozin at 10 μM. Dapagliflozin showed weak inhibition of digoxin transport (10% at 10 μM). The inhibition value for verapamil (a known P-gp inhibitor) was 65% at 10 μM in this experiment. These results suggest the dapagliflozin is unlikely to be a P-gp inhibitor.
Plasma and Serum Protein Binding.
The plasma protein binding of dapagliflozin was determined by the equilibrium dialysis technique at 10 μM and was found to be 95, 93, and 91% in rat, dog, and human, respectively. The serum protein binding of dapagliflozin in cynomolgus monkeys was determined by the ultrafiltration technique at 10 μM and was found to be 91%. Control studies established that dapagliflozin was stable in rat, dog, monkey, and human serum at 10 μM for 4 h at 37°C.
Blood Cell Partitioning.
The blood/plasma ratios were found to be 0.71, 0.61, 0.73, and 0.88 in rat, dog, monkey, and human, respectively. These ratios reflect limited distribution of dapagliflozin to red blood cells.
Results from P450 Inhibition in HLM.
Dapagliflozin showed no relevant direct inhibitory effects on the activities of CYP1A2, CYP2A6, CYP2B6, CYP2C8, CYP2C9, CYP2C19, CYP2D6, and CYP3A4, as the IC50 values were estimated to be greater than the highest concentration of dapagliflozin evaluated (45 μM). The various known inhibitors that were incubated with the different P450 enzymes did show the expected inhibitory responses (data not shown).
P450 Induction in Human Hepatocytes.
There was no marked induction of CYP1A2, CYP2B6, or CYP3A4 when monitored by mRNA or enzyme activity observed for dapagliflozin at the concentrations tested (0.2–20 μM). The mRNA analysis and the enzyme activity revealed robust (10–26-fold) increases in hepatocyte cultures treated with positive controls (3-methylcholanthrene, phenobarbital, and rifampicin) and little or no changes in cultures treated with dapagliflozin.
Metabolite Profiles from Hepatocyte Incubations.
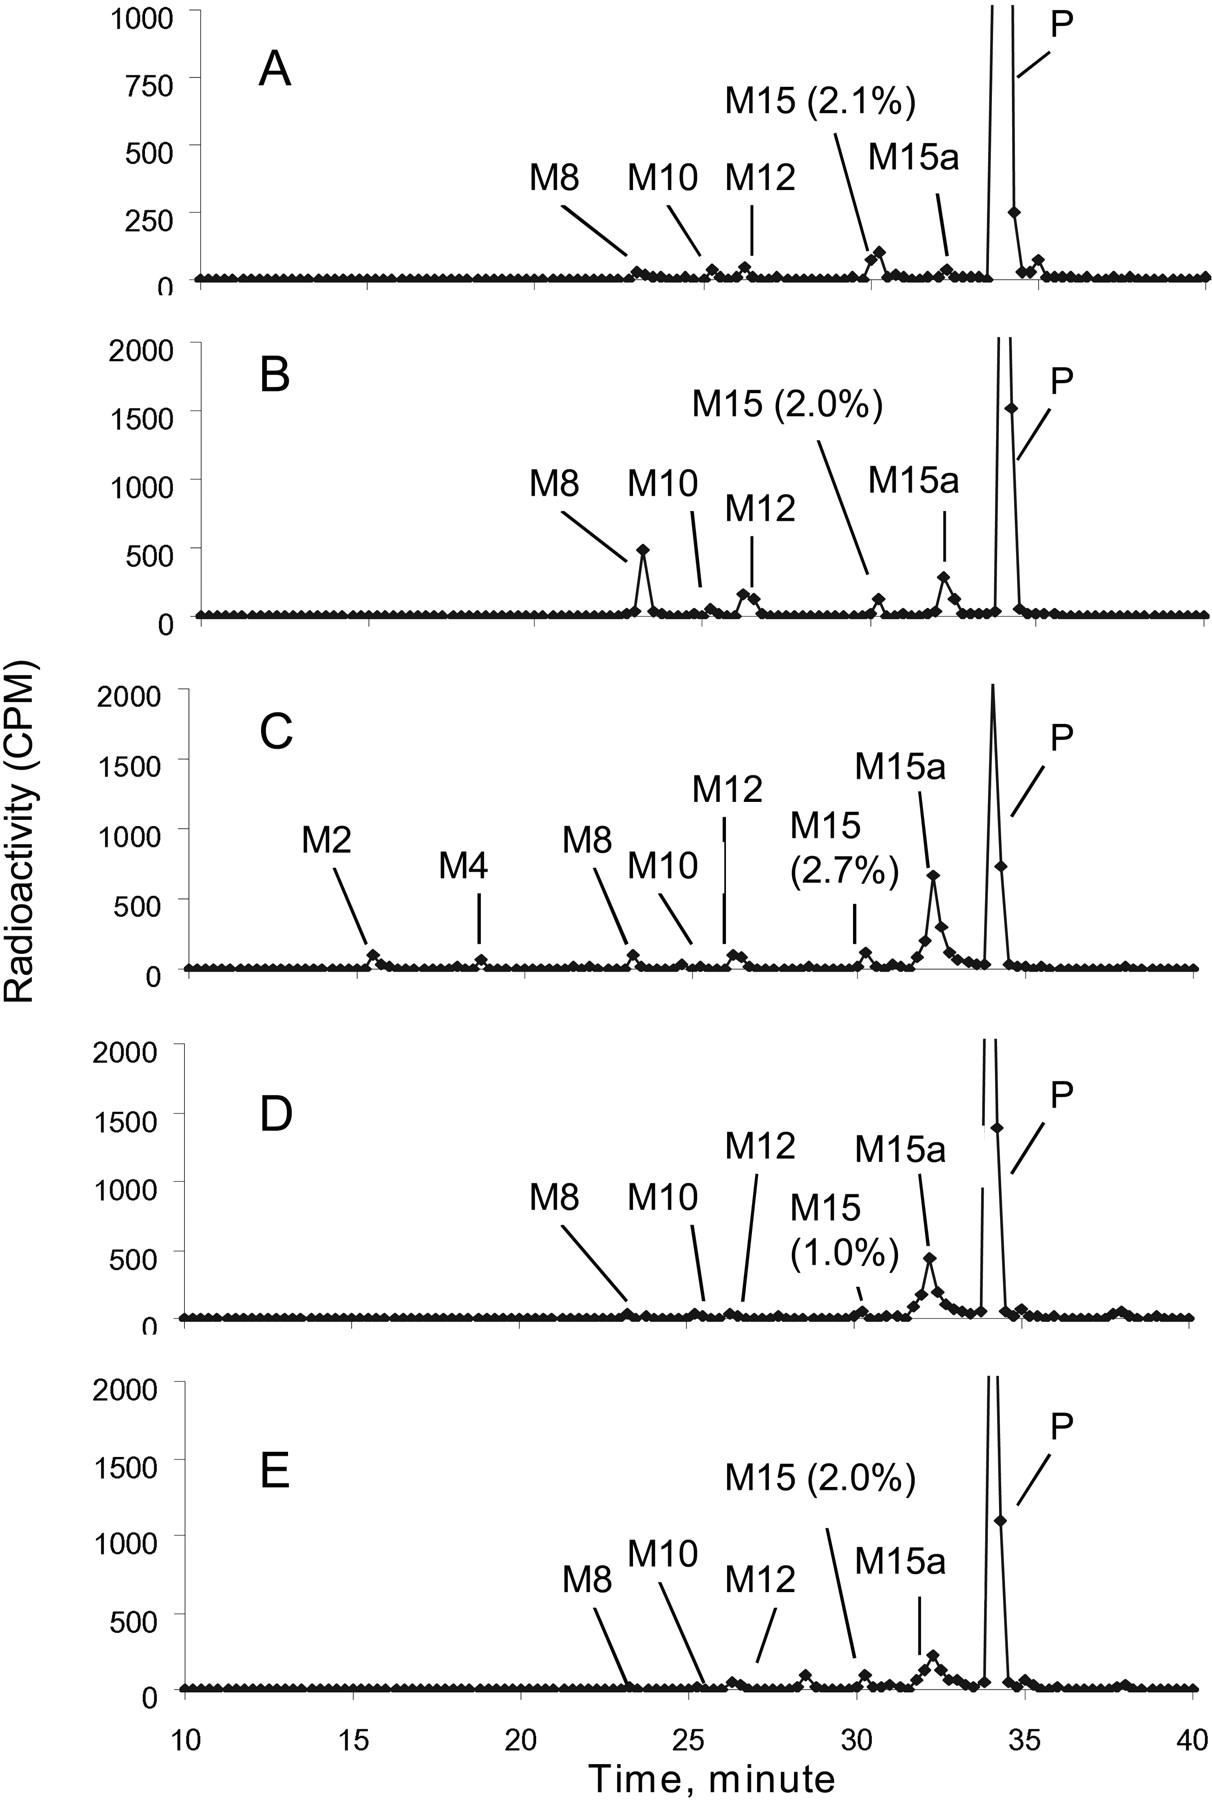
Metabolite profiles of [14C]dapagliflozin after incubation for 3 h with hepatocyte preparations from mouse, rat, dog, monkey, and human are shown in Fig. 1. Dapagliflozin was the major peak in all the hepatocyte incubations. The extent of turnover of dapagliflozin in hepatocytes was 50% in rat, 26% in mouse, 24% in dog, 25% in monkey, and 10% in human. All the metabolites observed in human hepatocyte incubations were also observed in the animal incubations. In human hepatocytes, M15 was the major metabolite, accounting for 2.1% of the total radioactivity in the sample, with all the other metabolites accounting for <0.9% of the total radioactivity.

Metabolite profiles of [14C]dapagliflozin after incubation with hepatocytes from human (A), mouse (B), rat (C), dog (D), and monkey (E).
Metabolites formed in incubations with hepatocytes were characterized by LC/MS/MS. The mass spectra of dapagliflozin and metabolites M8, M12, and M15 are shown in Fig. 2. The evidence for the assignment of the structure of each metabolite is discussed below. Dapagliflozin gave an ammonia adduct (M+NH4)+ and had an m/z of 426 Da. LC/MS/MS analysis showed product ions resulting from sequential losses of water: at m/z 391 from loss of 35 (−H2O, −NH3), at m/z 373 from loss of H2O (18 Da), and at m/z 355 from loss of H2O (18 Da). This retention time and mass spectra were identical to a matched authentic standard of dapagliflozin. Based on the m/z of 574 for the M2 ammonia adduct (M+NH4)+, M2 was identified as a glucuronide conjugate arising after O-deethylation of dapagliflozin. LC/MS/MS could not reveal the site of conjugation as being the phenol moiety. LC/MS/MS data could not be obtained for metabolite M4, in part because of its low abundance in rodent hepatocytes. Metabolite M8 was identified as the O-deethylated phenol arising from dealkylation of dapagliflozin because it exhibited the same retention time, m/z of 398 for the ammonia adduct, and mass spectra as those of the authentic phenol standard (BMS-511926). M10 was tentatively identified as a glucuronide conjugate of dapagliflozin because the ammonia adduct of M10 had an m/z of 602, and LC/MS/MS analysis revealed a product ion at m/z of 391 arising from loss of 176 Da (suggestive of a glucuronide moiety) and 35 Da (−NH3, −H2O). M12 was tentatively identified as a hydroxylation product of dapagliflozin because the ammonia adduct of M12 had an m/z of 442, and LC/MS/MS analysis showed product ions at m/z 407 from loss of 35 Da. Purification of the material from a large-scale incubation of dapagliflozin with rat liver microsomes allowed identification of the metabolite as a product of benzylic hydroxylation (BMS-639432), although the stereochemistry at the site of modification was not assigned. M15 was also identified as a glucuronide conjugate of dapagliflozin because the ammonia adduct of M15 had an m/z of 602, and an LC/MS/MS analysis showed product ions at m/z 409 from a loss of 193 Da, which was because of a loss of NH3 (17 Da) and glucuronide (176 Da). The ammonia adduct of M15a had an m/z of 442 (16 mass units greater than the ammonia adduct of dapagliflozin), which appeared to be an oxidative metabolite, but were not otherwise characterized. The ammonia adduct of M16 had an m/z of 440 (14 mass units greater than the ammonia adduct of dapagliflozin). From its mass spectra, the cleavage of the sugar ring to form an m/z of 289 confirms that the oxidation could only occur on the hydroxymethyl group of the sugar ring. Thus, M16 was tentatively identified as an oxidative metabolite of dapagliflozin. This peak was not adequately separated from dapagliflozin to allow quantification; however, it was judged to be very minor in a separate analysis of select samples with radioflow detection. Structures for the major metabolites, as well as the position of the 14C-label, can be found in the metabolic pathway shown in Fig. 3.
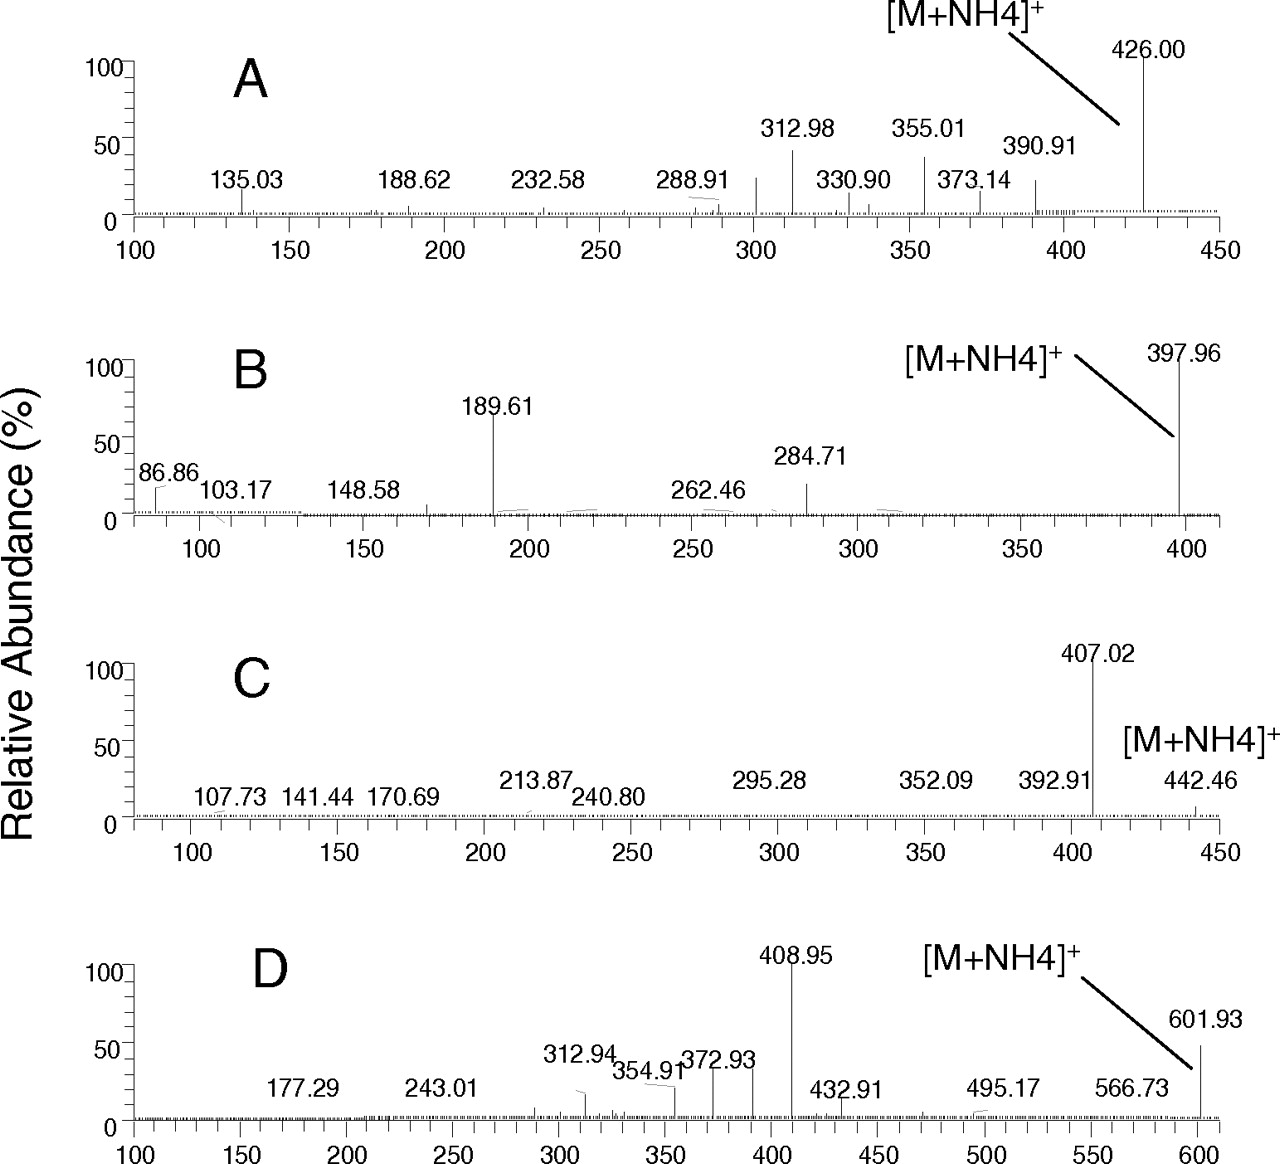
Positive-ion MS/MS spectra of dapagliflozin (A) and three major metabolites—M8 (BMS-511926) (B), M12 (BMS-639432) (C), and M15 (dapagliflozin glucuronide) (D)—observed in hepatocytes. Refer to Fig. 3 for the assignment of fragments.

Metabolic pathway for dapagliflozin in hepatocytes; fragment assignments for dapagliflozin and metabolites.
Pharmacokinetics and Bioavailability of Dapagliflozin after Single Doses in Rats, Dogs, and Monkeys.
The main pharmacokinetic parameters for dapagliflozin for all the species tested are summarized in Table 1, and the plasma profiles are shown in Fig. 4. The clearance values reported in Table 1 are plasma clearance values, which below are corrected for blood/plasma ratios, for comparison with liver blood flows.
Pharmacokinetic parameters of dapagliflozin in preclinical species after single intravenous or oral doses and in humans after single oral dose

Dapagliflozin concentrations in plasma of rats (A), dogs (B), and monkeys (C) after intravenous or intra-arterial and oral administration of 1, 6.6, and 6 mg/kg, respectively. Each point represents the mean of three determinations.
In the rat, the systemic blood clearance of dapagliflozin was 6.8 ± 0.8 ml/min/kg, which is ∼12% of hepatic blood flow. The blood clearance was calculated by dividing the plasma clearance by the blood/plasma ratio; for rat those values were 4.8 ml/min/kg and a ratio of 0.71. The Vss was high (1.6 ± 0.1 l/kg) compared with 0.7 l/kg for total body water in the rat, indicating extravascular distribution. The estimated elimination half-life after intra-arterial administration was 4.6 ± 0.8 h, and the mean residence time was 5.6 ± 0.9 h. The F of dapagliflozin was 84%. The time to reach peak concentrations (Tmax) after an oral dose was 1.7 ± 2.0 h.
In the dog, the systemic blood clearance of dapagliflozin was 2.5 ± 0.3 ml/min/kg, which is ∼8% of hepatic blood flow in the dog. The Vss was 0.8 ± 0.1 l/kg, similar to total body water in the dog (0.6 l/kg), indicating modest extravascular distribution. The estimated elimination half-life after intravenous administration was 7.4 ± 1.2 h, and the mean residence time was 9.3 ± 0.7 h. The F of dapagliflozin was 83 ± 2%. The Tmax after an oral dose was 0.6 ± 0.4 h. The percentage of dose excreted in the urine as dapagliflozin, over a 24-h period, was 3.4 ± 0.2% after an oral dose of 6.6 mg/kg. The CLR was 0.7 ml/min, and GFR · fu was 4.3 ml/min.
In the monkey, dapagliflozin was cleared more quickly than in the dog, with a systemic blood clearance of 8.8 ± 3.1 ml/min/kg, approximately 20% of hepatic blood flow in the monkey. The Vss was 0.8 ± 0.2 l/kg, similar to total body water (0.7 l/kg), indicating modest extravascular distribution. The estimated elimination half-life after intravenous administration was 3.5 ± 1.9 h, and the mean residence time was 2.2 ± 0.5 h. The F of dapagliflozin was 25 ± 2%. The Tmax after an oral dose was 1.9 ± 1.8 h. The percentage of dose excreted in the urine as dapagliflozin, over a 24-h period, was 3.8 ± 0.3% after an oral dose of 6 mg/kg. The CLR was 5.7 ml/min, and GFR · fu was 0.9 ml/min.
Prediction of Pharmacokinetics in Humans.
The human systemic plasma clearance was predicted to be 2.1 ml/min/kg from simple allometry (CL = 4.26 · body weight0.83, R2 = 0.87; Fig. 5). Using the blood/plasma ratio of 0.88 in human serum, this is a blood clearance of 2.4 ml/min/kg, corresponding to 11% of hepatic blood flow. The plasma clearance, when divided by the average bioavailability across the animal species (64%), corresponds to a predicted oral clearance of 3.3 ml/min/kg. The systemic plasma clearance value after correction for protein binding was 1.9 ml/min/kg (oral clearance of 3.0 ml/min/kg). Correction of the plasma clearance with metabolism rates was not done, given the interspecies differences in metabolite profiles in hepatocytes.

Allometric scaling plot of plasma clearance values from preclinical species.
Pharmacokinetics of Dapagliflozin after a Single Dose to Humans.
Dapagliflozin was rapidly absorbed after oral administration of the 50-mg dose with maximum plasma concentrations (Cmax) attained within 1 h after administration in a fasted state (Table 1). The mean terminal half-life (t1/2) value for dapagliflozin was 13.8 h. The observed oral plasma clearance was 4.9 ml/min/kg. The amount of total radioactivity recovered in the urine was 75.2%; the amount of unchanged dapagliflozin recovered in urine was 1.6%. The CLR was 5.6 ml/min, and GFR · fu was 10.8 ml/min.
Figure 6 shows the plasma profile of dapagliflozin compared with plasma profile of total radioactivity. The levels of total radioactivity were approximately 3-fold higher than the levels of dapagliflozin. Five time points (at 1, 4, 12, 48, and 144 h) were sampled for biotransformation analysis. Dapagliflozin and M15 levels were quantitated as described under Materials and Methods. Time points after 96 h were BQL for dapagliflozin. The total radioactivity measurements were BQL after 24 h. Figure 7 shows the levels of dapagliflozin and M15 compared with the total radioactivity at 1, 4, and 12 h. The sum of dapagliflozin + M15 concentrations accounted for >72% of the total plasma radioactivity at all the time points.

Dapagliflozin and total radioactivity in human plasma after oral administration of a single 50-mg dose of [14C]dapagliflozin. Each point represents the mean of six subjects.

Dapagliflozin, M15, and total radioactivity in human plasma at selected time points where M15 was analyzed after oral administration of a single 50-mg dose of [14C]dapagliflozin.
Discussion
Optimal treatment for hyperglycemia in type 2 diabetes still remains a major clinical challenge. Inhibition of SGLT offers great potential as a novel mode of treating hyperglycemia, without some of the common side effects and stress on β cells; thus, progression of the disease may possibly be altered with this class of drugs. Because of the side effects of nonselective inhibition of SGLT and enzymatic instability of O-glucoside inhibitors in many tissues, there is a medical need for more hydrolytically stable C-glucosides that are SGLT2-selective, such as dapagliflozin.
To aid in compound selection and to determine whether dapagliflozin was a suitable compound for progression into the clinic, the pharmacokinetics in animals and important ADME parameters were obtained. The plasma clearance of dapagliflozin was low in the three species investigated. The volume of distribution values ranged from total body water in the dog and monkey to approximately 2-fold total body water in the rat. The elimination half-lives were moderate in the rat (4.6 h) and dog (7.4 h) but lower in the monkey (3.5 h). The plasma and serum (monkey) protein binding for dapagliflozin was found to be moderate to high, ranging from 91 to 95% in preclinical species and 91% in humans. Bioavailability values ranged from >80% in the rat and dog to 25% in the monkey. The predicted oral clearance using the clearance values from simple allometry was 3.3 ml/min/kg based on an average bioavailability value calculated from the different species.
The intrinsic permeability seen for dapagliflozin across Caco-2 cells was comparable with compounds that exhibit good absorption in humans (Marino et al., 2005) and would indicate good systemic bioavailability of the compound after oral administration. The efflux ratio of 3.8 seen in Caco-2 cells suggests that dapagliflozin may be a P-gp substrate, but it exhibits high intrinsic permeability in the Caco-2 cells and good bioavailability in rats and dogs; thus, absorption and bioavailability were predicted to be adequate in humans. It is possible that the doses in rats and dogs were enough to saturate the P-gp transporter at the level of the intestinal lumen and led to the observed good bioavailability; however, dapagliflozin showed linear pharmacokinetics over a very large dose range in both species. Therefore, it is more likely that passive permeability dominates the absorption of the compound. P-gp can play a role in drug disposition at the level of the kidney (Li et al., 2006). Although the comparison of GFR · fu with CLR for monkeys and dogs does indicate that some active renal processes may be occurring, it should be noted that the urinary excretion of dapagliflozin is very low in all the species; thus, the action of P-gp on the disposition of dapagliflozin at the renal level may not be relevant. And although the bioavailability in the monkey is much lower than in other species, factors other than renal transport are governing the lower oral exposure.
In incubations with human hepatocytes, a glucuronide conjugate (M15) of dapagliflozin was found to be the major metabolite. Glucuronides of dapagliflozin (M15 and M10) were also found in the animal hepatocyte incubations. Dapagliflozin was not found to be an inhibitor or an inducer of P450 enzymes. The overall favorable ADME properties of dapagliflozin in animals, the favorable predicted parameters in humans, and the overall safety and efficacy of the compound in preclinical testing led to the progression of the compound into clinical trials (Komoroski et al., 2009a,b; List et al., 2009).
Dapagliflozin, administered to healthy subjects as an oral solution of 50 mg, was rapidly absorbed from the gastrointestinal tract with Tmax <1 h and appeared to be safe and well tolerated. Based on the urinary recovery of total radioactivity in that study, the systemic absorption of orally administered dapagliflozin was at least 75% within 24 h of dosing (data not shown). Thus, P-gp does not appear to be limiting the absorption of dapagliflozin in humans. The urinary excretion of (parent) dapagliflozin is very low; therefore, the contribution of renal clearance to the total clearance of dapagliflozin is very small.
In plasma, the ratio of the dapagliflozin concentration to the TRA at any one time point was approximately 0.3 of TRA, suggesting that metabolites account for a significant portion of dapagliflozin-related compounds in the plasma. Indeed, the major metabolite identified in human hepatocytes was also found to be a major circulating metabolite in the clinical samples. This nonpharmacologically active glucuronide conjugate, M15 (further characterization to be discussed in a future publication), was found in human plasma at concentrations similar to dapagliflozin. M15 was cleared similarly to dapagliflozin as indicated by the comparable slopes of their elimination phases. Levels of M15 were significant in all the species used for toxicological evaluation (data not shown) relative to levels in humans.
Allometry rather than in vitro data was used to predict human clearance for a number of reasons. Clearance predictions from microsomal incubations with NADPH, accounting for only oxidative metabolism, or from microsomal incubations with UDP-glucuronic acid were not done as the predicted clearance values often underpredict observed values for drugs cleared by glucuronidation and are highly dependent on incubation conditions (Kilford et al., 2009). Although hepatocytes have been shown to produce better predictive results for drugs cleared by glucuronidation, the preclinical studies with hepatocytes did not give enough dapagliflozin turnover to reliably determine an intrinsic clearance. Thus, allometry was used as a reasonable alternative. The oral clearance (3.3 ml/min/kg) predicted from simple allometry is close to the observed value (4.9 ml/min/kg); correcting for protein binding resulted in a very similar prediction of oral clearance (3.0 ml/min/kg). Dapagliflozin is a low clearance compound in humans.
In summary, dapagliflozin is a potent inhibitor of SGLT2 and shows a reduction in plasma glucose in animal models (Han et al., 2008; Meng et al., 2008). The preclinical characteristics and pharmacokinetics of dapagliflozin supported its progression into clinical trials, with no unusual drug-drug interaction potential or distribution properties being shown. This novel compound looks very promising as an additional therapy for hyperglycemia, with the potential of becoming a major therapy.
Acknowledgments.
We thank Jinnan Cai from Bristol-Myers Squibb Bioanalytical Sciences (Princeton, NJ) for excellent analytical support; Dr. Sam Bonacorsi and Kai Cao from Bristol-Myers Squibb Radiochemistry (New Brunswick, NJ) for providing the labeled dapagliflozin for studies; and Drs. Aberra Fura, Praveen Balimane, and Punit Marathe for helpful comments on the manuscript.
Footnotes
Article, publication date, and citation information can be found at http://dmd.aspetjournals.org.
doi:10.1124/dmd.109.029165.
↵
 The online version of this article (available at http://dmd.aspetjournals.org) contains supplemental material.
-
- SGLT
- sodium-glucose cotransporter
- ADME
- absorption, distribution, metabolism, and excretion
- dapagliflozin/BMS-512148
- (2S,3R,4R,5S,6R)-2-(3-(4-ethoxybenzyl)-4-chlorophenyl)-6-hydroxymethyl-tetrahydro-2H-pyran-3,4,5-triol
- HPLC
- high-performance liquid chromatography
- P450
- cytochrome P450
- HLM
- human liver microsome
- ACN
- acetonitrile
- LC/MS/MS
- liquid chromatography/tandem mass spectroscopy
- TRA
- total radioactivity
- P-gp
- P-glycoprotein
- GF120918
- N-(4-[2-(1,2,3,4-tetrahydro-6,7-dimethoxy-2-isoquinolinyl)ethyl]-phenyl)-9,10-dihydro-5-methoxy-9-oxo-4-acridine carboxamide
- fu
- fraction unbound
- DMSO
- dimethyl sulfoxide
- LC/MS
- liquid chromatography/mass spectrometry
- ODS
- octyl dodecyl sulfate, C18
- CPM
- counts per minute
- BQL
- below quantifiable limit
- AUC
- area under the concentration/time curve
- CL
- total body clearance
- MRT
- mean residence time
- Vss
- volume of distribution at steady state
- CLR
- renal clearance
- GFR
- glomerular filtration rate
- F
- oral bioavailability
- A
- apical
- B
- basolateral
- Tmax
- time that peak concentrations are reached
- BMS-511926
- 2S,3R,4R,5S,6R)-2-(4-chloro-3-(4-hydroxybenzyl)phenyl)-6-(hydroxymethyl)tetrahydro-2H-pyran-3,4,5-triol
- BMS-639432
- 2S,3R,4R,5S,6R)-2-(4-chloro-3-((4-ethoxyphenyl) (hydroxy)methyl)phenyl)-6-(hydroxymethyl)tetrahydro-2H-pyran-3,4,5-triol.
- Received July 1, 2009.
- Accepted December 7, 2009.

- Copyright © 2010 by The American Society for Pharmacology and Experimental Therapeutics


