


Abstract
The hepatic disposition of estradiol 17β-d-glucuronide (E217G), a substrate of the organic anion-transporting polypeptides Oatp1a1, Oatp1a4, and Oatp1b2, was investigated in Wistar and TR− [multidrug resistance-associated protein (Mrp) 2-mutant] rats to elucidate how absence of Mrp2, the major excretory transporter for both E217G and its 3-sulfate metabolite (E23S17G), affected the net sulfation. With absence of Mrp2, lower microsomal desulfation activity and higher Mrp3 but unchanged immunoreactive protein expression of other transporters (Oatps and Mrp4) and estrogen sulfotransferase were found in TR− rats. In recirculating, perfused liver preparations, the rapid decay of E217G and sluggish appearance of low levels of E23S17G in perfusate for Wistar livers were replaced by a protracted, biexponential decay of E217G and greater accumulation of E23S17G, whose levels reached plateaus upon the almost complete obliteration of biliary excretion of E217G and E23S17G in the TR− liver. Much higher amounts of E217G (28×) and E23S17G (11×) in liver and reduced net sulfation (40 ± 6 from 77 ± 6% dose, P < 0.05) were observed at 2 h for the TR− versus the Wistar rats. With use of a physiologically based pharmacokinetic model, analytical solutions for the areas under the curve for the precursor and metabolite were obtained to reveal how enzyme- and transporter-mediated processes affected the hepatic disposition of the precursor and metabolite in futile cycling. The analytical solutions were useful to explain transporter-enzyme interplay in futile cycling and predicted that a shutdown of Mrp2 function led to decreased net sulfation of E217G by raising the intracellular concentration of the metabolite, E23S17G, which readily refurnished E217G via desulfation.
The liver is the most important drug eliminatory organ and involves enzymes and basolateral influx/efflux and canalicular transporters for entry and elimination. The basolateral influx transporters [organic anion-transporting polypeptides (Oatps), sodium-dependent taurocholate-cotransporting polypeptide, organic anion transporter 2, and organic cation transporter 1] regulate the entry of substrate into the cell to undergo metabolism by phase I and/or phase II enzymes. Then both the parent drug and phase II metabolites are subject to canalicular transport via P-glycoprotein, multidrug resistance-associated protein (MRP) 2, the bile salt export pump, and breast cancer resistance protein, whereas basolateral efflux occurs via MRP3 and MRP4 into sinusoidal blood. Although metabolism is normally deemed to be irreversible, the metabolite, on occasion, may re-form the parent drug. This phenomenon, known as “reversible metabolism” or “futile cycling,” describes the interconversion between the parent drug and its metabolite and can occur between a precursor and its phase I (Meffin et al., 1983; Baillie et al., 2001) or phase II (Hansel and Morris, 1996; Grubb et al., 1999) metabolites. For example, the sulfated metabolite formed via sulfotransferases (SULTs) in the cytosol may access the arylsulfatases in the endoplasmic reticulum to become desulfated to re-form the parent drug (Ratna et al., 1993; Kauffman et al., 1998). Acinar heterogeneity of the SULTs further complicates the scenario (Xu et al., 1993; Tan et al., 2001).
A well-stirred liver model with membrane barriers has been shown to be useful to relate the physiological and biochemical factors to hepatic drug and metabolite processing (Sirianni and Pang, 1997; Liu and Pang, 2005; Sun and Pang, 2010). In brief, transporter or enzyme activity is denoted by the intrinsic clearance or the ratio of Vmax, the maximum rate of the enzyme or transporter-mediated process, and Km, the Michaelis-Menten constant, under linear conditions. CLin and CLef relate to the summed transport activities due to the influx and efflux transporters and passive diffusion, respectively, at the basolateral membrane; CLint,met is the enzymatic metabolic activity, and CLint,sec is the canalicular, secretory transporter activity. Solutions for the apparent total liver, metabolic, and excretory clearances (CLliver,tot, CLliver,met, and CLliver,ex, respectively) for a drug that is metabolized irreversibly had revealed that all of these transport and metabolic intrinsic clearances modulate the apparent clearances of alternate pathways. The CLliver,met is dependent not only on CLint,met but also on CLint,sec. Similarly, CLint,met appears in the solution of CLliver,ex. Accordingly, the interplay between enzymes and canalicular efflux transporters was described as a “see-saw” phenomenon (Sirianni and Pang, 1997; Liu and Pang, 2005), because both enzymes and canalicular efflux transporters would compete for the intracellular substrate. An increase in CLint,sec would lead to an increase in the CLliver,ex and CLliver,tot but would result in decreased CLliver,met, the compensatory pathway of drug elimination. The opposite trend would arise when CLint,sec is decreased. Analogous changes in the apparent clearances would result with changes in CLint,met (Liu and Pang, 2005). However, the transporter-enzyme interplay in the presence of futile cycling remains unknown.
Transporter or enzyme activity can be perturbed with use of a specific inhibitor or inducer and knockout or knockdown of the target gene, whereby the resultant changes in drug processing can be evaluated. The Groningen Yellow/transport-deficient (TR−) rats are derived from Wistar rats but lack functional Mrp2 because of a single nucleotide substitution in the Mrp2 gene (Jansen et al., 1985; Müller et al., 1996; Ito et al., 1997). This renders the TR− rat as a useful animal model to assess the role of Mrp2 in drug biliary excretion as well as the interplay of Mrp2 and other transporters and enzymes (Xiong et al., 2000). In this article, the effect of Mrp2 on net sulfation and futile cycling of estradiol 17β-d-glucuronide (E217G) and its 3-sulfated metabolite (E23S17G) was assessed by comparison of their disposition in recirculating, perfused TR− (lacking Mrp2) and Wistar rat liver preparations. In the rat liver, E217G is taken up efficiently by Oatp1a1, Oatp1a4, and Oatp1b2 at the basolateral membrane (Cattori et al., 2001). In rat hepatocytes, E217G is sulfated mainly by the estrogen sulfotransferase (Sult1e1) to form E23S17G, which is desulfated back to re-form E217G by arylsulfatase C (Sun et al., 2006); both E217G and E23S17G are secreted into bile, predominantly via Mrp2 (Morikawa et al., 2000). Mrp3 and Mrp4 are expressed at low levels under physiological conditions and, when up-regulated, would play an important role by enhancing the efflux of E217G and E23S17G back to the blood.
Materials and Methods
Materials and Animals.
[6,7-3H]E217G (specific activity 46.9 Ci/mmol) was purchased from PerkinElmer and Analytical Life Sciences (Waltham, MA). [6,7-3H]E23S17G was biosynthesized by recirculation of [6,7-3H]E217G (∼100,000 dpm/ml) in blood perfusate at 12 ml/min through the rat liver. The bile was pooled and lyophilized and then reconstituted and injected into a high-performance liquid chromatograph (see HPLC Methods); the eluant fractions corresponding to [6,7-3H]E23S17G (retention time 12–13 min) were pooled and desalted by a reverse-phase Sep-Pak cartridge (Waters, Milford, MA), and the purified content was concentrated and stored at −20°C. The radiochemical purities of [6,7-3H]E217G and [6,7-3H]E23S17G were measured by HPLC as 98 and 97%, respectively. Unlabeled E217G, 4-methylumbelliferyl sulfate (4-MUS), and bovine serum albumin in Tyrode's solution were obtained from Sigma-Aldrich Canada (Mississauga, ON, Canada). Dextrose 50% USP injection was obtained from Abbott Laboratories (Montreal, QC, Canada), and Dextran T40 was purchased from GE Healthcare (Uppsala, Sweden). Antibodies for Oatp1a1 and Oatp1a4 were kind gifts from Dr. Allan W. Wolkoff (Albert Einstein College of Medicine, Bronx, NY); the antibody for Oatp1b2 was kindly provided by Dr. Richard B. Kim (University of Western Ontario, London, ON, Canada). The Sult1a1 antibody was donated by Dr. Charles N. Falany (University of Alabama at Birmingham, Birmingham, AL), and Sult1e1 monoclonal antibody was purchased from Abcam (Cambridge, MA). The Mrp2 antibody (M2III-6) was obtained from Enzo Life Sciences (Plymouth Meeting, PA); the Mrp3 and Mrp4 antibodies were generously provided by Dr. Yuichi Sugiyama (University of Tokyo, Tokyo, Japan) and Dr. John D. Schuetz (St. Jude Children's Research Hospital, Memphis, TN), respectively. All other reagents were of HPLC grade, and deionized distilled water was used in all experiments.
Male Wistar rats were purchased from Charles River (St. Constant, QC, Canada). TR− rats were generously provided by Dr. Kim L. R. Brouwer (University of North Carolina, Chapel Hill, NC) and bred in the Division of Comparative Medicine, University of Toronto. All the rats were maintained under a 12:12-h dark/light cycle in the housing facility (two rats per cage) and given access to animal chow and water ad libitum. The procedures used for the animal studies were conducted in accordance with the protocols approved by the animal committee at the University of Toronto.
Analytical Solutions of AUCs and Cumulative Biliary Excretion (from Time = 0 to Infinity, Ae,∞).
A physiologically based pharmacokinetic (PBPK) model (Fig. 1) was used to describe the transport and metabolism of a precursor and metabolite pair that undergoes futile cycling. The model consists of the reservoir, sinusoidal blood, hepatocyte, and bile compartments, denoted by subscripts R, LB (or B), L, and bile, respectively. D and Mi represent the precursor and the interconversion metabolite, respectively. The precursor (DR) and metabolite (MiR) in the reservoir are delivered at a flow rate of QL (12 ml/min) to the liver. The concentrations of drug (DLB) and metabolite (MLB) in sinusoidal blood are identical to those in the hepatic venous blood. The unbound fractions that describe the binding of the precursor and metabolite in sinusoidal blood are denoted by fLB and fLB{mi}, respectively, and are identical to those in perfusate blood, fB and fB{mi}, respectively. The unbound fractions in the liver for the precursor and metabolite are denoted by fL and fL{mi}, respectively. The unbound precursor and metabolite in sinusoid that rapidly equilibrate with the species bound to albumin (DLB-BSA, MiLB-BSA) and red blood cells (DLB-rbc, MiLB-rbc) are taken up into the hepatocyte with the influx clearances, CLin and CLin{mi}, respectively.

Schematic diagram of the physiological based liver model for the transport and metabolism of E217G and E23S17G. The model is composed of reservoir, sinusoid, hepatocyte, and canaliculus compartment. E217G and E23S17G in the reservoir perfusate are delivered at a flow rate of QL to the sinusoid. The unbound molecule that rapidly equilibrate with the bound ones to albumin and red blood cells in the sinusoid are taken up into the hepatocyte with CLin and CLin{mi} for E217G and E23S17G, respectively. In the hepatocyte, E217G is sulfated with CLint,metD→Mi and the resultant metabolite, E23S17G, is desulfated back to E217G with CLint,metMi→D{mi}. Both E217G and E23S17G in the hepatocyte may be returned back to the sinusoid with CLef and CLef{mi}, respectively, or excreted into the bile canaliculus with CLint,sec and CLint,sec{mi}, respectively. Other metabolic pathways, CLint,metother for the parent and CLint,meother{mi} for the formed metabolite, although of minor significance, have been included to reflect a general scheme. The bile flow rate is Qbile.
Within the hepatocyte, the precursor drug is metabolized to its interconversion metabolite with the metabolic intrinsic clearance, CLint,metD→Mi, and to other metabolites with the metabolic intrinsic clearance, CLint,metother. Likewise, the metabolite re-forms the precursor drug with the metabolic intrinsic clearance of the metabolite, CLint,metMi→D{mi}, or forms other secondary metabolites with the intrinsic clearance, CLint,metother{mi}. Both the precursor and metabolite in the hepatocyte may be effluxed back to the sinusoid with CLef and CLef{mi}, respectively, or excreted into bile with CLint,sec and CLint,sec{mi}, respectively. The bile flow rate is Qbile.
The AUCs (AUCR and AUCL) and cumulative biliary excretion of drug and metabolite were solved analytically by the inversion of matrices derived for the model (Fig. 1) and the associated mass balance equations, shown in the Appendix, with the computer software, Maple (Maple Inc., Waterloo, ON). In the absence of futile cycling, other parameters were kept the same except that CLint,metMi→D{mi} was set to 0.
Preparation of Subcellular Fractions.
Rat livers at the end of perfusion were used for the preparation of crude membranes and cytosolic fractions for immunoblotting. As described previously (Sun et al., 2006), the liver tissue was homogenized in buffer (250 mM sucrose, 10 mM HEPES, and 10 mM Tris-base, pH 7.4), and centrifuged at 3000g for 10 min; the resultant supernatant was centrifuged at 33,000g for 1 h. The pellet (crude membrane) was reconstituted in resuspension buffer (50 mM mannitol and 20 mM HEPES in 20 mM Tris base, pH 7.5). For preparation of the cytosolic fraction, the liver tissue was homogenized in SET buffer (250 mM sucrose, 1 mM EDTA, and 10 mM Tris-HCl, pH 7.4). The homogenate was centrifuged at 3000g for 20 min and the resultant supernatant was further centrifuged at 100,000g for 1 h to yield the microsomal and cytosolic fractions that were used for Western blotting. All buffers were freshly prepared and supplemented with protease inhibitor cocktail (Sigma-Aldrich, Oakville, ON, Canada). The microsomal fraction, prepared as follows, was used for the assay of sulfatase activities. A piece of liver tissue was homogenized with Tris-HCl (25 mM, pH 7.4). The homogenate was centrifuged at 9000g for 20 min. The resultant supernatant (S9) was centrifuged at 100,000g for 1 h; the pellet was resuspended in Tris-HCl (25 mM, pH 7.4) to yield the microsomal fraction. All of the procedures were performed at 4°C, and subcellular fractions were stored at −80°C until analyses. Protein concentration was determined by the method of Lowry et al. (1951).
Immunoblot Analysis.
Protein expression of the Oatps, Mrps, and Sults in the perfused rat livers was determined semiquantitatively by immunoblotting. In brief, 20 μg of crude membrane (for Oatps and Mrps) or cytosolic (for Sults) proteins were resolved by SDS-polyacrylamide gel electrophoresis in 7.5% (for Mrps), 10% (for Oatps), and 12% (for Sults) gels and electrophoretically transferred onto nitrocellulose membranes. The blots were blocked with Tris-buffered saline/Tween 20 (1%) buffer containing 5% nonfat milk for 15 min and then were incubated with primary antibodies (rabbit-anti-Oatp1a1 at 1:2500, rabbit-anti-Oatp1a4 at 1:10,000, rabbit-anti-Oatp1b2 at 1:5000, mouse-anti-Mrp2 at 1:750, rabbit-anti-Mrp3 at 1:5000, rabbit-anti-Mrp4 at 1:2000, rabbit-anti-Sult1a1, and mouse-anti-Sult1e1 at 1:10,000) overnight at 4°C. Finally, goat-anti-rabbit (for Oatps, Mrp3, Mrp4, and Sult1a1) or goat-anti-mouse (for Sult1e1 and Mrp2) IgG (H + L)-horseradish peroxidase conjugate (Bio-Rad Laboratories, Hercules, CA) was incubated with the blots at room temperature for 1 h. Upon reaction with ECL reagent, the blots were scanned by the FluorChem Imaging System (Alpha Innotech, San Leandro, CA) and the scan time was controlled to ensure linearity of the chemiluminescent signal. The autoradiograms obtained were quantified densitometrically with Scion Image (Scion Corporation, Frederick, MD). Because the molecular weights of Oatps and Mrps (>75 kDa) are distinctly different from that of GAPDH (∼37 kDa), the loading control, the blot was cut into two portions after transfer: the upper portion was used for the detection of the target protein, and the lower portion was used for the detection of GAPDH. Because the Sults have molecular weights similar to that of GAPDH, the blot was stripped with Restore Western Blot Stripping Buffer (Pierce Biotechnology Inc., Rockford, IL) and re-probed with the antibody for GAPDH (Abcam Inc., Cambridge, MA), after the target protein was quantified. Protein expression of the target protein was presented as the ratio of densitometric measurements of the target protein to that of GAPDH.
In Vitro Sulfatase Activity in Subcellular Fractions.
As described previously (Sun et al., 2006), a relatively higher microsomal protein concentration (4 mg/ml) was used for the incubation study because of the low sulfatase activity toward E23G17G. [3H]E23S17G (∼50,000 dpm) and Tris-HCl (25 mM, pH 7.4) were separately preincubated at 37°C for 5 min and then were mixed (1:1, v/v) and incubated in a rotating incubator at 37°C for 10 min. Samples were retrieved at various times between 0 and 10 min to determine the linearity in [3H]E217G formation versus time. The reaction was terminated by the addition of 150 μl of ice-cold acetonitrile that contained 4-MUS (50 μg/ml) as an internal standard. After centrifugation at 6000g for 10 min, the resultant supernatant was dried under a gentle stream of nitrogen. The residue was reconstituted in the buffer (NH4Ac-acetonitrile, 85:15, v/v), and the resultant sample was subjected to HPLC (see below). The radioactivities in outflow eluants that corresponded to peaks of the radiochromatogram were collected. A calibration curve was constructed by mixing boiled microsomal fractions with the various known concentrations of [3H]E217G for quantification of the [3H]E217G formed in microsomes. The in vitro desulfation intrinsic clearance (CLint,metMi→D{mi}in vitro in microliters per second per milligram of microsomal protein), estimated as the formation rate of [3H]E217G divided by the concentration of [3H]E23S17G, was only an apparent value because the estimate did not consider the binding of E23S17G to microsomal proteins.
Recirculating Rat Liver Perfusion.
The surgical procedure and the perfusion apparatus were described previously (Sun et al., 2006). In brief, the male Wistar or TR− rat serving as liver donors was anesthetized by an intraperitoneal injection of a mixture of ketamine (90 mg/kg) and xylazine (10 mg/kg). Cannulae were placed in the portal vein, hepatic vein, and bile duct, and the temperature of the liver preparation was maintained close to be 37°C under a heating lamp. Blank perfusate was oxygenated (95% O2-5% CO2) Krebs-Henseleit bicarbonate solution (pH 7.4) that was supplemented with washed bovine erythrocytes (∼20%) (a kind gift of Ryding-Regency Meat Packers Ltd., Toronto, ON, Canada), 1% bovine serum albumin, 3% Dextran T40, and 0.3% glucose. Reservoir perfusate containing [3H]E217G (∼100,000 dpm/ml) was prepared by mixing trace amounts of [3H]E217G (∼45 nM) with perfusate in the reservoir. Perfusate was delivered at 12 ml/min to TR− (13.7 ± 0.9 g, n = 4) or Wistar (13.7 ± 2.3 g, n = 4) rat livers via the portal vein cannula and allowed to exit via the hepatic vein cannula to return to the reservoir. The rat liver preparation was initially perfused by blank perfusate for 20 min for equilibration at 37°C. Thereafter, the blood supply was switched to the alternate reservoir containing the [3H]E217G in the perfusate. Perfusate in reservoir was sampled at 0, 2.5, 7.5, 12.5, 17.5, 22.5, 27.5, 35, 45, 55, 70, 90, and 110 min, and bile was collected at 5-min intervals up to 30 min and subsequently at 10- or 20-min intervals until 120 min. At the end of the experiment (120 min), the liver was flushed with 50 ml of ice-cold Krebs-Henseleit bicarbonate solution, carefully excised, blotted with gauze, and weighed. Then the liver tissue was minced, snap-frozen with liquid nitrogen, and stored at −80°C. The perfusate and bile samples were kept at −20°C until analyses.
HPLC Methods.
A Shimadzu HPLC system consisting of a C18 reverse-phase column (4.6 × 250 mm, particle size, 10 μm; Alltech Associates, Deerfield, IL), a guard column (Bondapak C18/Corasil 37–55 μm; Waters), and a Shimadzu 10A apparatus was used for the separation of E217G and E23S17G at 280 nm. A binary HPLC gradient program (A, 10 mM ammonium acetate, pH 5.0, adjusted with 10% acetic acid; B, acetonitrile) was used (Sun et al., 2006). HPLC elution was initiated at 15% B at the flow rate of 1 ml/min, maintained for 13 min, followed by a linear increase of percent B to 22% and to the flow rate to 1.2 ml/min within the next minute and was maintained there until 24 min. The percent B was linearly increased to 50% over the next minute and maintained for another 10 min. Then the flow rate and percent B were returned to the initial conditions over 1 min and maintained for another 5 min.
Perfusate samples.
Blood perfusate samples (100–500 μl) were made up to 500 μl with blank perfusate and deproteinized with 2 ml of methanol, as described previously (Sun et al., 2006). After a 5-min centrifugation at 1500g, 2 ml of the supernatant was mixed with 8 ml of Ready Safe scintillation cocktail (Beckman Coulter Canada, Mississauga, ON, Canada) and counted. A calibration curve was prepared in identical fashion to quantify the total radioactivity in perfusate sample. Then the disintegrations per minute of [3H]E217G and [3H]E23S17G in the sample were determined. To each perfusate sample 2 ml of acetonitrile (1:4, v/v)was added, mixed for 10 s, and centrifuged at 1500g for 5 min to precipitate the protein. The resultant supernatant was extracted with toluene (1:1, v/v) to remove the acetonitrile, and the remaining water layer was injected directly into the HPLC system. Radioactive eluants corresponding to [3H]E217G (retention time ∼21 min) and [3H]E23S17G (retention time ∼12–13 min) were collected and counted. The [3H]E217G and [3H]E23S17G concentrations in each perfusate sample were obtained by multiplying the total radioactivity of each sample to the fraction of [3H]E217G and [3H]E23S17G, respectively, after HPLC separation. It was noted that the radioactivity in perfusate collected beyond 45 min for the Wistar liver preparation was too low to be quantified accurately.
Liver samples.
A piece of liver tissue was homogenized with ice-cold saline (1:4, v/v) over ice. An aliquot of 250 μl of homogenate was mixed with 1 ml of Soluene-350 and incubated at 60°C, with intermittent swirling. Then 0.2 ml of 30% hydrogen peroxide was added and incubated for 5 min at room temperature, followed by the addition of another 0.2 ml of 30% hydrogen peroxide for another 10 min of incubation at room temperature. The resultant solution was then incubated at 60°C for 30 min. After the addition of 10 ml of Hionic-Fluor cocktail, the final solution was counted to obtain the total radioactivity in the liver tissue sample. For determination of the fraction of [3H]E217G and [3H]E23S17G in liver tissue, 100 μl of TR− liver homogenate or 500 μl of Wistar liver homogenate was spiked with 50 μl of 4-MUS (50 μg/ml, internal standard) and 1.5 ml of acetonitrile and then mixed for 10 s and centrifuged at 3000g for 5 min. The supernatant (1.8 ml) was extracted against an equal volume of toluene; the resultant, bottom (water) layer was used for injection into the HPLC system. Calibration curves were prepared by admixing various concentrations of [3H]E217G or [3H]E23S17G with boiled liver homogenate fractions obtained from TR− and Wistar livers. Standards of the calibration curve for the liver samples were processed in parallel under identical conditions. [3H]E217G and [3H]E23S17G in liver samples were quantified by the ratio of the corresponding radioactivities to the chromatographic area of 4-MUS, with use of each individual calibration curve. The concentrations of [3H]E217G and [3H]E23S17G in the liver tissue were calculated by multiplying the total radioactivity by the fraction of [3H]E217G and [3H]E23S17G, respectively.
Bile samples.
Each bile sample was diluted with 300 μl of H2O. An aliquot of the diluted bile sample was counted directly for the total radioactivity, and another aliquot was injected into the HPLC system. The [3H]E217G and [3H]E23S17G radioactivities in the eluant fractions were counted to determine the fractions of [3H]E217G and [3H]E23S17G in each sample, and these were multiplied by the total disintegrations per minute to provide the disintegrations per minute of [3H]E217G and [3H]E23S17G in the sample.
PBPK Modeling and Simulation.
Because E217G and E23S17G accounted for more than 98% of the radioactivity in the system, the other metabolic pathways for E217G and E23S17G, CLint,metother and CLint,metother{mi}, respectively, were set to be zero in the PBPK model (Fig. 1). The mass balance equations for this model are shown in the Appendix.
The PBPK model was also used for fitting and simulations. Inasmuch as the model for futile cycling was extremely complicated, the likelihood of success for data fitting was low. As alternate measures, simulations were used. Various assumptions, highlighted under Results, were taken for parameter estimates. The influx clearances for E217G and E23S17G were taken to be the same as those of Sun et al. (2006). In addition, the attainment of steady-state conditions for E217G and E23S17G in the TR− rat allowed estimation of CLin, CLef, CLin{mi}, CLef{mi}, and the sulfation and desulfation intrinsic clearances, as described later under Results. It was further assumed that the unbound fractions fL, fB{mi}, and fL{mi} equaled the observed fB (Sun et al., 2006).
Parameter estimates of the interconversion and secretory intrinsic clearances for the Wistar rat were obtained from fitting upon fixing the values of CLin, CLef, CLin{mi}, and CLef{mi}. The relative intensities of the immunoblots obtained from Wistar and TR− livers were then compared to provide estimates of relative transporter activities for all sinusoidal influx (Oatps), basolateral efflux (Mrp3), and relative sulfation (Sult1e1) activities, keeping in mind that the ex vivo desulfation activity could be obtained by scale-up of the in vitro microsomal activity. These optimized values were used for simulation of the concentrations/amounts of E217G and E23S17G in perfusate, liver, and bile according to the differential equations shown in the Appendix. The estimates were also used to simulate the AUCs and clearances with various extents of reduction of Mrp2 activity.
Statistical Analyses.
The data are presented as mean values ± S.D. A two-tailed Student's t test was used to compare the means, and P < 0.05 was viewed as significant.
Results
Solved Analytical Solution for AUC and Ae,∞.
As shown in Table 1, the solutions for AUCR and AUCR{mi,P} were similar to those in the absence of futile cycling (de Lannoy et al., 1993; Sirianni and Pang, 1997), with the exception that the efm″ and efm′ terms are now present. Both terms, efm″ and efm′, were introduced to describe modulation of the backward and forward processes in futile cycling, respectively, on the net metabolism of the precursor and metabolite. In these solutions, efm″ or effective coefficient for metabolite formation, was associated with CLint,metD→Mi or the metabolite formation intrinsic clearance. The term efm″ or
 consisted of intrinsic clearance terms associated with the metabolite: the intrinsic clearance denoting re-formation of the precursor CLint,metMi→D{mi} as well as other terms for secretion (CLint,sec{mi}) and sequential metabolism (CLint,metother{mi}) of the metabolite. Conversely, efm′ or the effective recycling coefficient,
 was associated with the metabolic intrinsic clearance of metabolite to re-form the precursor, CLint,metMi→D{mi} that appeared as in the denominator of the solution of AUCR{mi,P} and AUCL{mi,P} in the presence of futile cycling (Table 1).
Analytical solutions for the area of the curve from time 0 to infinity for the parent drug (AUCR and AUCL) and formed metabolite (AUCR{mi, P} and AUCL{mi, P}) in reservoir and liver tissue and amount of cumulative biliary excretion of the parent drug (Ae, ∞) and metabolite (Ae, ∞ {mi, P}) at time infinity for a drug-metabolite pair in the absence (CLint, metMi→D){mi} = 0) and presence (CLint, metMi→D){mi} > 0) of futile cycling
See text for definition of terms.
The area under the curve for the precursor in reservoir, AUCR, was found to depend on all the intrinsic clearances of the precursor, including basolateral influx (CLin) and efflux (CLef) and metabolic (CLint,metD→Mi and CLint,metother) and secretory (CLint,sec) intrinsic clearances. The net metabolite formation intrinsic clearance of the precursor (efm″ CLint,metD→Mi) was reduced by the factor of (1 − efm″) or
 The area under the curve for the formed metabolite in the reservoir, AUC{mi,P}R, was found to depend on parameters relating to metabolite handling (CLin{mi}, CLef{mi}, CLint,sec{mi}, and CLint,metMi→D{mi}) and metabolite formation (CLint,metD→Mi), and the secretory intrinsic clearance (CLint,sec), metabolic intrinsic clearance for alternate metabolism (CLint,metother), and the total intrinsic clearance of the precursor (CLint,sec + CLint,metD→Mi + CLint,metother). Analogously, AUCL and AUCL{mi,P} and the cumulative excretion of the precursor (Ae,∞) and metabolite (Ae,∞{mi,P}) were modified by efm″ or efm′ accordingly, when futile cycling existed. The apparent total (CLliver,tot) and excretory (CLliver,ex) clearances of the liver were estimated as dose/AUCR and Ae,∞/AUCR, respectively. The apparent metabolic clearance (CLliver,met) was obtained from the difference between CLliver,tot and CLliver,ex (Table 2). In absence of a membrane barrier, the basolateral uptake and efflux clearances (CLin = CLef) were set to greatly exceed CLint,sec, efm″ CLint,metD→Mi and CLint,metother. As noted, efm″, together with CLint,metD→Mi, appeared in the solutions of all the apparent clearances (Table 2).
Analytical solutions for the metabolic (CLliver,met), excretory (CLliver,ex), and total (CLliver,tot) liver clearances in the presence of futile cycling
Relative Protein Expression from Immunoblotting.
As shown in Fig. 2, Mrp3 protein expression was significantly increased in the TR− liver compared with that in the Wistar liver (4.26 ± 1.08 versus 1.00 ± 0.65), and Mrp2 protein expression was absent in the TR− rat. However, protein expression of other transporters (Oatp1a1, Oatp1a4, Oatp1b2, and Mrp4) and enzymes (Sult1e1 and Sult1a1) was not significantly different between TR− and Wistar livers (Fig. 2).

Integrated densitometric analysis of crude membrane (for Oatp1a1, Oatp1a4, Oatp1b2, Mrp2, Mrp3, and Mrp4) and cytosolic (Sult1a1 and Sult1e1) fractions prepared from Wistar (■) and TR− (□) rat liver. Protein expression of the target protein was presented as the ratio of densitometric measurements of the target protein to that of GAPDH. For each target protein, the expression was normalized to the average value in Wistar rat livers.
Desulfation Activity of Microsomal Fractions.
The apparent desulfation activity toward E23S17G in microsomal fractions prepared from TR− rat livers (CLint,metMi→D{mi}in vitro), estimated as rate of E217G formation/E23S17G concentration, was slightly but significantly lower than those from Wistar rat livers (0.07 ± 0.02 versus 0.11 ± 0.02 μl/s/mg microsomal protein; n = 3). These represented apparent values because the binding of E23S17G to microsomal proteins of Wistar and TR− livers was not considered.
Recirculating Liver Perfusion.
In perfusate, E217G rapidly decayed monoexponentially for up to 45 min in the Wistar liver (Fig. 3A). Beyond that time, the radioactivity in the perfusate was too low to be measured accurately. The metabolite, E23S17G, was present at very low levels (<3% dose) in the reservoir perfusate for Wistar livers, and no apparent trend was observed with time. Almost all of the dose (92 ± 6%) was recovered in bile for the Wistar group at 2 h, with 75 ± 5% dose as the E23S17G metabolite and 17 ± 4% dose as the parent drug (Fig. 3B). Very low counts were found for the liver tissue of the Wistar rat at 2 h (E217G of 1.4 ± 0.7% dose and E23S17G of 2.5 ± 2.1% dose) (Table 3).
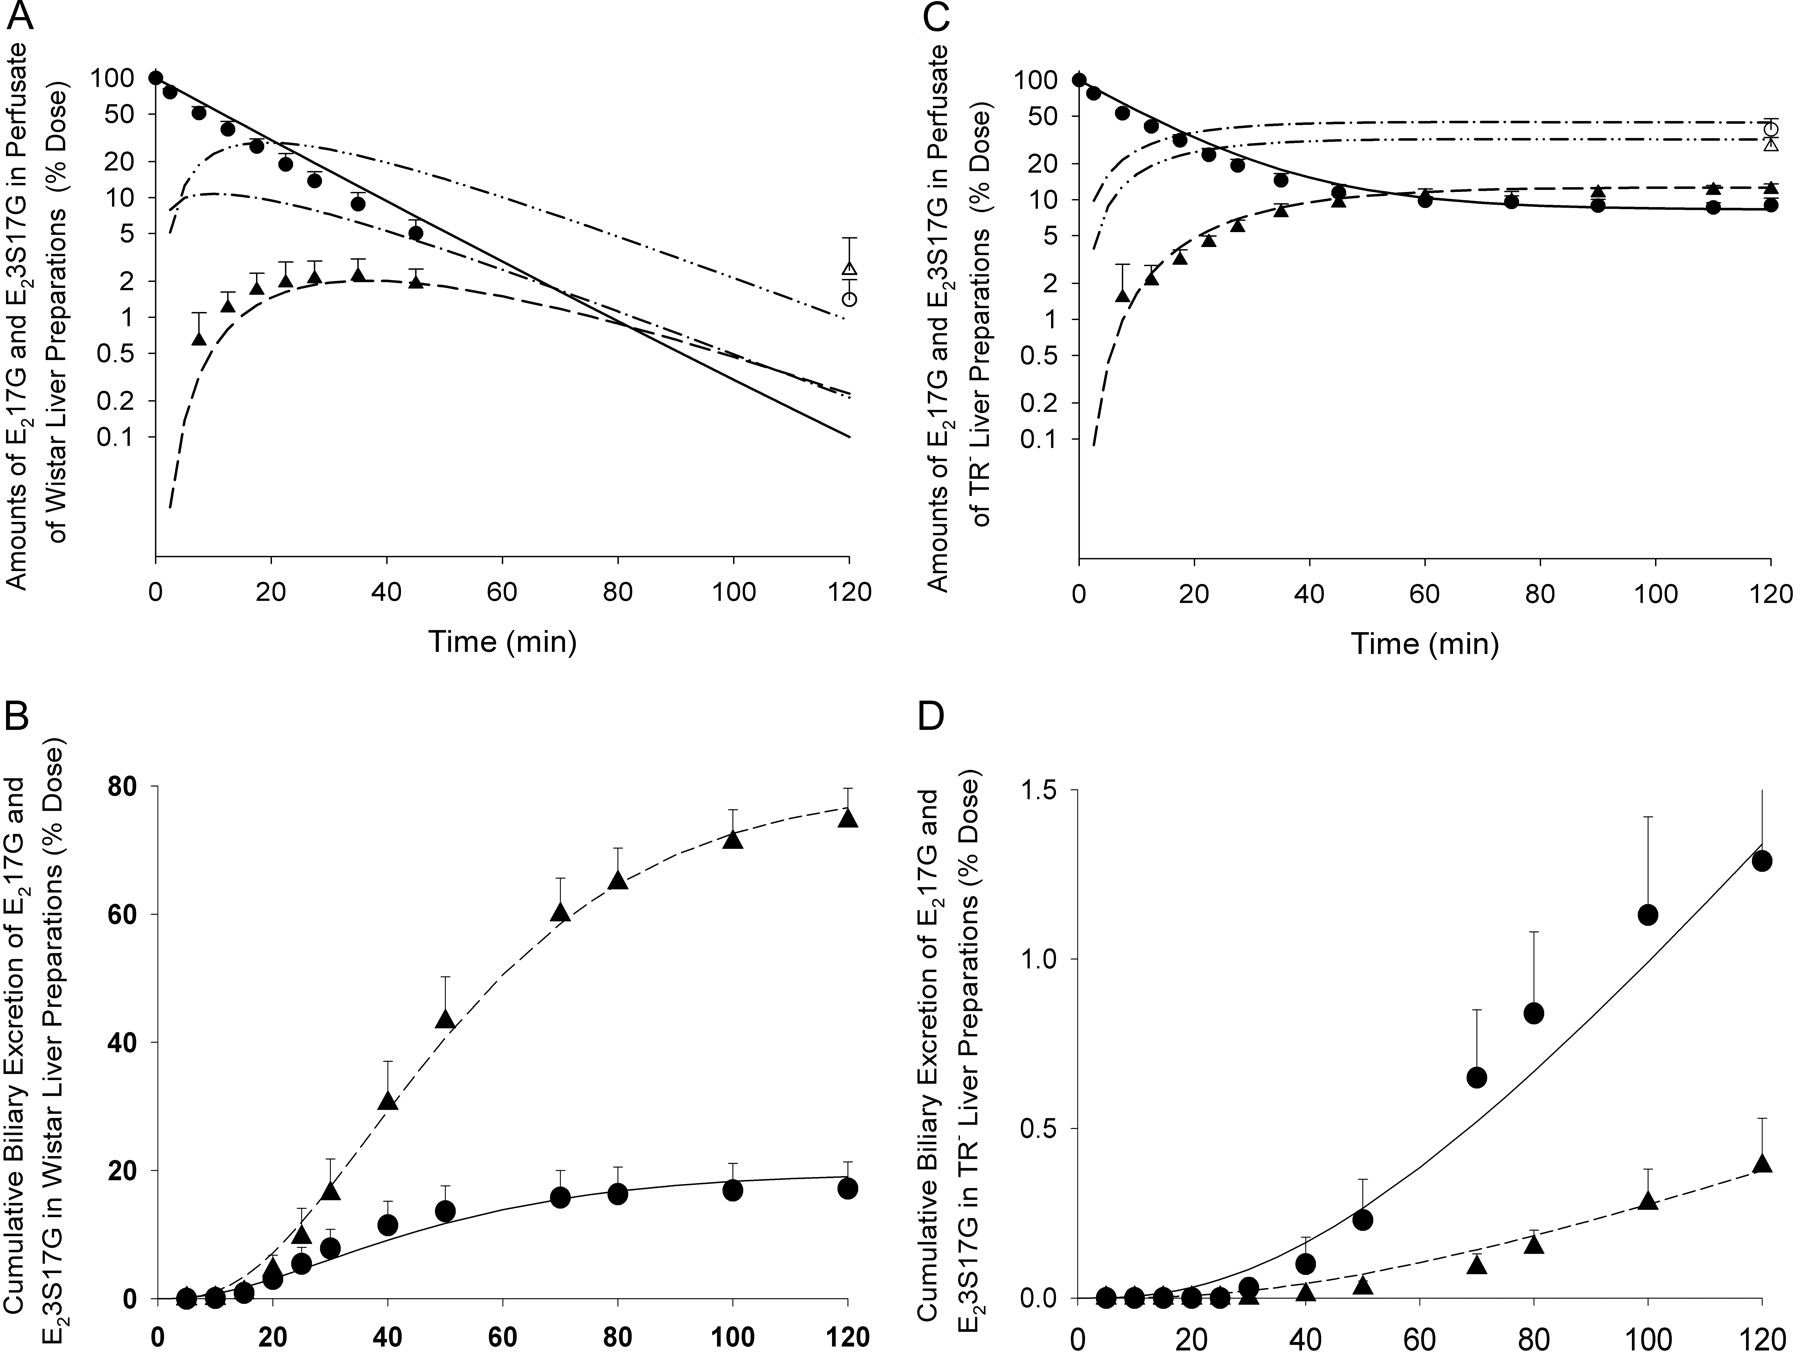
Time-dependent profile of E217G and E23S17G in the perfusate and liver (A and C) and bile (B and D) of recirculating perfused Wistar (A and B) and TR− (C and D) rat liver preparations (n = 4 for both groups) based on parameters shown in Table 4 and differential equations in the Appendix. For experimental data, E217G is denoted by ● in perfusate and bile and ○ in liver; E23S17G is denoted by ▴ in perfusate and bile and ▵ in liver. For prediction, E217G is denoted by —— in perfusate and bile and – · – in liver; E23S17G is denoted by – – – in perfusate and bile and – ·· – in liver.
Experimentally derived parameters for the in situ recirculating perfused Wistar and TR− rat liver preparations, with dosing of [3H]E217G (approximately initial concentration of 100,000 dpm/ml) into the reservoir
Data are presented as means ± S.D., unless specified; the initial amount of E217G in the reservoir perfusate was set to 100 and is unitless.
In contrast, perfusate E217G of the TR− liver preparation decayed rapidly in the early time points, and then the decay became protracted and finally reached a plateau after 1 h. The amount of E23S17G in the perfusate appeared at much higher levels than that for the Wistar preparation and also reached a plateau after 1 h (Fig. 3C). The bile flow rate in the TR− group was much lower than that in the Wistar group (2.4 ± 0.5 versus 6.3 ± 0.7 μl/min), as expected for rats lacking Mrp2 (Jansen et al., 1985). As shown in Fig. 3D, almost no radioactivity (1.8 ± 0.4% dose at 2 h) was observed in the bile of the TR− group. Both E217G and E23S17G were minimally excreted into bile, although E217G was present in slightly higher proportions (1.3 ± 0.3% dose) than E23S17G (0.4 ± 0.1% dose). Much radioactivity was trapped in the TR− rat liver, with 39 ± 9% dose at 2 h as E217G and 28 ± 5% dose at 2 h as E23S17G. At 2 h, the fractional dose of E23S17G for the TR− group was significantly lower than that in the Wistar group (40 ± 6 versus 77 ± 6%) (Table 3).
PBPK Modeling and Simulations.
The volume of the reservoir (VR) was taken as the average value between the initial volume (200 ml) and the volume obtained at the end of the experiment, yielding values of 182 and 180 ml for the Wistar and TR− livers, respectively (Table 4). As shown in Appendix, the fB value of E217G was calculated from hematocrit of the perfusate, unbound fractions in plasma (fp), and the drug partitioning coefficient between red cells and plasma; the latter two were obtained in previous binding experiments (Sun et al., 2006). Recognizing that it was difficult to accurately determine the unbound fractions in liver tissue (fL and fL{mi}) because of the presence of metabolism during incubation studies, we further assumed that unbound fractions were all equal (fB = fL = fB{mi} = fL{mi}) for the sake of simplicity. The unbound fractions in liver would not materially alter the AUCs or clearances (Tables 1 and 2), and the value of the unbound fraction would not greatly affect the clearance of highly cleared drugs.
Assigned and estimated parameters used for simulation of E217G and E23S17G profiles/parameters in the recirculating perfused Wistar and TR− rat liver preparations according to the liver PBPK model
Because E217G and E23S17G levels reached a plateau 1 h after onset of perfusion among the TR− livers (Fig. 3C), rates of change for the precursor and metabolite became zero at steady state, and the left sides of all the equations in the Appendix were zero. This condition allowed simplification and estimation of various parameters. At steady state, it was deduced in eq. A3 of the Appendix that the ratio of the observed drug concentrations in perfusate and in liver (DR/DLB or 0.011; eq. 1) equaled the ratio of the net efflux to influx clearances because the drug concentration in reservoir equaled drug concentration in liver blood (see eq. A1):
 Analogously, eq. A2 of the Appendix revealed that the concentration of E23S17G in reservoir, MiR, equaled the concentration of E23S17G in sinusoidal blood, MiLB. It was further deduced from eq. A4 that the ratio of the observed metabolite concentrations in perfusate and in liver (MiR/MiL = 0.02; eq. 2) at steady state equaled the ratio of the net basolateral efflux to influx clearances of the metabolite (eq. 2):
 From eq. A5 or A6, it was further shown that, at steady state, the ratio of the observed metabolite to drug concentration in liver (MiL/DL) equaled the ratio of the effective sulfation intrinsic clearance (fLCLint,metD→Mi) to the effective desulfation intrinsic clearance (fL{mi}CLint,metMi→D{mi}):

Parameter estimates for CLin, CLef, CLin{mi}, and CLef{mi}.
Because no significant difference was observed for protein expression of Oatps between the TR− and Wistar groups based on results from immunoblotting (Fig. 2), the published value of CLin for E217G (546 ml/min) of Sun et al. (2006) was assumed to hold here for both the Wistar and TR− livers. When influx is fast in relation to the flow rate, any anticipated error due to strain differences is anticipated to be inconsequential and would not affect E217G disposition significantly (Sun et al., 2006). The value of CLin{mi} is expected to be high because 80% of the total radioactivity of E23S17G was rapidly secreted in bile within 15 min after intravenous dosing of [3H]E23S17G (Slikker et al., 1983). Simulations conducted with low values of CLin{mi} resulted in poor prediction of the data (results not shown). Thus, a value similar to that of E217G (546 ml/min) was assumed for CLin{mi} (Table 4). From eqs. 1 and 2, values of 5.75 and 10.9 ml/min, respectively, were calculated for CLef and CLef{mi} in the TR− liver. Because the Mrp3 protein expression of the TR− liver was 4.26-fold that of the Wistar liver, values for CLef and CLef{mi} for the Wistar liver were estimated to be 1.35 and 2.56 ml/min, respectively (Table 4).
Parameter estimates for CLint,sec, CLint,sec{mi}, CLint,metD→Mi, and CLint,metMi→D.
With assignment of CLin, CLin{mi}, CLef, and CLef{mi}, fitting of the model to the Wistar data yielded 1.90 and 2.54 ml/min, respectively, for CLint,sec and CLint,sec{mi} and 22.4 and 4.81 ml/min, respectively, for CLint,metD→Mi and CLint,metMi→D{mi}. Because the Sult1e1 expression in TR− rat livers was similar to that in Wistar rat livers, a value of 22.4 ml/min was assigned to CLint,metD→Mi, and the corresponding CLint,metMi→D{mi} according to eq. 3 was calculated to be 31.1 ml/min, for TR− group. By contrast, values of 19 and 12.1 ml/min were estimated for CLint,metMi→D{mi} of the Wistar and TR− rat livers upon scale-up of the apparent in vitro, microsomal desulfation intrinsic clearance (CLint,metMi→D{mi}in vitro = 0.11 and 0.07 μl/s/mg of microsomal protein), after multiplication by the scale-up factor (45 mg of microsomal protein/g of liver tissue) (Houston and Carlile, 1997), yielding an in vitro Wistar/TR− desulfation activity ratio of 1.57 (0.11/0.07 or 19/12.1) that differed from the ratio estimated from fitting and the steady-state strategy in perfusion studies (0.155 or 4.81/31.1 using eq. 3) (Table 4). The discrepancy was most likely due to the assumption that fB = fB{mi} = fL = fL{mi} in eqs. 1, 2, and 3 and that values reported in Table 4 for the transporter and metabolic intrinsic clearances were only the “effective” or “apparent” intrinsic clearances that could be modified by the unbound fractions. Values of CLint,sec and CLint,sec{mi} for the TR− rat were optimized by trial and error simulations and found to be 0.02 and 0.008 ml/min, respectively (Table 4). These values were very low and almost zero, as expected for the TR− rat.
The optimized parameters summarized in Table 4 were used to simulate E217G and E23S17G data in reservoir perfusate, liver, and bile based on the PBPK model for the Wistar and TR− livers with the program Scientist (Micromath, St. Louis, MO). As shown in Fig. 3, C and D (blood and bile), the experimental data for the TR− group was well predicted by the simulations based on the rationally chosen set of model parameters (Table 4). The parameter efm″, effective coefficient for metabolite formation that denotes the effect of futile cycling on the disposition of the precursor, decreased from 0.346 in the Wistar liver to almost zero in the TR− liver (Table 4), suggesting that alteration in secretory intrinsic clearance of the metabolite would greatly affect the disposition of the precursor in the presence of the futile cycling. The value of efm′, the effective recycling coefficient, was reduced from 0.078 in the Wistar liver to 0.0009 in the TR− rat liver (Table 4), suggesting that, again, reduction of the secretory intrinsic clearance of drug would affect the disposition of the metabolite in the presence of futile cycling. The low value of efm′ was due to the high value of CLint,metD→Mi (22.4 ml/min) in relation to CLint,metother (= 0) and CLint,sec in both Wistar (1.9 ml/min) and TR− (0.02 ml/min) rats. The reduction in efm″ and efm′ in the TR− livers to those in the Wistar livers in futile cycling was attributed to reduced secretion upon reduction of Mrp2 activity.
Simulations Based on Solve Solutions for AUCs and Clearances.
As shown in Fig. 4, AUCR (Fig. 4A) and AUCL (Fig. 4B) for E217G and E23S17G were both low due to rapid excretion into bile. The AUCR and AUCL values for both the precursor and formed metabolite increased gradually upon the loss of Mrp2 activity for E217G and E23S17G. When the majority of Mrp2 activity was blunted (>80%), values of the AUCR and AUCL for both E217G and E23S17G were elevated precipitously toward infinity (Fig. 4, A and B). Correspondingly, all the liver clearances were decreased upon the reduction of Mrp2 activity, and the values approached zero (Fig. 4C). These scenarios were expected to occur when a potent Mrp2 inhibitor was present or when Mrp2 was genetically knocked-out as for the mutant (TR−) rat. The simulation predicted observations in this communication: when Mrp2 activity was almost abolished in TR− rat livers, a steady state would be reached for E217G and E23S17G, the precursor-metabolite pair that undergoes futile cycling, with the AUCR and AUCR{mi,P} approaching infinity (Fig. 4A) and clearances nearing toward zero (Fig. 4C).
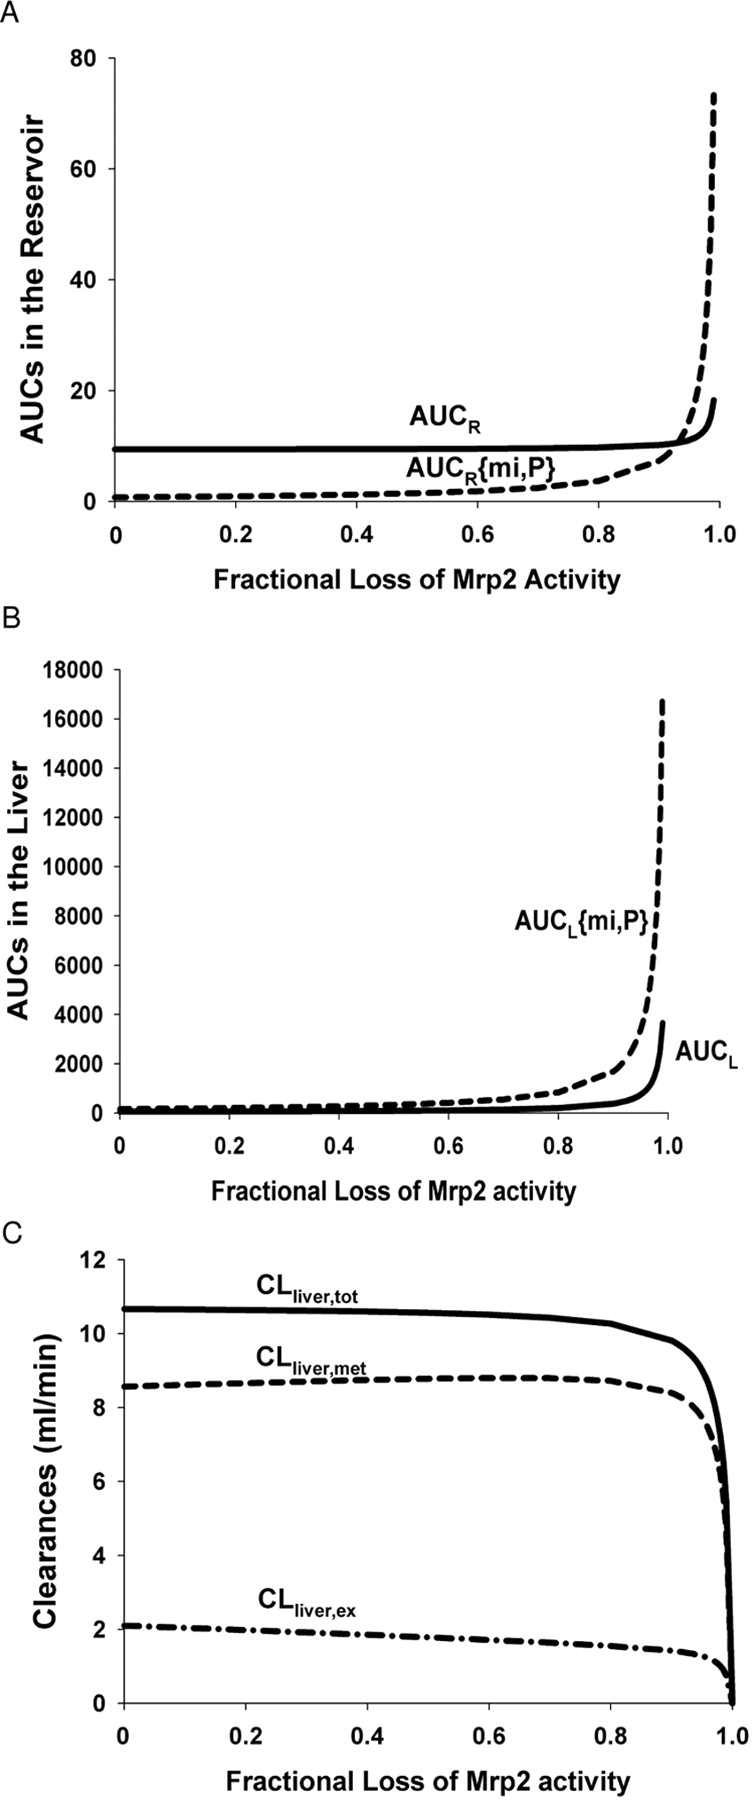
Simulated profiles for (A) AUCR for E217G (——) and AUCR{mi,P} for E23S17G (– – –) in reservoir, (B) AUCL for E217G (——) and AUCL{mi,P} for E23S17G (– – –) in liver, and (C) the resultant metabolic (– – –), excretory (– · –), and total (——) liver clearances of E217G on reduction/loss of Mrp2 activity.
Other Simulations for AUCs and Clearances.
Two hypothetical simulations were conducted to mimic more general scenarios in which the parent drug and the metabolite do not share the same canalicular transporter. Again, the parameter values for the Wistar rat liver were used for the simulation (Table 4). As shown in Fig. 5 (case 1), AUCR and AUCR{mi,P} (Fig. 5A) and AUCL and AUCL{mi,P} (Fig. 5B) for the precursor and metabolite were increased when the secretory transporter activity of the metabolite but not the parent drug was reduced. The extent of change was not as dramatic as when both the precursor and metabolite secretory transporter activities were blunted (Fig. 4, A and B). With the loss of biliary secretion of the metabolite, the net metabolic clearance was decreased because of increased futile cycling; this led to an apparent increase in the excretory clearance and decrease in the net metabolic clearance for the precursor. The total liver clearance was decreased.

Simulated profiles for (A) AUCR for E217G (——) and AUCR{mi,P} for E23S17G (– – –) in reservoir, (B) AUCL for E217G (——) and AUCL{mi,P} for E23S17G (– – –) in liver, and (C) the resultant metabolic (–––), excretory (– · –), and total (––––) liver clearances of E217G on reduction/loss of Mrp2 activity. This simulation described Mrp2 activity loss of E23S17G only, a hypothetical scenario.
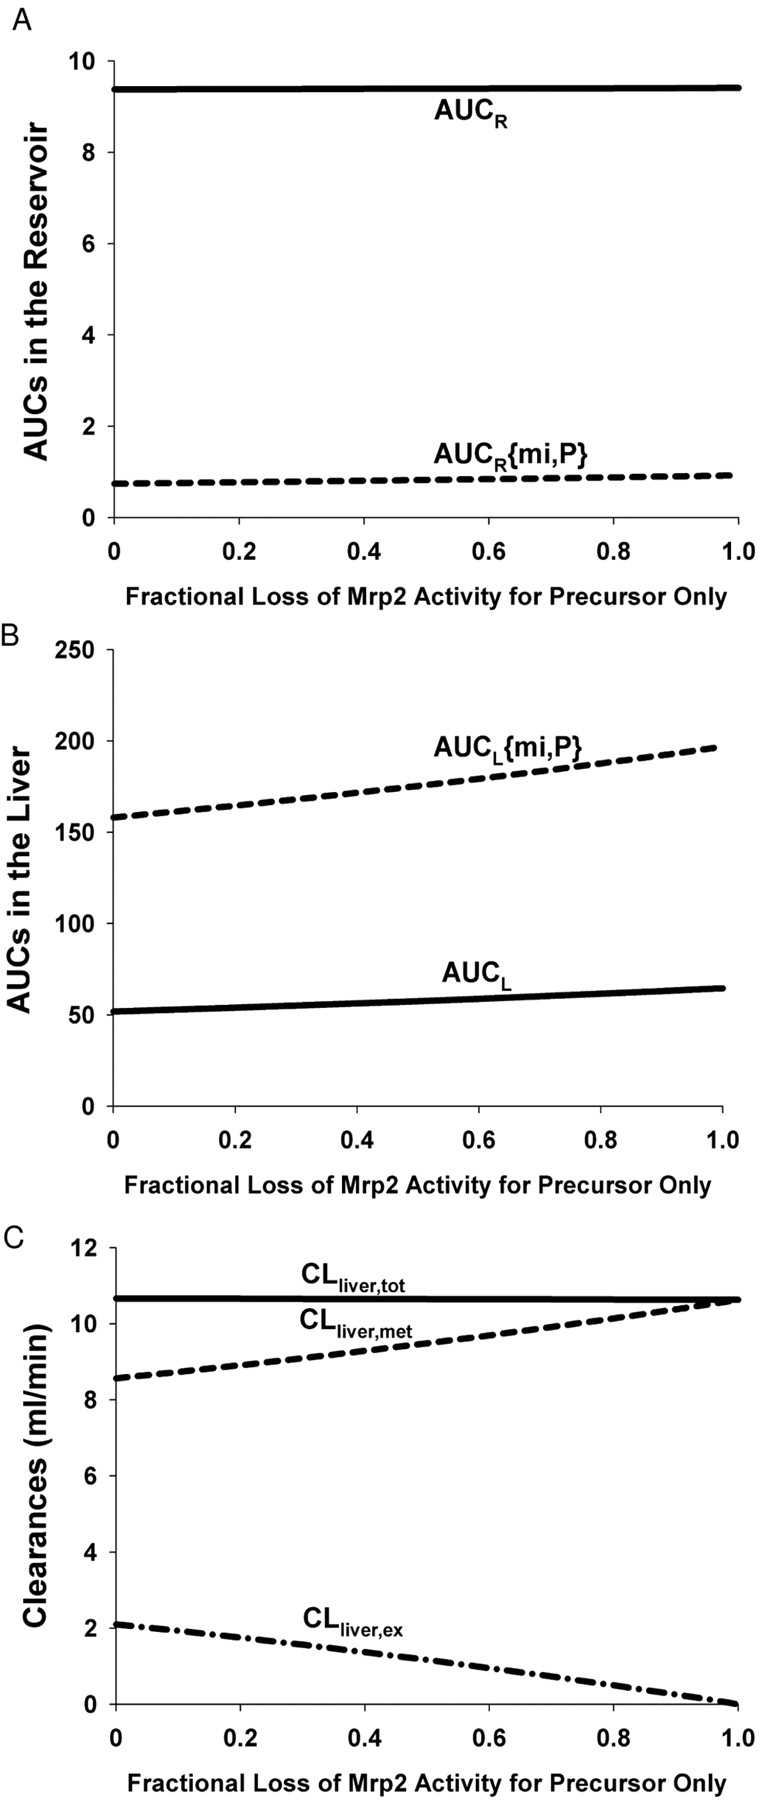
In the second simulation (case 2), in which there was loss of secretory transporter activity for the parent drug and not the metabolite, the AUCR was increased only very slightly, but the AUCL was evidently elevated, as shown in Fig. 6, A and B. The excretory clearance of the precursor was decreased, and the metabolic clearance was increased, as expected of competing pathways (Liu and Pang, 2005); the total liver clearance was decreased (Fig. 6C). These changes were not as dramatic as case 1, because the inhibited pathway (excretion of precursor) was not a major elimination pathway relative to that for sulfation, and the CLint,sec of the precursor was less than 1/10 that of CLint,metD→Mi.

Simulated profiles for (A) AUCR for E217G (——) and AUCR{mi,P} for E23S17G (– – –) in reservoir, (B) AUCL for E217G (——) and AUCL{mi,P} for E23S17G (– – –) in liver, and (C) the resultant metabolic (– – –), excretory (– · –), and total (——) liver clearances of E217G on reduction/loss of Mrp2 activity. This simulation described Mrp2 activity loss of E217G only, a hypothetical scenario.
Discussion
The futile cycling between a precursor-metabolite is a complex relationship. Previous examples of interconversion had revealed parallel decay half-lives of drug and metabolite, and AUC relationships that allowed interconversion metabolic intrinsic clearances to be estimated (Wagner et al., 1981; Ebling and Jusko, 1986; Ferry and Wagner, 1986; Aarons, 1987; Cheng and Jusko, 1990a,b,c, 1991, 1993a,b). These solutions mainly pertain to flow-limited substrates and lack consideration of transporters. Later modeling of 4-methylumbelliferone and its sulfate (Ratna et al., 1993; Chiba et al., 1998) and estrone and estrone sulfate, other compounds that undergo futile cycling, has evoked consideration of sinusoidal and canalicular transporters and revealed the influence of lack of substrate equilibration on futile cycling kinetics (Tan et al., 2001).
With intentions of defining the role of membrane transporters and enzymes, we had previously used the PBPK model that describes transporter- and enzyme-mediated processes, such as basolateral influx, efflux, canalicular secretion, and metabolism and allows one to appraise the significance of rate-limited pathways and transporter-enzyme interplay (de Lannoy et al., 1993; Liu and Pang, 2005; Shitara et al., 2006; Sun et al., 2006; Sun and Pang, 2010). However, most of the focus was on precursor-metabolite pairs that undergo irreversible metabolism, and AUCR{mi,P} of the formed metabolite was found to be modulated by eliminatory parameters of the precursor and not vice versa (de Lannoy et al., 1993; Pang et al., 2008) (Tables 1 and 2 when CLint,metMi→D{mi} = 0). Upon incorporation of interconversion between the precursor and metabolite and alternate metabolic pathways in present PBPK model, we provided analytical solutions and showed that, in the presence of futile cycling, the eliminatory parameters of the metabolite would affect the disposition of the precursor (Table 2). We unveiled two coefficients that can modulate the AUCR and AUCR{mi,P} in futile cycling. These are the effective metabolism coefficient, efm″, and the effective recycling coefficient, efm′,which serve as modulators of CLint,metD→Mi and CLint,metMi→D{mi}, respectively. When futile cycling is absent (CLint,metMi→D{mi} = 0), efm″ equals unity. With futile cycling, the efm″ value is less than unity, and a lower efm″ renders a more pronounced effect on precursor disposition. The value of efm′ or
 is not affected by the presence or absence of futile cycling. In the presence of futile cycling, efm′ modifies CLint,metMi→D{mi} and thus affects the disposition of the metabolite: a lower AUC{mi,P} arises from a higher efm′.
Experimentally, we illustrated the interplay between phase II excretion and sulfation and desulfation enzymes with data from Wistar rats as controls and TR− rats as the Mrp2-deficient livers in liver perfusion studies. First, we identified changes in hepatic Mrp2 and Mrp3 as well as microsomal, desulfation activities but not in the protein expression of other transporters and sulfotransferases between the two rat strains (Fig. 2). The compensatory increase of Mrp3 protein in TR− versus Wistar rats (Fig. 2) is consistent with other reports (Johnson et al., 2006), although the change was slightly lower. Changes of similar orders of magnitude were also observed for TR− rats originating from the same laboratory, with Mrp3 ratios for TR− versus Wistar rats varying from 6× to 12× (Johnson et al., 2006; Zamek-Gliszczynski et al., 2006). Our slightly lower ratio of 4.2 could conceivably be due to differences in sample handling and preparation or the variability inherent in the semiquantitative nature of Western blotting. Dramatic changes in perfusate decay and biliary excretion profiles of Wistar versus TR− perfusion studies were observed (Fig. 3). As expected, biliary excretion of E217G and E23S17G was almost abolished in TR− rats (Fig. 3, B and D; Table 3), confirming that Mrp2 is the predominant transporter for biliary excretion of both species (Morikawa et al., 2000). In the TR− liver, absence of Mrp2 for the excretion of E217G and E23S17G that undergo futile cycling, together with the compensatory increase of Mrp3, diverted both E217G and E23S17G into reservoir perfusate that reached near plateau levels (Fig. 3C). Because of the absence of Mrp2 and abolition of the excretion pathway, most of the radioactivities associated with [3H]E217G and [3H]E23S17G were trapped in the TR− rat liver (Table 3).
Modeling of the data proved to be challenging. Fitting of the model to the Wistar data was not that successful because of the complexity of futile cycling, unless the basolateral influx and efflux clearances were assigned. As shown by previous perfusion studies (Sun et al., 2006), the uptake mechanism of E217G was rapid, and the same was assumed for E23S17G because it was documented that 80% radioactivity of [3H]E23S17G appeared rapidly in bile within 15 min after intravenous dosing (Slikker et al., 1983) and simulations based on low CLin{mi} for E23S17G resulted in poor predictions. Moreover, no inhibition was found for E23S17G on the uptake of E217G in basolateral membrane vesicles prepared from male Sprague-Dawley rat livers (Vore and Hoffman, 1994).
The relationships extracted from the steady state (eqs. 1–3), together with the comparison of immunoblots, proved to be a useful strategy to provide parameters for the simulation of E217G and E23S17G profiles in perfusate, liver, and bile to match the experimental data (Fig. 3) for the extremely complex PBPK model (Fig. 1). The approach, although not ideal, offers an alternative to data fitting, which failed to converge or resulted in parameters associated with high S.D.s. The estimated parameters, when compared to those of Sun et al. (2006), revealed strain differences. Higher sulfation extents in Wistar versus Wag/Rij rat livers at 2 h (77 ± 6 versus 37 ± 5% dose; Table 4) (Sun et al., 2006) were noted. This may be explained by enhanced sulfation coupled with faster excretion of E23S17G by Mrp2 in the Wistar versus Wag/Rij rat. The CLef values for Wistar and TR− rat livers were estimated to be low and that for the Wag/Rij liver was almost zero (Sun et al., 2006). These values were again very low compared with the extremely rapid influx (CLin values) assigned for E217G (Table 4). Data from the TR− rat model, however, supported the notion that CLef{mi} was appreciable owing to the elevated Mrp3, because accumulation of E23S17G in perfusate was observed. A discrepancy in the desulfation intrinsic clearances existed, estimated as 1.57 in vitro and 0.155 ex vivo (Table 4). This may be due to the arbitrary assumption that the unbound fractions of E217G and E23S17G in liver tissue are equal to those in perfusate and sinusoidal blood. The actual binding could also differ between the Wistar and TR− strains, affecting the apparent estimates of the secretory, metabolic, and efflux clearances. The initial decay of E217G in the perfusate was slightly underestimated (Fig. 3A). This may be due to the assumption in PBPK modeling that the tubing volume (∼20 ml or ∼10% reservoir volume) of the perfusion apparatus was negligible, with the drug concentration in the tubing being identical to that in the reservoir. However, for a highly cleared compound such as E217G, the drug in the tubing may decay much faster that that in the reservoir due to the lack of mixing with the returning perfusate. Hence, the PBPK model that does not consider the tubing as a separate compartment may slightly underestimate the decay.
The analytical solutions, the experimental data, and model simulations do support the view that a reduction in the excretion of E217G and E23S17G by Mrp2 affects futile cycling kinetics and reduces the net metabolism of E217G. Ordinarily, metabolite parameters would not have an impact on parent drug processing (Pang et al., 2008). However, metabolite and drug parameters do affect the net metabolism, via the coefficient, efm′, when futile cycling exists (Table 2). Moreover, with a reduction in excretory activities toward the metabolite and drug, both efm″ and efm′ would be reduced (cf. Wistar and TR− rats) (Table 4). Under these conditions, both drug and metabolite AUC values would increase. In fact, a pseudo-steady state emerges with futile cycling. The shutdown of biliary excretion of both E217G and E23S17G in the absence of Mrp2 reduced both excretory clearance to almost zero and the total liver clearance (∼0); the net formation of E23S17G from E217G was reduced. This first demonstration allows a deeper understanding of the transporter-enzyme interplay of precursor-product relationships and how metabolite excretion exerts an impact on the net metabolism of the parent drug. The interplay between transporter and enzyme in drug and metabolite processing that was described as a see-saw phenomenon for irreversible metabolic events (Liu and Pang, 2005) has now been extended for futile cycling.
Appendix
Mass Balance Equations for a PBPK Model
In eqs. A1 to A10, D and Mi denote concentrations of the parent drug (representing E217G) and its formed metabolite (representing E23S17G, respectively. QL, V, and f denote the blood flow rate, the volume in each compartment, and unbound fraction, respectively. The subscripts R, LB, L, and bile denote reservoir blood, liver blood/sinusoids, liver tissue, and canalicular bile, respectively. Other parameters (intrinsic clearances) have been defined under Materials and Methods (see also Fig. 1).
For rates of change of E217G and E23S17G in reservoir blood,

 For rates of change of E217G and E23S17G in liver blood or the sinusoid,
 where,
 Hct is the hematocrit, fp is the unbound fraction of the parent drug in plasma. DRBC/Dp is the drug concentration ratio between red blood cells (RBC) and plasma (p):
 For rates of change of E217G and E23S17G in liver tissue,

 For rates of change of E217G and E23S17G in canalicular bile (subscript bile),

 For rates of change of the amounts of E217G and E23S17G in collected bile samples (subscript e),

 where dAe and dAe{mi,P} denote the cumulative secreted amount of parent drug and the formed metabolite, respectively.
Footnotes
This work was supported by the Canadian Institutes of Health Research [Grant MOP89850]. H.S. was a recipient of the University of Toronto Open Fellowship.
Article, publication date, and citation information can be found at http://dmd.aspetjournals.org.
doi:10.1124/dmd.109.029959.
-
ABBREVIATIONS:
- OATP/Oatp
- organic anion transporting polypeptide
- MRP/Mrp
- multidrug resistance-associated protein
- SULT/Sult
- sulfotransferase
- E217G
- estradiol 17β-d-glucuronide
- E23S17G
- estradiol 3-sulfate-17β-d-glucuronide
- Sult1e1
- estrogen sulfotransferase
- HPLC
- high-performance liquid chromatography
- 4-MUS
- 4-methylumbelliferyl sulfate
- AUC
- area under the concentration-time curve
- PBPK model
- physiologically based pharmacokinetic model
- GAPDH
- glyceraldehyde-3-phosphate dehydrogenase.
- Received August 24, 2009.
- Accepted February 2, 2010.
- Copyright © 2010 by The American Society for Pharmacology and Experimental Therapeutics


