


Abstract
Daphnetin has been developed as an oral medicine for treatment of coagulation disorders and rheumatoid arthritis in China, but its in vitro metabolism remains unknown. In the present study, the UDP-glucuronosyltransferase (UGT) conjugation pathways of daphnetin were characterized. Two metabolites, 7-O-monoglucuronide daphnetin (M-1) and 8-O-monoglucuronide daphnetin (M-2), were identified by liquid chromatography/mass spectrometry and NMR when daphnetin was incubated, respectively, with liver microsomes from human (HLM), rat (RLM), and minipig (PLM) and human intestinal microsomes (HIM) in the presence of UDP-glucuronic acid. Screening assays with 12 human recombinant UGTs demonstrated that the formations of M-1 and M-2 were almost exclusively catalyzed by UGT1A9 and UGT1A6, whereas M-1 was formed to a minor extent by UGT1A3, 1A4, 1A7, 1A8, and 1A10 at a high substrate concentration. Kinetics studies, chemical inhibition, and correlation analysis were used to demonstrate that human UGT1A9 and UGT1A6 were major isoforms involved in the daphnetin glucuronidations in HLM and HIM. By in vitro-in vivo extrapolation of the kinetic data measured in HLM, the hepatic clearance and the corresponding hepatic extraction ratio were estimated to be 19.3 ml/min/kg b.wt. and 0.93, respectively, suggesting that human clearance of daphnetin via the glucuronidation is extensive. Chemical inhibition of daphnetin glucuronidation in HLM, RLM, and PLM showed large species differences although the metabolites were formed similarly among the species. In conclusion, the UGT conjugation pathways of daphnetin were fully elucidated and its C-8 phenol group was more selectively catalyzed by UGTs than by the C-7 phenol.
Benzo-α-pyrone skeleton-containing coumarins are widely distributed in the plant kingdom and have a general application in food, drug, and cosmetic products (Egan et al., 1990). As one of coumarin derivatives, daphnetin (7,8-dihydroxycoumarin) has exhibited broad biological activities, such as anti-inflammatory (Fylaktakidou et al., 2004), antioxidant (Fylaktakidou et al., 2004), antimicrobial (Cottiglia et al., 2001), and antimalarial (Huang et al., 2006) effects as well as protein kinase inhibitory activities (Yang et al., 1999). Clinically, daphnetin not only has been developed as an oral medicine for treatment of coagulation disorders and rheumatoid arthritis in China since the 1980s (http://app1.sfda.gov.cn/datasearch/face3/base.jsp) but also has been used as a folk medicine to treat lumbago and reduce fever in Turkey (Yesilada et al., 2001). Moreover, recent studies demonstrated that daphnetin can act as a potent antiproliferative and differentiation-inducing agent in human renal cell carcinoma (Finn et al., 2004).
The pharmacokinetic study of daphnetin in rats after intravenous administration shows that the elimination of daphnetin is rapid with a t1/2 of approximately 15 min and poor bioavailability; however, the mechanisms responsible for the pharmacokinetic properties are unclear (Qu et al., 1983). Structurally, daphnetin contains a catechol group on its basic skeleton, which could be susceptible to metabolism by phase II enzymes, such as UDP-glucuronosyltransferases (UGTs), sulfotransferases, and catechol-O-methyltransferases (Antonio et al., 2002, 2003). Many glucuronidation derivatives of catechol-containing drugs have been detected both in vitro and in vivo, e.g., l-3,4-dihydroxyphenylalanine, a therapeutic drug for Parkinson's disease (Antonio et al., 2002, 2003); protocatechuic aldehyde, a antiasthmatic agent (Liu et al., 2008); and 2-((2-(1H-imidazol-1-yl)-6-methylpyrimidin-4-yl)(3-((benzo-[d][1,3]dioxol-5-ylmethyl)(methyl)amino)propyl)amino)acetamide (PH-302), an inhibitor of nitric oxide synthase (Loureiro et al., 2006). On the other hand, it was noted in previous studies that 7-hydroxycoumarin and 4-methylumbelliferone, the structural analogs of daphnetin, are substrates for the UGTs with high affinity (Uchaipichat et al., 2004; Wang et al., 2006). Therefore, it is necessary to understand the role of glucuronidation in the metabolic elimination of daphnetin because the glucuronidation of most benzo-α-pyrones has been demonstrated as a primary route of clearance (Tukey and Strassburg, 2000).
Glucuronidation, the major phase II conjugation reaction, accounts for >35% of all phase II drug metabolites (Kiang et al., 2005). Nineteen human UGT isoforms have been identified, and these UGTs have been classified into two families (UGT1 and UGT2) based on their sequence identity (Tukey and Strassburg, 2000; Mackenzie et al., 2005). Many UGTs have had broad and overlapping substrate specificities, although the specificity of UGT isoforms to certain substrates is known (e.g., UGT1A1 for bilirubin, UGT1A4 for trifluoperazine, UGT1A6 for serotonin, UGT1A9 for propofol, and UGT2B7 for 3′-azido-3′-deoxythymidine) (Court, 2005; Miners et al., 2006). In addition, human UGTs are tissue-specific because of their differences in expression. For example, UGT1A7, 1A8, 2A1, and 1A10 are expressed mainly in extrahepatic tissues, although liver is generally recognized as the major site of glucuronidation (Fisher et al., 2001). It is notable that highly interindividual variability and the differential UGT expression within different segments of the gut have been also reported (Strassburg et al., 1998). Identification of the human UGT isoform(s) responsible for drug glucuronidation is the pivotal information to understand the potential of clinical drug-drug interactions for drugs or drug candidates as the victims when they were coadministered with an inhibitor of the target UGT(s). Furthermore, the in vivo clearance prediction from in vitro enzyme kinetic parameters can be used to evaluate the quantitative contribution of the UGT(s) to total clearance of a drug.
To date, information on the metabolism of daphnetin still remains unclear. The purposes of the present study are 1) to characterize the in vitro metabolites of daphnetin, 2) to identify the human UGT isoform(s) responsible for the formation of the metabolites, 3) to determine the kinetics of daphnetin glucuronides in microsomes from human liver (HLM), human intestine (HIM), rat liver (RLM), and minipig liver (PLM) and recombinant UGTs, respectively, and 4) to compare the species differences by inhibition analyses.
Materials and Methods
Chemicals and Reagents.
Daphnetin (≥97%), alamethicin, Brij 58, magnesium chloride, d-saccharic acid 1,4-lactone, β-glucuronidase (EC 3.2.1.31), UDP-glucuronic acid trisodium salt (UDPGA), serotonin, propofol, mefenamic acid, and phenylbutazone were purchased from Sigma-Aldrich (St. Louis, MO). Microcon1 YM-30 centrifugal filter devices were obtained from Millipore Corporation (Billerica, MA). HLM, RLM, and PLM were prepared according to the methods described by Guengerich (1989) and previous reports (Zhang et al., 2008). Protein concentration was determined by using bovine serum albumin as the standard (Lowry et al., 1951). Pooled HIM containing equal amounts of microsomes were prepared from both the duodenum and jejunum sections of each of the five donors (one female and four males of white and African-American race, with ages ranging from 16 to 64 years) and a panel of recombinant human UGT Supersomes expressed in baculovirus-infected insect cells was purchased from BD Gentest (Woburn, MA). The glucuronidation activities of Supersomes using different substrates (estradiol for UGT 1A1 and UGT1A3, trifluoperazine for UGT1A4, eugenol for UGT2B17, and 4-methylumbelliferone for UGT1A6, 1A7, 1A8, 1A9, 1A10, 2B4, 2B7, and 2B15) were substantiated by the supplier, with the values of 1000, 250, 1300, 2200, 6900, 12,000, 630, 8700, 86, 330, 1300, and 2100 pmol/min/mg, respectively. Millipore water (Millipore Corporation) and HPLC-grade methanol and acetonitrile (Tedia Company, Inc., Fairfield, OH) were used throughout; other reagents were of HPLC grade or of the highest grade commercially available.
Identification of Daphnetin Glucuronidation.
The incubation mixture (200 μl) contained HLM (0.5 mg of protein/ml), 5 mM UDPGA, 5 mM MgCl2, 25 μg/ml alamethicin, 10 mM d-saccharic acid 1,4-lactone, 200 μM daphnetin, and Tris-HCl buffer (pH 7.4). After 10 min of incubation at 37°C, the reaction was terminated by the addition of 0.1 ml of methanol containing 0.3 μg of internal standard (7-hydroxycoumarin), followed by centrifugation at 20,000g for 10 min to obtain the supernatant for ultra-fast liquid chromatography (UFLC) spectrometry analysis. Control incubations without UDPGA or without substrate or without microsomes were performed to ensure that the metabolites produced were microsome- and UDPGA-dependent. An LCMS-2010EV mass spectrometer system (Shimadzu, Kyoto, Japan) with an electrospray ionization (ESI) interface was used to identify daphnetin and its metabolites (M-1 and M-2) operating in both negative and positive ion modes from m/z 100 to 1000. The detector voltage was set at +1.50 and −1.55 kV for positive and negative ion detection, respectively. The curved desolvation line temperature and the block heater temperature were both set at 250°C. Other MS detection conditions were set as follows: voltage, 4 kV; interface voltage, 40 V; nebulizing gas (N2) flow, tuned to be 1.5 l/min; and drying gas (N2) pressure, 0.06 MPa. Data processing was performed using UFLC-MS Solution version 3.41 software (Shimadzu, Kyoto, Japan).
To confirm that these two metabolites are glucuronide compounds, 200 μl of glucuronidation incubation mixture (see above, but without d-saccharic acid 1,4-lactone) was incorporated into an equal volume of 0.15 M acetate buffer (pH 5.0) containing 1800 Fishman units of β-glucuronidase. After a 2-h incubation at 37°C, the hydrolysis reaction was terminated by addition of 0.1 ml of cold methanol, followed by centrifugation at 20,000g for 10 min, and then 10 μl of supernatant was injected for UFLC-DAD-ESI-MS analysis. Control incubations without β-glucuronidase were performed simultaneously.
Biosynthesis Metabolite and NMR Spectrometry.
The glucuronidation metabolites (M-1 and M-2) of daphnetin were biosynthesized and purified for structure elucidation and quantitative analysis. Enzymatic biosynthesis of M-1 and M-2 was conducted using RLM, because they resemble HLM in daphnetin metabolism. In brief, 600 μM daphnetin was incubated with RLM (0.5 mg of protein/ml), 0.1 M Tris-HCl, pH 7.4, 10 mM MgCl2, Brij 58 (0.5 mg/mg protein), 10 mM d-saccharic acid 1,4-lactone, and 5 mM UDPGA in 100-ml final incubations for 2 h at 37°C. The stock solution of daphnetin (60 mM) was prepared in methanol. The concentration of organic solvent in the final incubation was 1%. The reaction was terminated by transferring the vessel to an ice bath and cooling for 20 min. After removal of protein by centrifugation at 20,000g for 15 min at 4°C, the combined supernatants were loaded on a solid-phase extraction cartridge (C18, 1000 mg; Agela Technologies Inc., Newark, DE), which was preconditioned by sequential washing with 5 ml of methanol and 5 ml of water containing 0.2% formic acid. After loading of the incubation material, the cartridge was washed with 15 ml of water containing 0.2% formic acid. Then, the trapped compounds were eluted with 5 ml of methanol and blown dry with nitrogen gas at 20°C. Finally, the residual was redissolved in 1 ml of methanol and separated by HPLC (Shimadzu) equipped with an SCL-10A system controller, two LC-10AT pumps, an SIL-10A autoinjector, an SPD-10AVP UV detector, and a Shim-pack C18 column (4.6 × 150 mm, 5 μm; Shimadzu). The mobile phase consisted of CH3CN (A) and 0.2% (v/v) formic acid (B) with a linear gradient from initially 5 to 80% A over 15 min. The flow rate was 1.4 ml/min. The purity was greater than 99% for both metabolites by using UFLC-diode array detection.
The structures of metabolites M-1 and M-2 were determined by spectral methods including two-dimensional NMR such as heteronuclear single quantum correlation, heteronuclear multiple-bond correlation spectroscopy, and nuclear Overhauser effect spectroscopy. All experiments were recorded on an AV-600 system (Bruker, Newark, Germany). The purified metabolites of M-1 (2.6 mg) and M-2 (2.3 mg) were stored at −20°C before dissolving in dimethyl sulfoxide-d6 (Euriso-Top, Saint-Aubin, France) for NMR analysis. Chemical shifts are given on a δ scale and referenced to tetramethylsilane at 0 ppm for 1H NMR (600 MHz) and 13C NMR (150 MHz).
Assay with Recombinant UGTs.
Daphnetin glucuronidation was measured in reaction mixtures containing recombinant human UGT1A1, 1A3, 1A4, 1A6, 1A7, 1A8, 1A9, 1A10, 2B4, 2B7, 2B15, and 2B17. The incubations were performed as shown above for the HLM study. Three substrate concentrations (10, 100, and 600 μM) were used in this study: 600 and 100 μM were the approximate concentrations at Vmax and Km values for HLM, respectively;10 μM was used to evaluate the catalytic activity of the UGT isoform(s) with high affinity for daphnetin glucuronidation. All assays were conducted at 37°C for 60 min with the final protein concentration of 0.5 mg of protein/ml. UFLC with diode array detection was used to monitor possible metabolites.
Chemical Inhibition Studies.
Daphnetin glucuronidation in pooled HLM, HIM, UGT1A6, and UGT1A9 were measured in the absence or presence of inhibitor (phenylbutazone or mefenamic acid). Phenylbutazone is a potent inhibitor for UGT1As (Uchaipichat et al., 2006) and mefenamic acid is a potent inhibitor for UGT1A9 (Tachibana et al., 2005). Daphnetin (100 μM) was incubated in the absence or presence of either phenylbutazone (10–500 μM) or mefenamic acid (1–50 μM). All incubations were performed for 10 min using a concentration of 0.1 mg of protein/ml. The IC50, representing the concentration that inhibits 50% of control activity, was determined by nonlinear curve fitting with Origin (OriginLab Corporation, Northampton, MA), as described previously (Zhang et al., 2009). For comparison of the inhibitory effects of phenylbutazone and mefenamic acid among different species, experiments with several concentrations of phenylbutazone (50 and 500 μM) and mefenamic acid (10 and 100 μM) in pooled liver microsomes from humans, rats, and minipigs were conducted to investigate their inhibitory effects on daphnetin glucuronidation.
Correlation Analysis in HLM.
Linear regression analysis was used to assess the correlation between the glucuronidation activity toward daphnetin and serotonin or propofol in microsomes from 14 individual human livers. The activities of UGT1A6-catalyzed serotonin glucuronidation and UGT1A9-catalyzed propofol glucuronidation were 1.27 to 3.05 and 0.25 to 2.20 nmol/min/mg protein, respectively. The daphnetin and HLM concentrations were 100 μM and 0.1 mg of protein/ml, respectively. The reaction mixture was incubated for 10 min at 37°C. The glucuronidation activities of serotonin and propofol were provided by the manufacturer as typical reference activities for UGT1A6 and UGT1A9, respectively. P < 0.05 was considered statistically significant.
Kinetic Study.
The formation rates of daphnetin metabolites were linear over 30 min of incubation and 0.05 to 0.3 mg of microsomal protein. To ensure that less than 10% of substrate was metabolized in all incubations, the kinetic determinations were performed using a microsomal protein concentration of 0.1 mg/ml (HLM, HIM, PLM, PLM, or Supersomes) with a 10-min incubation. For estimating kinetic parameters, daphnetin (5–600 μM) was incubated with pooled microsomes from different sources (HLM, HIM, PLM, or RLM). For recombinant human UGT1A9 and UGT1A6, daphnetin (5–400 μM) was incubated with UGT1A9 and UGT1A6 for kinetic analysis. Kinetic constants for daphnetin glucuronidation by HLM, HIM, UGT1A9, or UGT1A6 were obtained by fitting with the Michaelis-Menten equation using Origin. The Michaelis-Menten equation is v = (Vmax + [S])/(Km + [S]), where v is the rate of reaction, Vmax is the maximum velocity, Km is the Michaelis constant (substrate concentration at 0.5 Vmax), and [S] is the substrate concentration. Results are expressed as mean ± computer-calculated S.E. of the estimate.
Quantitative Analysis.
Daphnetin glucuronides were separated and quantified by UFLC using a Shimadzu Prominence UFLC system, which was equipped with a CBM-20A communications bus module, an SIL-20ACHT autosampler, two LC-20AD pumps, a DGU-20A3 vacuum degasser, and a CTO-20AC column oven, as well as a DAD. A Shim-pack XR-ODS column (100 mm × 2.0 mm, 2.2 μm; Shimadzu) was kept at 40°C. Elution was performed with the following gradient program with solvent A (CH3CN) and solvent B (0.2% formic acid): 0 to 2 min, 95 to 83% B; 2 to 7 min, 85 to 76% B; 7 to 9.5 min, 10% B; and 9.5 to 14.5 min, 95% B. The flow rate was 0.3 ml/min, and the detection wavelength was set at 320 nm. The biosynthesized glucuronidation metabolites M-1 and M-2 were dissolved in methanol and used as the calibration standards. The calibration curves were generated by peak area ratios (calibration standard/internal standard) over the concentration range of 0.5 to 30 μM. The standard curves of the two metabolites were linear over this concentration range, with r2 values >0.99. The limits of detection and quantification were determined at signal/noise ratios of 3 and 10, respectively. The accuracy and precision of the back-calculated values for each concentration were less than 15%.
Prediction of Tissue Clearances from In Vitro Data.
The in vivo intrinsic clearances (CL′int) of daphnetin glucuronidation in liver and intestine were scaled-up by eq. 1 (Obach et al., 1997):
 where Vmax is the maximum velocity, Km is the Michaelis constant, and fu,m is the free fraction of daphnetin in the microsomes. The scaling factors for human liver (40 mg/g and 21.4 g/kg b.wt.) and intestine (3 mg/g and 30 g/kg b.wt.) used in these calculations were obtained from Cubitt et al. (2009) and Soars et al. (2002), respectively. fu,m was predicted to be 0.98 according to eq. 2 (Austin et al., 2002):
 where Cmic is the microsomal protein concentration used in the incubation, the value of which is 0.1 mg/ml for both HIM and HLM, and logP is the log of the octanol buffer (pH 7.4) partition (P) coefficient of the daphnetin, the value of which is 1.2 (http://pubchem.ncbi.nlm.nih.gov/summary/summary.cgi?sid=5991). Therefore, the bound fraction of daphnetin to microsomal protein can be negligible in this study.
For evaluation of the magnitude of UGT conjugation pathways to the elimination of daphnetin, the hepatic clearance (CLH) was predicted from the resulting estimated in vivo hepatic intrinsic clearance (CL′int, liver) using eq. 3, based on the well stirred model (Miner et al., 2006):
 where fu,b is the fraction unbound of daphnetin in blood, QH is hepatic blood flow, and QH values of 20.7 ml/min/kg wt. (Cubitt et al., 2009) were used. Fractions unbound of daphnetin in blood and plasma (fu,p) were considered equivalent for extrapolation purposes, although it is acknowledged that some difference may occur. fu,p was obtained from the separate experiments using the ultrafiltration method (Taylor and Harker, 2006) at two concentrations (17.8 and 178 ng/ml) of daphnetin.
Results
Identification of Daphnetin Metabolites.
Two new peaks were eluted at 4.0 (M-1) and 4.5 min (M-2), respectively, by UFLC when daphnetin (200 μM) was incubated with HLM, HIM (data not shown), RLM, or PLM (0.1 mg/ml) in the presence of UDPGA (Fig. 1). The peaks were not detected in the control samples in the absence of UDPGA, daphnetin, or microsomes (data not shown). The negative-ion mode was adopted for chemical identification because it is more sensitive than the positive-ion mode for daphnetin and its metabolites. Mass spectra were dominated by [M − H]−. M-1 and M-2 were identified by UFLC-ESI-MS to show identical product ions at m/z 353 in negative-ion mode with characteristic m/z 176, corresponding to the glucuronide. In addition, these two metabolites were hydrolyzed by β-glucuronidase to the parent (daphnetin), indicating that M-1 and M-2 are the monoglucuronide metabolites. The two metabolites were further purified and characterized for structural elucidation by 1H NMR, 13C NMR, heteronuclear single quantum correlation, and heteronuclear multiple-bond correlation spectroscopy spectral technology (Table 1). Compared with that of daphnetin, the 13C NMR spectrum of metabolite M-1 showed that C-7 of M-1 shifted upfield to δ 147.8 (Δδ −1.9) because of the glycosidation shift of phenolic compounds, whereas C-6 and C-8 shifted downfield to 114.5 (Δδ +1.9) and 134.1 (Δδ +1.8), respectively (Table 1). All of this evidence indicated that the glucuronosyl substitution should be at the C-7 phenolic group. Likewise, M-2 was identified to be the 8-O-monoglucuronide daphnetin by comparing with the 13C NMR spectrum of daphnetin and regulation of the glycosidation shift. Moreover, all of the 1H and 13C NMR spectral data of metabolites M-1 and M-2 were assigned by the two-dimensional NMR spectra (data not shown).
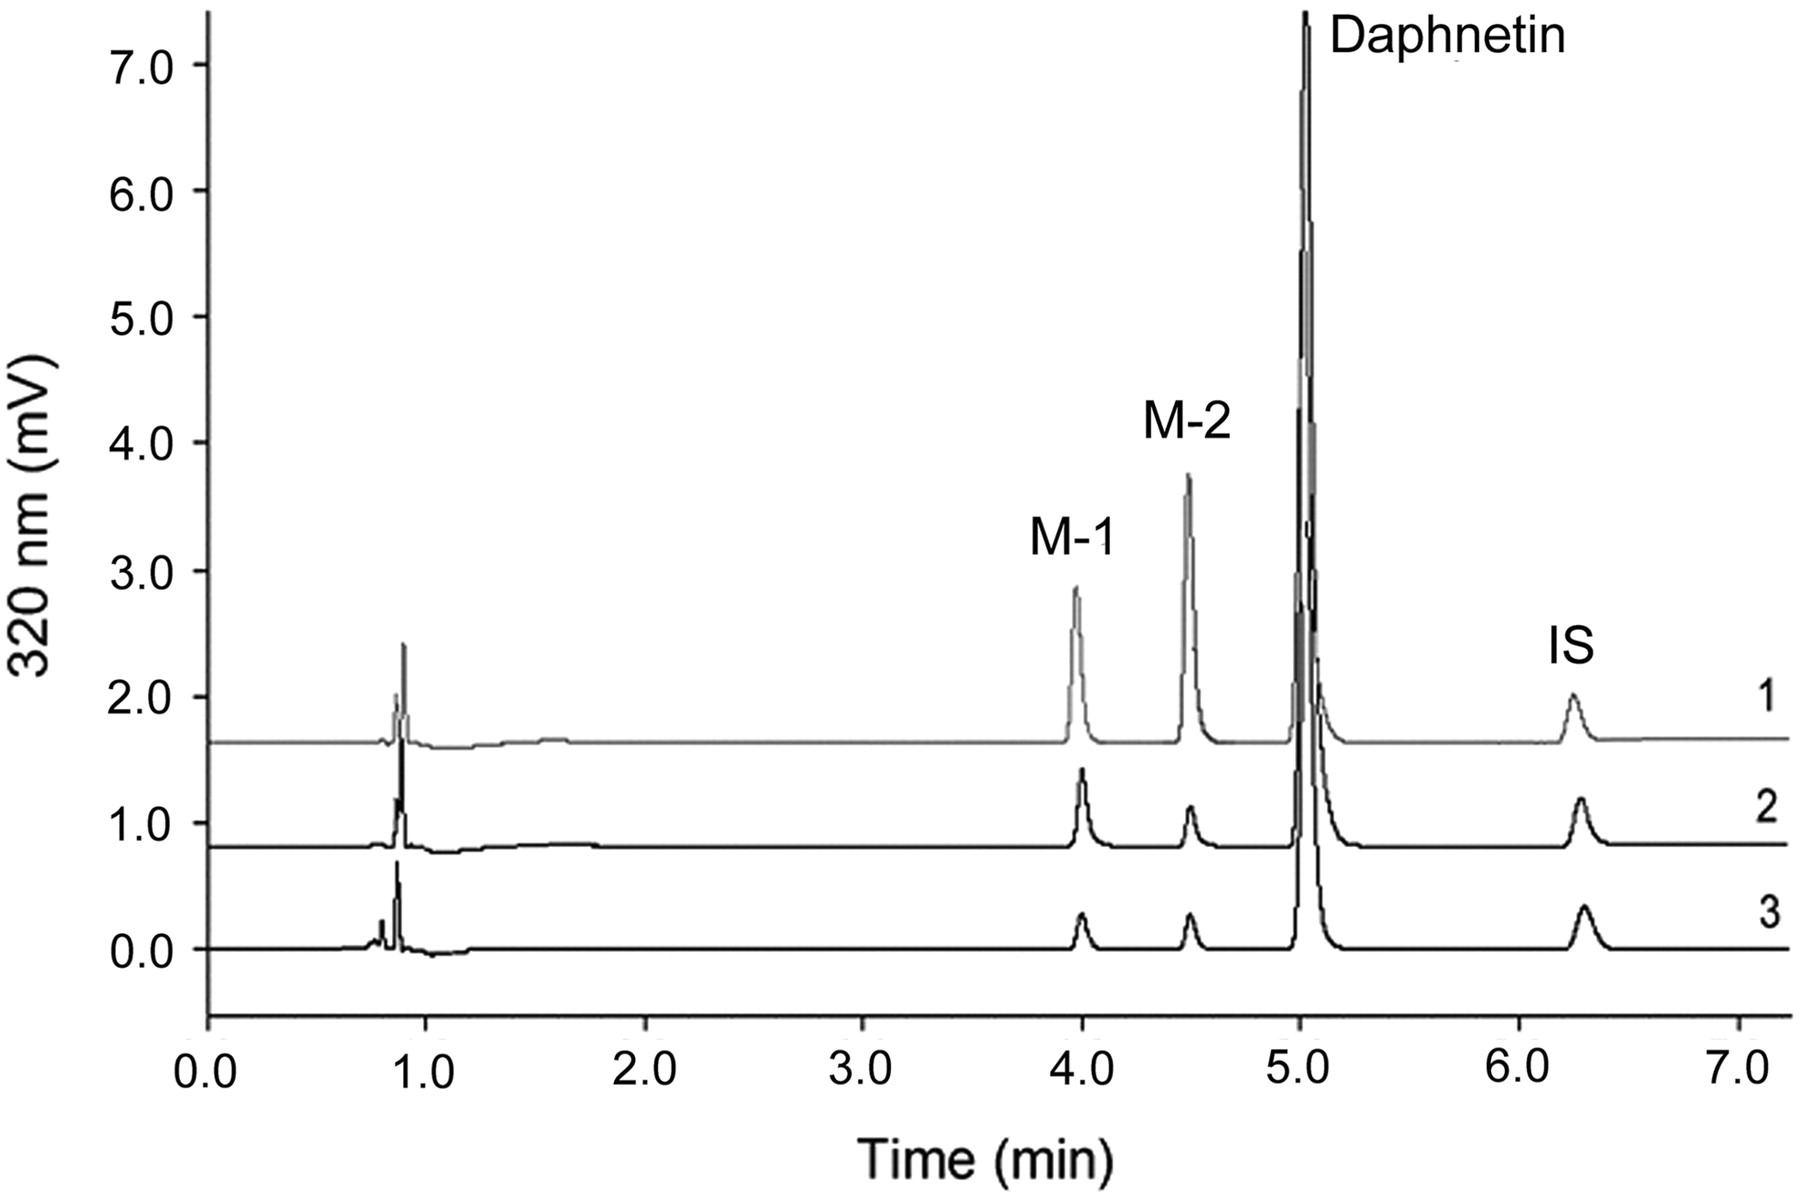
Representative UFLC-DAD profile of daphnetin and its metabolites; 0.1 mg/ml PLM (1), RLM (2), or HLM (3) was incubated with daphnetin (200 μM) at 37°C for 30 min with UDPGA (5 mM) as described under Materials and Methods. Metabolites M-1 and M-2, daphnetin, and internal standard (7-hydroxycoumarin) were eluted at 4.0, 4.5, 5.0, and 6.3 min, respectively.
Proton and carbon NMR chemical shift assignments for daphnetin and its metabolites
Assay with Recombinant Human UGTs.
With the substrate concentrations of 10 or 100 μM, UGT1A6 and UGT1A9 were the only isoforms involved in the glucuronidation of daphnetin. At the high substrate concentration (600 μM), UGT1A6 and UGT1A9 were still the major isoforms involved in daphnetin glucuronidation, although trace amounts of M-1 were formed by UGT1A3, 1A4, 1A7, 1A8, and 1A10 (<20 pmol/min/mg protein) (Fig. 2).
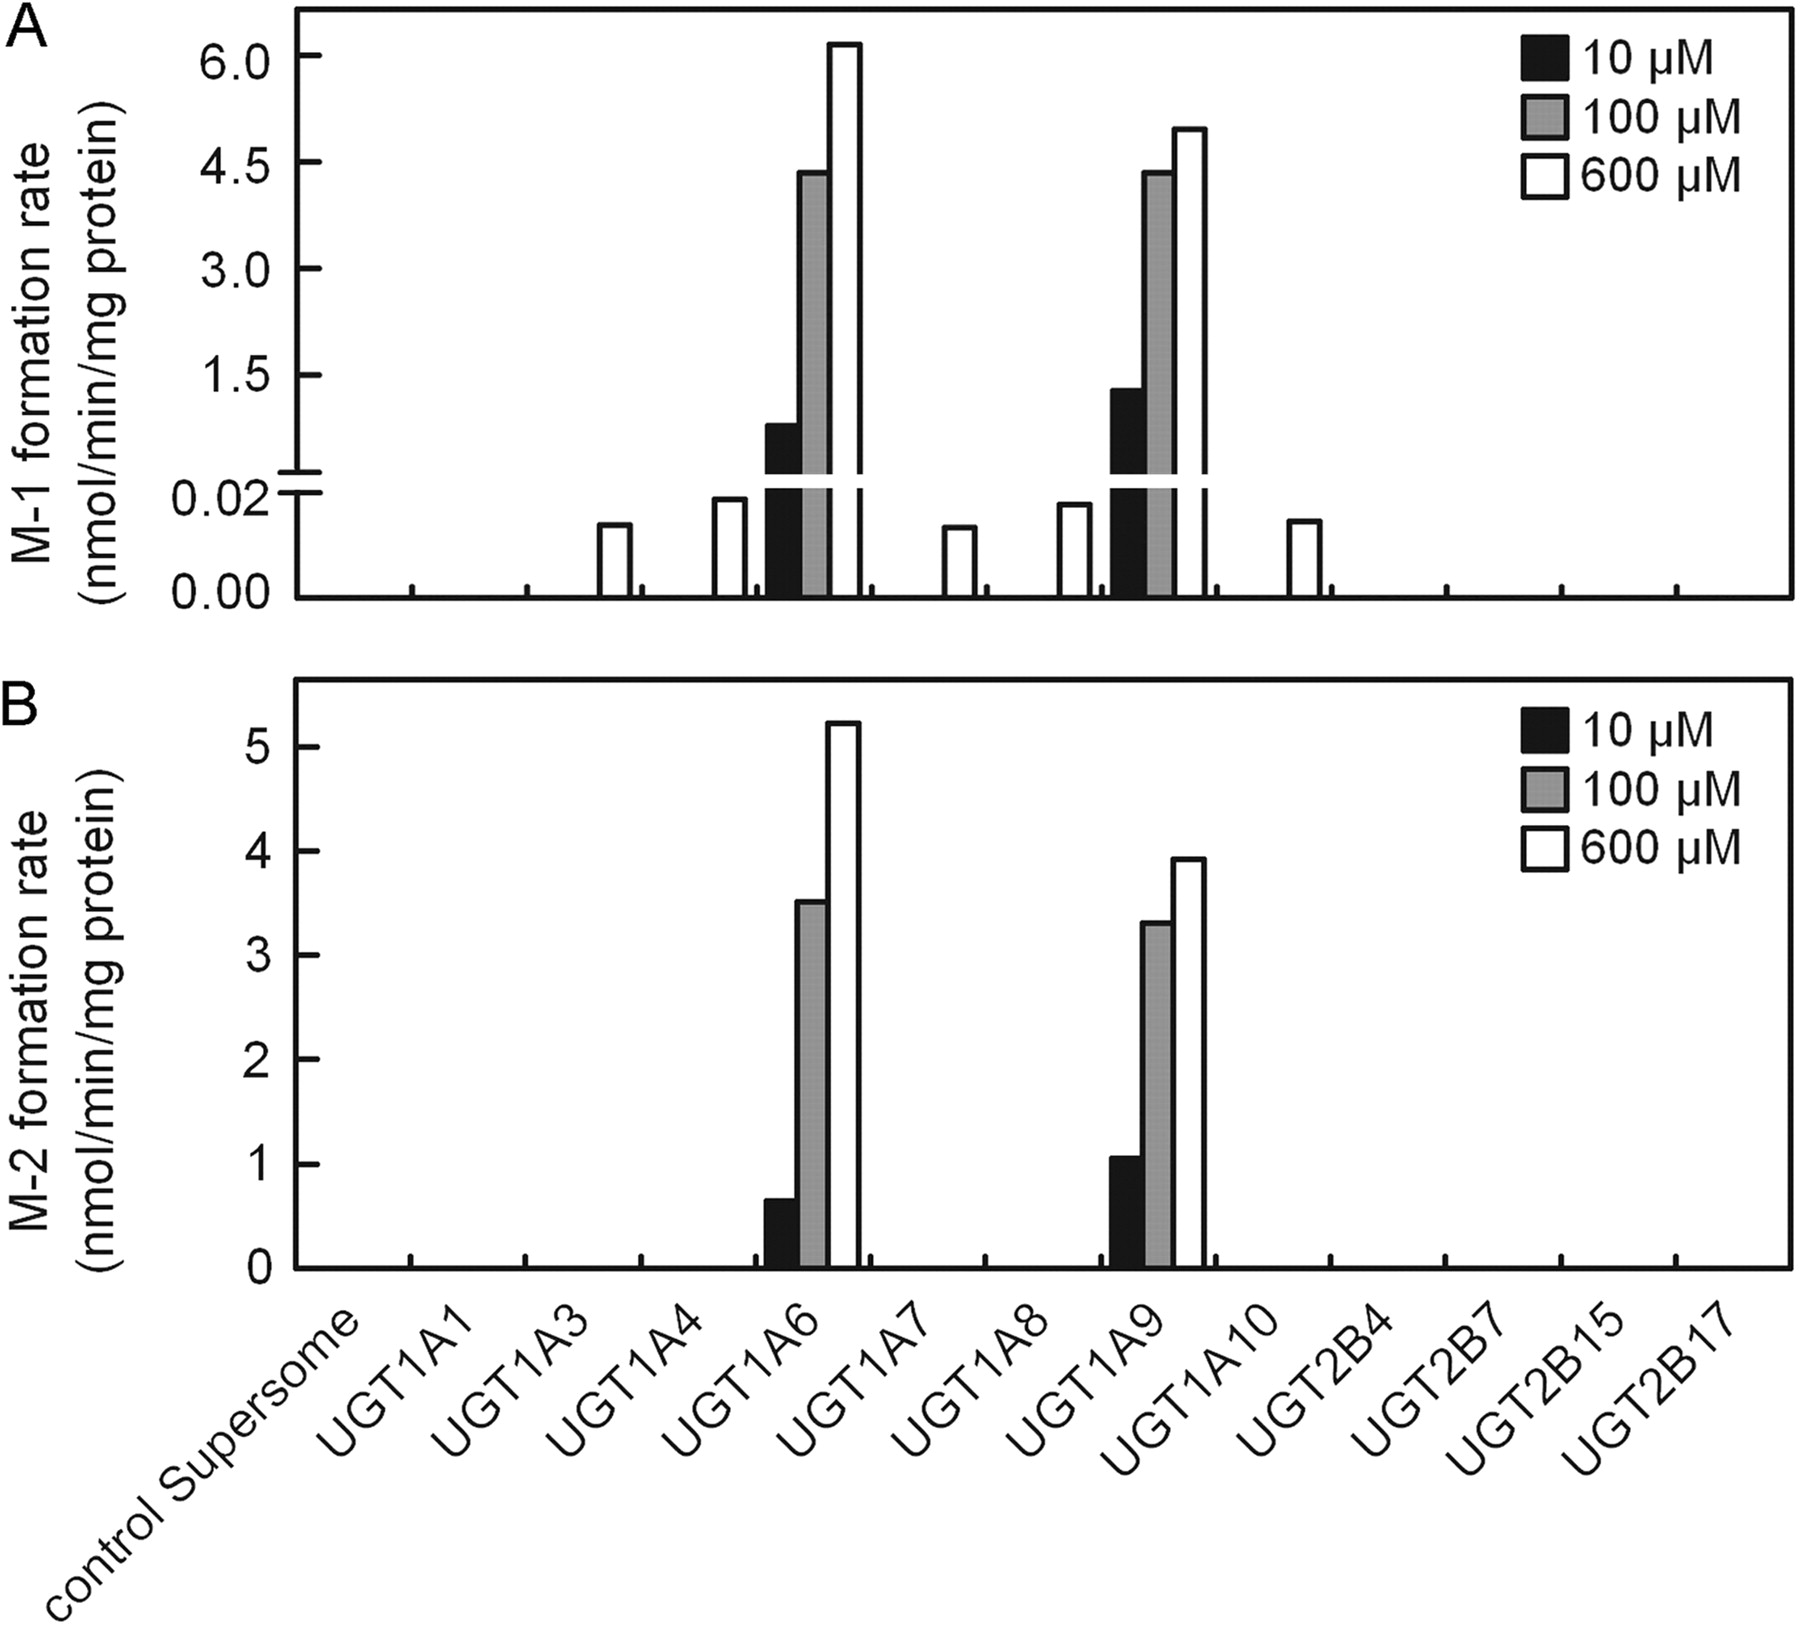
The formation of two metabolites, M-1 (A) and M-2 (B), catalyzed by various recombinant human UGTs. Daphnetin (10, 100, and 600 μM) was incubated with various recombinant human UGTs (0.5 mg/ml) at 37°C for 60 min. Data represent the mean of duplicate incubations.
Chemical Inhibition.
The inhibitory effects of phenylbutazone and mefenamic acid on daphnetin glucuronidation in pooled HLM, HIM, UGT1A6, and UGT1A9 were evaluated. As shown in Table 2, phenylbutazone inhibited potently the UGT activity for the formation of the metabolites in HLM, HIM, UGT1A6, and UGT1A9. Mefenamic acid appeared generally to be more potent in inhibition than phenylbutazone except for UGT1A6. Similar IC50 values of phenylbutazone for HLM, HIM, UGT1A6, and UGT1A9 were measured. However, mefenamic acid showed differential inhibitory effects on the enzyme activity, whereas the inhibition of UGT1A6 (IC50 > 50 μM) was poorer than that observed for other enzyme preparations. As shown in Fig. 3, the inhibitory profiles of phenylbutazone and mefenamic acid on daphnetin glucuronidation in HLM, RLM, and PLM are illustrated to show the species difference. The inhibition rank order of daphnetin glucuronidation among the species was HLM > PLM > RLM for phenylbutazone and HLM > RLM > PLM for mefenamic acid, respectively.
Inhibition of daphnetin glucuronidation in HLM, HIM, and recombinant UGTs with mefenamic acid and phenylbutazone
Daphnetin was incubated with microsomes (0.1 mg/ml) and UDPGA (5 mM) for 10 min in the presence of mefenamic acid (1–50 μM) or phenylbutazone (10–500 μM). The IC50 values are given as mean ± computer-calculated S.E. of the estimate.
Kinetic parameters of daphnetin glucuronidation in microsomes obtained from humans, experimental animals (n = 5), and recombinant UGT1A9 and UGT1A6
Daphnetin was incubated with microsomes (0.1 mg/ml) and UDPGA (5 mM) for 10 min. The kinetic parameters were calculated with Origin software.

Inhibitory effects of phenylbutazone and mefenamic acid on the formation of daphnetin glucuronidated metabolites (M-1 and M-2) in HLM, RLM, and PLM. Daphnetin (200 μM) was incubated with HLM, RLM, and PLM (0.1 mg of protein/ml) and either phenylbutazone (50 and 500 μM) or mefenamic acid (10 and 100 μM) at 37°C for 10 min. Data are expressed as means ± S.D. of duplicate incubations.
Correlation Analysis.
The velocities for daphnetin glucuronidation in liver microsomes from 14 human donors were obtained and range from 1.2 to 10.6 nmol/min/mg protein for M-1 and from 1.3 to 7.8 nmol/min/mg protein for M-2, respectively. The means ± S.D. for rate of the metabolite formation of M-1 and M-2 were 6.0 ± 3.3 and 4.8 ± 2.8 nmol/min/mg protein, with a coefficient of variation (CV) of 57.9% for M-1 and 59.3% for M-2, respectively. Correlation analyses were performed between the daphnetin glucuronosyltransferase activities and serotonin (UGT1A6) or propofol (UGT1A9) glucuronosyltransferase activities in 14 human liver microsomes. As shown in Fig. 4, the daphnetin glucuronosyltransferase activities were significantly correlated with the propofol glucuronosyltransferase activities (r = 0.91, P < 0.001 for M-1; r = 0.94, P < 0.001 for M-2) and serotonin glucuronosyltransferase activities (r = 0.64, P = 0.011 for M-1; r = 0.69, P = 0.006 for M-2).

Correlation analysis between the formation rate of metabolite (M-1 or M-2) and UDP-glucuronosyltransferase isozyme-catalyzed glucuronidation in microsomes from 14 individual human livers. Daphnetin (100 μM) was incubated with microsomes (0.1 mg of protein/ml) for 10 min. Data represent the mean of duplicate determinations. For the formation rate of M-1, the x-axis represents the activity for propofol glucuronidation (A) and serotonin glucuronidation (C). For the formation rate of M-2, the x-axis represents the activity for propofol glucuronidation (B) and serotonin glucuronidation (D).
Kinetic Characterization.
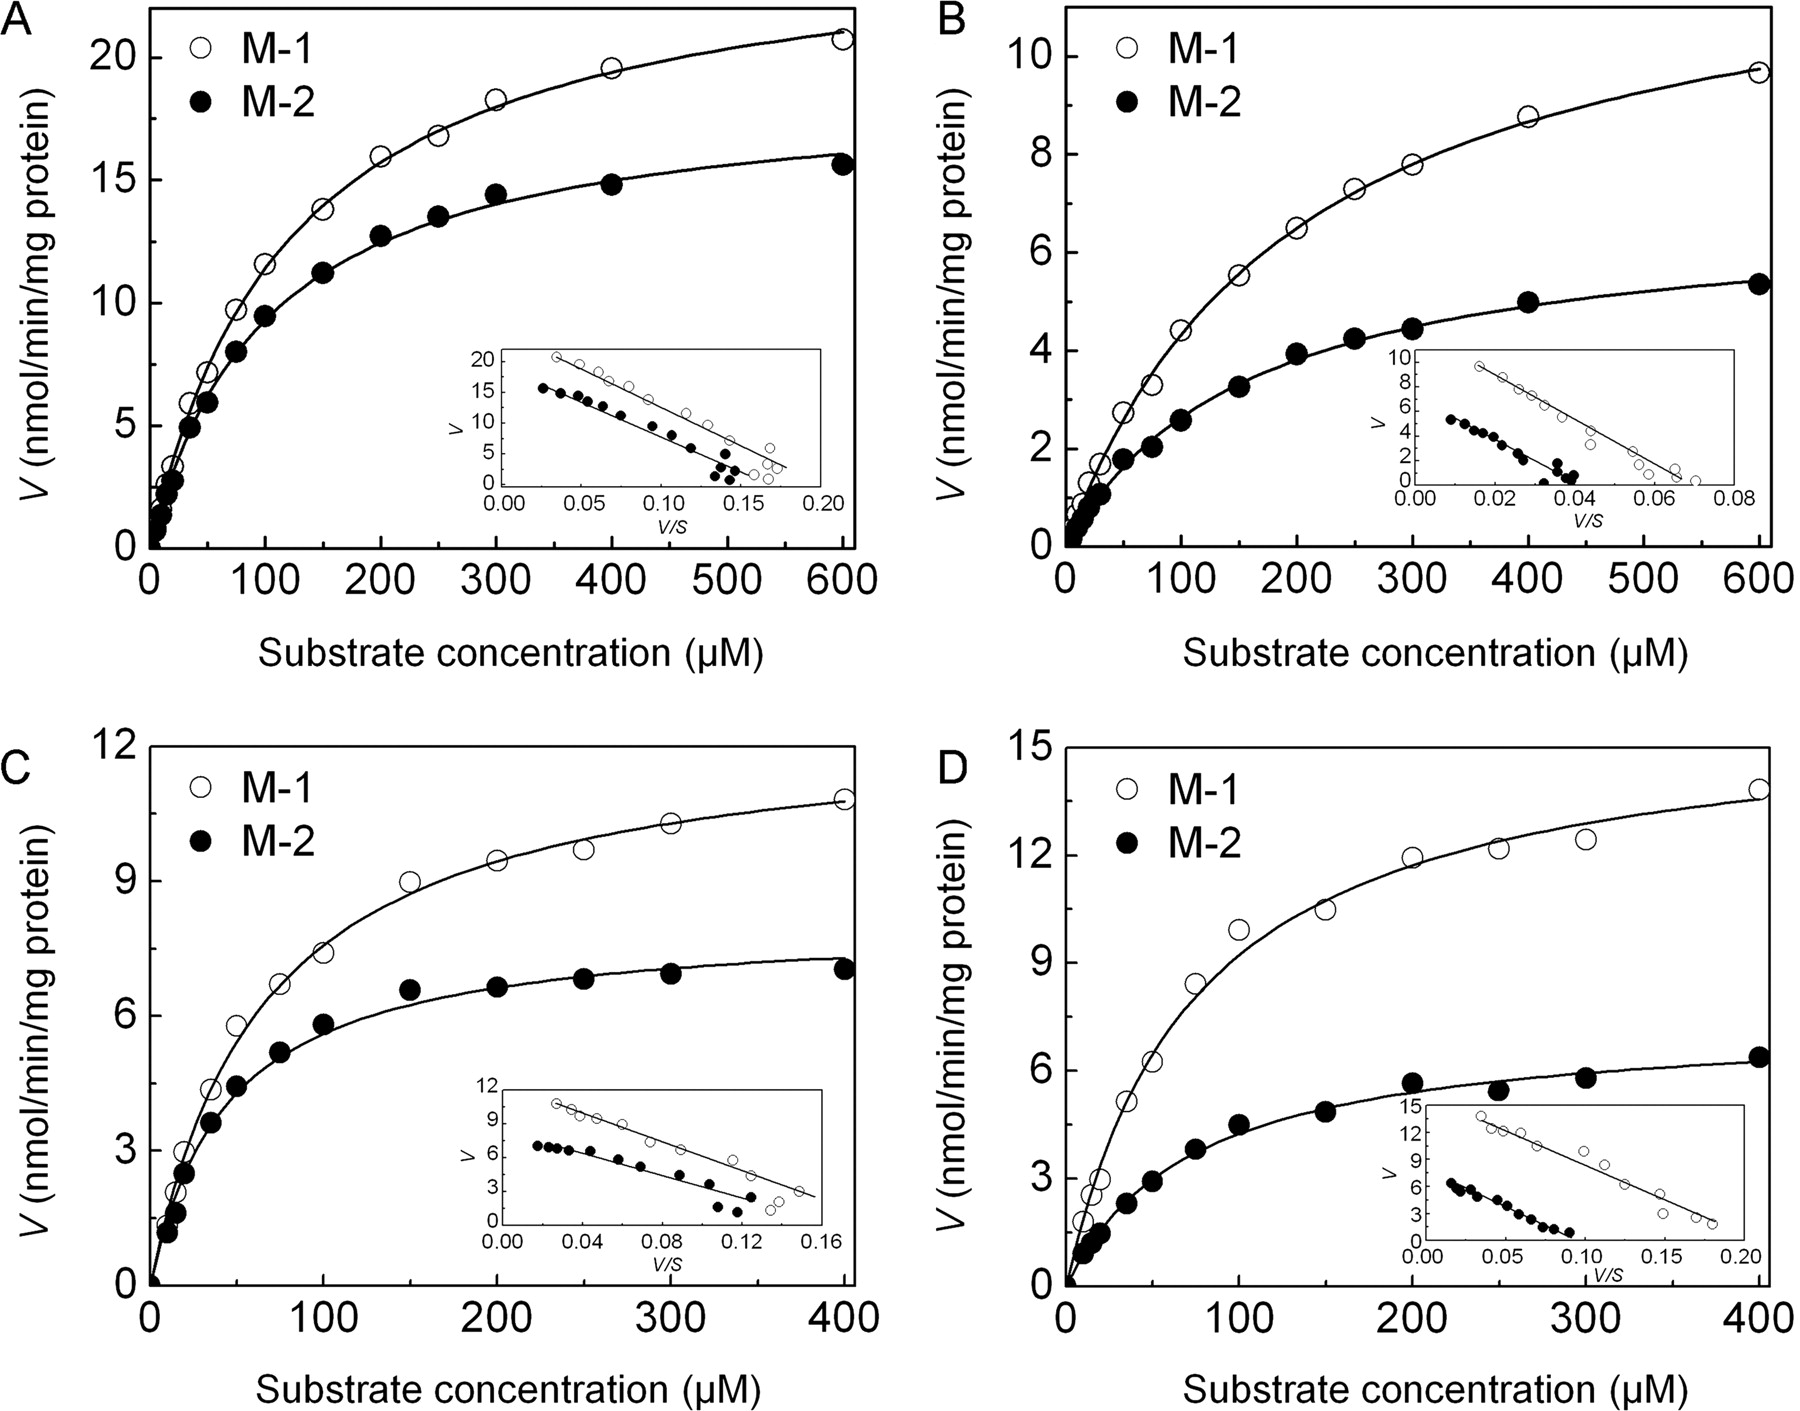
The kinetic parameters of M-1 and M-2 production in HLM, HIM, RLM, PLM, and the potent UGT isoforms were determined and are shown in Table 3. It was unrealistic to evaluate the kinetic parameters in UGT1A3, 1A4, 1A7, 1A8, and 1A10, because the metabolite (M-1) formation rate was close to the limits of quantification. The ranges of substrate concentration for the kinetic analyses in liver and intestine microsomal assays were 5 to 600 and 5 to 400 μM in UGT1A9 and UGT1A6, respectively. In the concentration ranges tested, daphnetin glucuronidation exhibited Michaelis-Menten kinetic characteristics, as evidenced by a linear Eadie-Hofstee plot (Fig. 5). The in vitro total intrinsic clearances (the sum of M-1 and M-2, calculated as Vmax/Km) of the glucuronidation of daphnetin in human liver and intestinal microsomes were 402 and 108 μl/min/mg protein, respectively. By scaling-up, the in vivo intrinsic clearances in liver and intestine were estimated to be 344 and 9.7 ml/min/kg b.wt., respectively. Based on the detected fu, p (0.8), the in vivo hepatic intrinsic clearance was further extrapolated to the hepatic clearance with the value of 19.3 ml/min/kg b.wt. using the well stirred model equation (see Materials and Methods). The hepatic extraction ratio, calculated from the ratio of the predicted hepatic clearance and the hepatic blood flow, was 0.93. The intrinsic clearance values (Vmax/Km) for the two metabolites among the species were M-1 > M-2 in HLM, M-2 > M-1 in PLM, and M-2 ≥ M-1 in RLM. Intrinsic clearance values (M-1 and M-2) in species were PLM > RLM > HLM.

Enzyme kinetics of daphnetin glucuronidation by HLM (A), HIM (B), UGT1A9 (C), and UGT1A6 (D). Daphnetin was incubated with pooled HLM and HIM (5–600 μM, 0.1 mg of protein/ml) or UGT1A9 and UGT1A6 (5–400 μM, 0.1 mg of protein/ml) at 37°C for 10 min. An Eadie-Hofstee plot is shown as an inset to illustrate monophase kinetics.
Discussion
Most of the hydroxycoumarin derivatives sharing their benzo-α-pyrone skeleton are good substrates of human UGTs (Tukey and Strassburg, 2000). For example, 4-methylumbelliferone has been widely used as a nonselective probe for evaluation of glucuronidation activities (UGT1A1, 1A3, 1A6, 1A7, 1A8, 1A9, 1A10, 2B7, 2B15, and 2B17) because of its high affinity for UGTs and turnover for the formation of the metabolite (Uchaipichat et al., 2004). With respect to the catechol compounds, UGT1A6, UGT1A9, and UGT2B7 can potentially be involved in their glucuronidation (Antonio et al., 2003; Loureiro et al., 2006). Daphnetin is a hydroxycoumarin derivative as well as a catechol-containing compound. In the present study, UGT1A9 and UGT1A6 were the most capable of catalyzing the glucuronidation of daphnetin at three substrate concentrations, but a trace amount of daphnetin 7-O-glucuronide could be formed by UGT1A3, 1A4, 1A7, 1A8, and 1A10 (<20 pmol/min/mg protein) at the high substrate concentration (600 μM) (Fig. 3). The findings indicated that the C-8 phenolic group of daphnetin was more selectively catalyzed by UGTs than the C-7 phenol.
UGT1A6 and UGT1A9, which exhibited the highest activity toward daphnetin, are expressed in both the liver and intestine (Strassburg et al., 1998; Basu et al., 2004; Miners et al., 2006). Many phenol-containing xenobiotics are substrates of UGT1A6 and UGT1A9, and significant overlap of substrate selectivity occurs (Ebner and Burchell, 1993; Uchaipichat et al., 2004). The kinetic studies of daphnetin glucuronidation by UGT1A9 and UGT1A6 showed that these two isoforms had similar Vmax/Km values for M-1 formation, although the Vmax/Km value with UGT1A9 was higher than that of UGT1A6 for M-2 formation, which could be attributed to the relative low Km value with UGT1A9 (Table 3). In addition, the Km values in recombinant UGT1A9 and UGT1A6 were lower than those in HLM and HIM, possibly because of 1) the difference in the single/multiple UGT nature between cDNA-expressed and microsomal samples, 2) the relatively low fatty acid content in expression systems, because long-chain unsaturated fatty acids can act as potent competitive inhibitors of UGT1A9 (Rowland et al., 2008), and 3) the involvement of other UGTs for the formation of M-1 at high substrate concentrations (UGT1A3 and UGT1A4 for HLM and UGT1A3, 1A4, 1A7, 1A8, and 1A10 for HIM) (Fig. 2). The comparable kinetic profiles of UGT1A9 and UGT1A6 were also confirmed by the evidence from monophasic Eadie-Hofstee plots observed in HLM and HIM, which suggested that UGT1A9 and UGT1A6 play major roles in the formation of daphnetin glucuronides in these two organs, although UGT1A9 showed marginally higher affinity than that of UGT1A6 (Table 3). Moreover, the findings were also supported by the results of correlation analysis and the subsequent inhibition studies: the high correlation between daphnetin glucuronide formation with propofol O-glucuronidation as well as serotonin O-glucuronidation was displayed in Fig. 4, and the comparable inhibitory effects of phenylbutazone and mefenamic acid on human liver and intestine microsomes with similar IC50 values can be seen from Table 2. It should be noted that mefenamic acid is a known potent inhibitor of UGT1A9 and UGT2B7 in the literature (Tachibana et al., 2005; Gaganis et al., 2007). Because UGT2B7 was not found to be involved in daphnetin glucuronidation, mefenamic acid can seen as a selective inhibitor of UGT1A9 in this study. In vitro UGT conjugation pathways of daphnetin in human liver and intestine are proposed in Fig. 6. As reported, UGT1A7, UGT1A8, and UGT1A10 are exclusively expressed in the gastrointestinal tract (Fisher et al., 2001), and thus these isoforms cannot be involved in the formation of the 7-O-monoglucuronide daphnetin (M-1) in HLM.

In vitro UGT conjugation pathways of daphnetin in human liver and intestine microsomes.
In the current study, large interindividual variability (57.9% CV for M-1 and 59.3% for M-2) was observed in the liver samples from 14 donors, which could be attributed to the effect of age, sex, enzyme inducers (e.g., drugs, tobacco, and alcohol), and genetic polymorphism on the enzyme sources from different donors (Court, 2010). In agreement with our data, the work of Court (2005) showed that UGT1A9-mediated propofol glucuronidation (CV 55%) and UGT1A6-mediated serotonin glucuronidation (CV 76%) had high variability within a human liver bank containing 54 individuals. Because of the large interindividual variability in the hepatic glucuronidation of daphnetin, the different response to the pharmacokinetic and clinical outcomes within people after administration of daphnetin can be forecast. Furthermore, interactions induced by daphnetin with dietary components and other compounds primarily catalyzed by UGT1A9 and UGT1A6 should be given attention in clinical applications.
In vivo clearance prediction from in vitro enzyme kinetic parameters of the kinetic data for daphnetin glucuronidation in HLM and HIM was performed, and results showed that the in vivo intrinsic clearance in liver was markedly larger than that in intestine (344 versus 9.7 ml/min/kg b.wt.), which suggested that the liver might play a major role in daphnetin metabolic clearance via glucuronidation. The well stirred model was constrained to predict the hepatic clearance in this study, considering that gut is not a single homogeneous tissue like liver because intestinal UGTs are mainly expressed in intestinal mucosa and the UGT activities are also not same in different regions of the intestine (Strassburg et al., 1998). The predicted results showed that daphnetin was a high-clearance molecule in vivo with a hepatic extraction ratio larger than 0.7 and that most of the orally administered daphnetin might not reach the systemic circulation because of the significant first-pass hepatic metabolism. Therefore, given the high clearance of daphnetin by glucuronidation, how to retain the plasma concentration of daphnetin to achieve the therapeutic effect remains to be determined. In addition, whether the metabolites (M-1 and M-2) can play a role in pharmacological activity needs to be understood.
Two monoglucuronide metabolites (M-1 and M-2) were detected in liver microsomes of all species and HIM. However, no diglucuronide was detected in any of the microsomal samples, which may be attributable to the steric hindrance of conjugation at one catecholic hydroxyl group from the conjugation at the other group as reported previously (Lautala et al., 2000). The metabolic profiles and enzyme kinetic parameters can be used to evaluate the variation among species (Shiratani et al., 2008). The inhibitory patterns are also very important for selection of animal model(s) suitable to investigate the pharmacodynamics, toxicology, and pharmacokinetics of new chemical entities (Mano et al., 2008). For further evaluation of daphnetin glucuronidation in HLM, RLM, and PLM, inhibition assays were conducted. The inhibition studies with phenylbutazone and mefenamic acid showed significant species differences (Fig. 3), indicating that different UGT isozymes may contribute to the glucuronidation of daphnetin among these species.
In conclusion, daphnetin is extensively glucuronidated in in vitro incubation systems in the presence of UDPGA. UGT1A9 and UGT1A6 are identified as the major isoforms for daphnetin glucuronidation in HLM and HIM. More studies on the biological activities of these glucuronide metabolites are needed. Our results confirmed the crucial role of UGT1A9 and UGT1A6 in the glucuronidation of catechol-containing compounds in humans and further suggested that daphnetin might serve as a probe substrate for UGT1A6 and UGT1A9 to phenotype the UGTs in liver microsomes from human and animals.
Acknowledgments.
We acknowledge the assistance of Dr. Xiao-Chi Ma for the analysis of NMR data.
Footnotes
This work was supported by the National Key Technology R&D Program in the 11th Five-year Plan of China [2008ZX10002-019]; the National Basic Research Program of China [2009CB522808]; and the National Science and Technology Pillar Program in the 11th Five-year Plan of China [2006BAI11B08, 2008BAI51B02].
Article, publication date, and citation information can be found at http://dmd.aspetjournals.org.
doi:10.1124/dmd.109.030734.
-
ABBREVIATIONS:
- UGT
- UDP-glucuronosyltransferase
- PH-302
- 2-((2-(1H-imidazol-1-yl)-6-methylpyrimidin-4-yl)(3-((benzo-[d][1,3]dioxol-5-ylmethyl)(methyl)amino)propyl)amino)acetamide
- HLM
- human liver microsome(s)
- HIM
- human intestinal microsome(s)
- RLM
- rat liver microsomes
- PLM
- minipig liver microsome(s)
- UDPGA
- UDP-glucuronic acid
- HPLC
- high-performance liquid chromatography
- UFLC
- ultra-fast liquid chromatography
- ESI
- electrospray ionization
- DAD
- diode array detector
- CV
- coefficient of variation.
- Received October 20, 2009.
- Accepted February 16, 2010.
- Copyright © 2010 by The American Society for Pharmacology and Experimental Therapeutics


