


Abstract
Fingolimod [(FTY720), Gilenya; 2-amino-2-[2-(4-octylphenyl)ethyl]-1,3-propanediol], a new drug for the treatment of relapsing multiple sclerosis, acts through its phosphate metabolite, which modulates sphingosine 1-phosphate receptors. This represents a novel mechanism of action. In the present work, the absorption and disposition of 14C-labeled fingolimod were investigated in healthy male volunteers after a single oral dose of 4.5 mg. Total radioactivity was determined in blood, urine, and feces. Fingolimod was quantified in blood. Metabolite profiles were determined in blood and excreta, and metabolite structures were elucidated by mass spectrometry, wet-chemical methods, and comparison with reference compounds. Fingolimod was absorbed slowly but almost completely. The biotransformation of fingolimod involved three main pathways: 1) reversible phosphorylation to fingolimod phosphate [(S)-enantiomer, active principle]; 2) ω-hydroxylation at the octyl chain, catalyzed predominantly by CYP4F enzymes, followed by further oxidation to a carboxylic acid and subsequent β-oxidation; and 3) formation of ceramide analogs by conjugation with endogenous fatty acids. This metabolism is quite unusual because it follows metabolic pathways of structurally related endogenous compounds rather than biotransformations typical for xenobiotics. The elimination of fingolimod was slow and occurred predominantly by oxidative metabolism whereas fingolimod phosphate was eliminated mainly by dephosphorylation back to fingolimod. Drug-related material was excreted mostly in the urine in the form of oxidation products.
Introduction
Fingolimod [(FTY720), Gilenya; 2-amino-2-[2-(4-octylphenyl) ethyl]-1,3-propanediol] is a new chemical entity recently approved in the United States as a therapy for relapsing multiple sclerosis (Kappos et al., 2006; Brown et al., 2007). The compound is metabolically phosphorylated to form (S)-configured fingolimod phosphate. The latter is a potent agonist at different sphingosine 1-phosphate receptors, including those of type 1, whereas the (R)-enantiomer, which was not observed as a metabolite, and fingolimod itself show low or negligible activity at these receptors (Hale et al., 2004; Albert et al., 2005). Activation of type 1 sphingosine 1-phosphate receptors on lymphocytes by (S)-fingolimod phosphate results in suppression of the egress of lymphocytes from lymph nodes and prevention of their recirculation to other organs, including the central nervous system (Chiba, 2005; Brinkmann, 2007). Hence, fingolimod exhibits a novel mechanism of action. The compound does not impair T- or B-lymphocyte activation, proliferation, or effector functions at clinically relevant concentrations (Pinschewer et al., 2000). Fingolimod may also have direct effects in the central nervous system because sphingosine 1-phosphate receptors are present in this tissue (Bryan et al., 2008), and (S)-fingolimod phosphate can be assumed to be present as well, based on results in the rat (Foster et al., 2007; Novartis, unpublished data).
The pharmacokinetics of fingolimod and fingolimod phosphate in humans have been described previously (Kovarik et al., 2007a,b). Two metabolites of fingolimod other than its phosphate have been quantified in clinical studies (e.g., Kovarik et al., 2005, 2006, 2007b). However, a full description of the biotransformation of the compound has not been published. In this article, we present the results of an absorption, distribution, metabolism, and excretion study in healthy male volunteers after a single oral dose of 4.5 mg of 14C-labeled fingolimod. Complementary data on the oxidative metabolism of fingolimod in vitro and the involved enzymes are presented in an accompanying publication (Jin et al., 2010).
Materials and Methods
Study Drug.
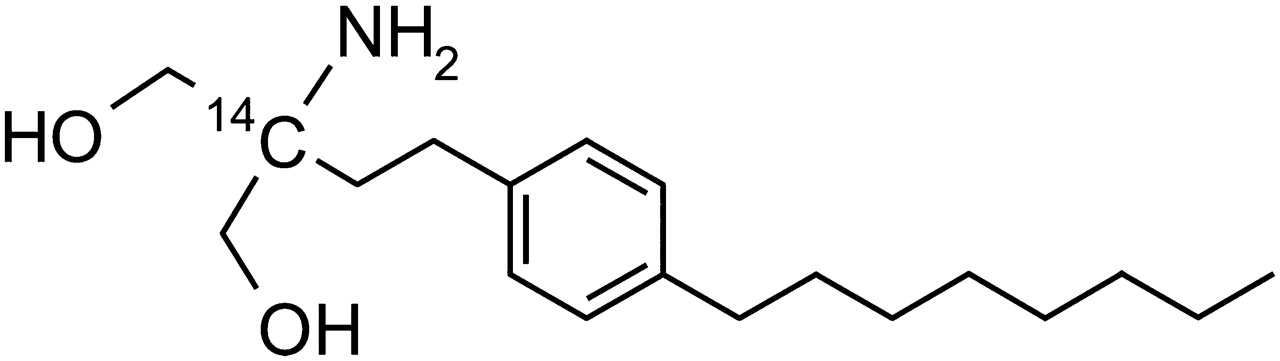
[14C]Fingolimod hydrochloride ([2-14C]2-amino-2-[2-(4-octylphenyl)ethyl]-1,3-propanediol hydrochloride) with a specific radioactivity of 432 kBq/mg (referring to the hydrochloride salt; 149 MBq/mmol) and a radiochemical purity of >98% was synthesized by the Isotope Laboratory of Novartis (Basel, Switzerland). The structure of the compound and the position of the label are shown in Fig. 1.

Structure of [14C]fingolimod.
Chemicals and Standards.
Authentic standards of the metabolites M1 to M4 were obtained from Yoshitomi Pharmaceutical Industries Ltd. (Tokyo, Japan). Authentic standards of the metabolites M29 and M30, unlabeled and 14C-labeled (S)-fingolimod phosphate and [1,1,3,3-2H4]fingolimod, used as internal standard for the quantitation of fingolimod in blood, were synthesized at Novartis. All other chemicals and solvents were of analytical grade and were obtained from commercial sources.
Subjects and Study Design.
The clinical part of the study was performed at Swiss Pharma Contract Ltd. (Allschwil, Switzerland) in accordance with Good Clinical Practice guidelines and the Declaration of Helsinki (1964 and subsequent revisions). All subjects gave written informed consent before entering the study. The protocol and the radiosafety assessment were approved by the ethics committee of the Two Basel, Switzerland, and the Swiss Federal Office of Public Health (Radioprotection Division, Bern, Switzerland), respectively.
Four healthy male subjects participated in this open-label single oral dose absorption, distribution, metabolism, and excretion study. They were of good health as determined by past medical history, physical examination, vital signs, electrocardiogram, and laboratory tests. The subjects were nonsmokers, had no history of alcoholism or drug abuse, and did not use any prescription drug, over-the-counter drug, or herbal medication between 2 weeks before dosing and 5 weeks after dosing, except for medication required to treat adverse events. The subjects had to fast for at least 10 h before dosing and to continue fasting for at least 4 h thereafter.
Each subject received a single oral dose of 5 mg of [14C]fingolimod hydrochloride (4.5 mg referring to free base), formulated as a drinking solution. The radioactivity dose was 2.16 MBq. The whole-body radiation dose was less than 1.0 mSv.
Blood was collected at predose and at 1, 2, 4, 6, 8, 12, 16, 24, 36, 48, 72, 96, 120, 144, 168, 192, 216, 240, 312, 480, and 816 h postdose into EDTA-containing vacuum tubes by direct venipuncture or by an indwelling cannula inserted in a forearm vein. Up to 72 h, blood volumes of 23 ml were taken. At later times, the sampling volume was reduced to 5 ml. After aliquoting for the different assays, the blood samples were frozen and stored at approximately −80°C until analysis.
All urine was collected in time fractions of 0 to 6, 6 to 12, and 12 to 24 h and thereafter in 24-h fractions up to 240 h. In addition, all urine was collected during day 13 (288–312 h), day 20 (456–480 h), and day 34 (792–816 h). During the collection periods, the urine was kept refrigerated at 4 to 8°C. All feces were collected after dose administration up to 240 h postdose. Urine and feces samples were stored at ≤−20°C until analysis.
Aliquots of blood, urine, and feces were assayed for radioactivity by liquid scintillation counting. These analyses were performed by RCC Ltd. (Itingen, Switzerland). Blood concentrations of fingolimod were determined by a validated liquid chromatography-tandem mass spectrometry (LC-MS/MS) assay at Novartis. Metabolite profiles in blood, urine, and feces were obtained by high-performance liquid chromatography (HPLC) with radioactivity detection, and metabolite structures were characterized by mass spectrometry, wet-chemical methods, and comparison with reference compounds at Novartis. Details are given below.
Safety assessments included the monitoring and recording of all adverse events, regular checks of routine blood chemistry, hematology, and urine values, electrocardiogram recordings, measurements of vital signs, and physical examinations.
Liquid Scintillation Counting.
Blood samples were analyzed in triplicate (300 μl each), feces (homogenates in 2 volumes of water) were analyzed in quadruplicate (200–1000 μl each), and urine samples were analyzed in duplicate (1000 μl each). Blood and feces samples were solubilized by standard procedures and mixed with Hionic Fluor liquid scintillation cocktail (PerkinElmer Life and Analytical Sciences, Waltham, MA). Urine samples were measured directly after addition of Insta-Gel Plus (PerkinElmer Life and Analytical Sciences). The measurements were performed on a PerkinElmer Life and Analytical Sciences Tri-Carb 2500 TR liquid scintillation counter or a PerkinElmer Life and Analytical Sciences 2550 TR/LL low-level counter with counting times of 10 to 30 min for blood, 10 min for urine, and 10 min for feces. The long counting times of 30 min were used to improve the counting statistics for blood samples containing low levels of radioactivity (20–100 dpm/ml). Quench correction was performed by an external standard method.
Determination of Fingolimod Concentrations in Blood.
Fingolimod in blood was quantified by LC-MS/MS after liquid-liquid extraction. Aliquots of 0.5 ml were spiked with 100 μl of internal standard solution containing 4 ng of [1,1,3,3-2H4]fingolimod, alkalinized with 0.5 ml of 100 mM aqueous NaOH, and extracted with 5 ml of a 75:25 (v/v) mixture of tert-butyl methyl ether and dichloromethane. The samples were shaken for 30 min and centrifuged. The organic layer was removed, evaporated to dryness, and reconstituted in 200 μl of a 1:1 (v/v) mixture of 20 mM aqueous ammonium acetate and methanol. A 100-μl aliquot of the final extract was injected onto a Symmetry Shield RP8 column (4.6 × 50 mm, 3.5-μm particles; Waters, Milford, MA), protected by a 3.9 × 20 mm precolumn of the same stationary phase. The components were eluted with a gradient of 20 mM aqueous ammonium acetate versus methanol at 40°C using a total flow rate of 2 ml/min. The eluent was directed into the atmospheric pressure chemical ionization source of a TSQ7000 tandem quadrupole mass spectrometer (Finnigan, San Jose, CA) operated in the multiple reaction monitoring mode. For fingolimod and the internal standard, the transitions from m/z 308 ([M + H]+) to m/z 255 and from m/z 312 ([M + H]+) to m/z 259 were monitored, respectively. The lower limit of quantitation was 0.26 pmol/ml (0.080 ng/ml).
Determination of Metabolite Profiles in Blood, Urine, and Feces.
For metabolite profiling in blood, either individual samples or pools across the subjects of samples taken at the same time postdose were analyzed, depending on the available sample volumes and the concentrations of radioactivity. Each blood sample was extracted three or four times with methanol. The methanolic extracts were combined and evaporated to dryness. The residue was reconstituted sequentially in four different solvents of decreasing polarity. The first reconstitution was performed with methanol-acetonitrile-water (7.5:7.5:85, v/v) containing 0.5% (v/v) formic acid. After sonication and centrifugation, the supernatant (extract A) was removed. The pellet was resuspended by sonication in methanol-acetonitrile-water (25:25:50, v/v) containing 0.5% (v/v) formic acid. After centrifugation, the supernatant (extract B) was removed. The remaining pellet was reconstituted two more times in the same way, using methanol-water (70:30, v/v) (extract C) or methanol-water (90:10, v/v) (extract D), both acidified with 0.5% (v/v) formic acid. The extracts A to D were analyzed all together in one HPLC run after they were injected sequentially onto the column in the order D-C-B-A. By this procedure, both polar and moderately nonpolar components were dissolved and concentrated on the head of the HPLC column before the start of the elution. Because the pellet remaining after the forth reconstitution (pellet D) still contained a significant amount of radioactivity, especially at later times after dosing, this pellet was reconstituted again by sonication in a purely organic solvent (dimethyl sulfoxide-methanol, 1:4, v/v). After centrifugation, the supernatant was removed and subjected to a separate HPLC analysis. This fraction of fingolimod-related material is called the “nonpolar fraction,” whereas the fingolimod-related material in extracts A to D is called the “polar fraction.”
Urine of each subject was pooled across the collection period of 0 to 240 h. To an aliquot of each pool, 5% (v/v) of methanol-acetonitrile (1:1, v/v) was added, and the pH was adjusted to 2.6 with formic acid. After centrifugation, the supernatant was analyzed by HPLC.
Feces homogenates of each subject were pooled across the collection period of 0 to 240 h. An aliquot of each pool was extracted twice with acidified methanol (0.017 M hydrochloric acid) and once with pure methanol. Preliminary tests had shown that the addition of acid increased the recovery of radioactivity. The combined methanolic extracts were evaporated to dryness. The residue was reconstituted in a manner similar to that described above for the blood samples. Three different solvents were used for this purpose: methanol-acetonitrile-water (7.5:7.5:85, v/v; extract A), methanol-acetonitrile-water (25:25:50, v/v; extract B), and methanol-water (70:30, v/v; extract C), all acidified with formic acid (0.15–0.5%, v/v). The extracts A to C were analyzed all together in one HPLC run after sequential injection onto the column in the order C-B-A.
The stability of fingolimod and (S)-fingolimod phosphate during the blood and feces preparation and HPLC analysis was investigated using blank blood and feces spiked with [14C]fingolimod or [14C](S)-fingolimod phosphate, respectively. No degradation of either compound was observed.
The chromatography was performed on an HP 1090 (Hewlett Packard, Palo Alto, CA) or an Agilent 1200 (Agilent Technologies, Santa Clara, CA) liquid chromatograph. The components were separated at 40°C on an Advantage Armor C18 column (150 × 4.6 mm, 5-μm particles; Analytical Sales and Services, Pompton Plains, NJ), protected by a 40 × 4.6 mm precolumn of the same stationary phase. For the elution, a gradient of 0.5% (v/v) formic acid in water (pH 2.5; mobile phase A) versus 0.5% (v/v) formic acid in methanol-acetonitrile (1:1, v/v; mobile phase B) was used. The proportion of the mobile phase B was kept at 5% until 10 min after injection and was then increased linearly to 100% at 55 min where it was kept for another 10 min (polar blood fractions, urine, and feces) or 45 min (nonpolar blood fractions). The total flow rate was 1.2 ml/min. Radioactivity was detected by off-line solid scintillation counting. For this purpose, the column effluent was collected in 0.15-min (180 μl) fractions on yttrium silicate scintillator-coated 96-well plates (Deepwell LumaPlates; PerkinElmer Life and Analytical Sciences) using a 222 XL Liquid Handler (Gilson, Villiers-le-Bel, France). Strongly colored fractions, obtained after injection of blood extracts, were bleached by treatment with 20 μl of 30% (w/v) aqueous H2O2 for 30 min at room temperature. The solvents were removed in a vacuum centrifuge, and the dry plates were measured in a TopCount NXT microplate scintillation counter (PerkinElmer Life and Analytical Sciences).
Concentrations in blood and amounts in excreta of fingolimod and its metabolites were estimated from the radiochromatograms, based on the relative peak areas and the concentrations or amounts of radioactivity in the original biological samples, reduced by the losses during sample preparation and chromatography.
Structural Characterization of Metabolites.
The structures of the polar fingolimod-related components were characterized by liquid chromatography-mass spectrometry (LC-MS), nano-LC-MS/MS, and comparison with the available authentic standards [M1, M2, M3, M4, and (S)-fingolimod phosphate]. The nonpolar metabolites M27, M28, M29, and M30 were assigned by comparison of retention times with metabolites identified in animals. In addition, metabolite M22 and the nonpolar metabolites M27 to M30 were investigated by wet-chemical methods.
In brief, the polar metabolites were isolated from blood, urine, and feces by HPLC using sample preparation procedures similar to those described above for the metabolite profiling and the same HPLC method. LC-MS analysis (single-stage mass separation) of the isolated metabolites (or parent compound) was performed on a Q-Tof 2 hybrid quadrupole time-of-flight mass spectrometer (Micromass International, Wythenshawe, UK) using electrospray ionization in the positive ion mode. For the chromatographic separation, a Symmetry C18 column (150 × 1.0 mm, 3.5-μm particle size; Waters) and a gradient of 0.5% (v/v) formic acid in water versus acetonitrile was used. Product ion spectra of the [M + H]+ ions of the isolated components were obtained by nano-LC-MS/MS analysis on the same instrument, using a Symmetry C18 column (150 mm × 75 μm, 3.5-μm particle size; Waters) and the same mobile phases as for LC-MS.
To check whether metabolite M22 might be an acyl glucuronide, its stability in alkaline solution was investigated. For this purpose, the metabolite was isolated from urine by HPLC and incubated for 2 h at room temperature in a 1:2 (v/v) mixture of methanol and 0.4 M aqueous ammonium acetate buffer of pH 10, followed by HPLC analysis.
For obtaining further structural information on the nonpolar metabolites M27 to M30 and additional nonpolar trace components, these metabolites were subjected to alkaline hydrolysis, followed by analysis of the products. To this end, the nonpolar metabolites were isolated from a representative blood sample (36 h blood pool across all four subjects) all together in one HPLC fraction. The pool of nonpolar metabolites was subjected to hydrolysis in a 4:1 (v/v) mixture of ethanol and 2.5 M aqueous KOH for 2 h at 90°C, followed by neutralization and HPLC analysis.
Pharmacokinetic Evaluations.
Pharmacokinetic parameters were calculated from blood concentration-time data using noncompartmental methods. Areas under the concentration-time curve (AUC values) were determined by the linear trapezoidal method and extrapolated to infinity using the equation AUCt–∞ = Ct · t1/2/ln 2, where Ct is the last observed concentration above the lower limit of quantitation (fingolimod) or limit of detection (metabolites). The t1/2 values were calculated by log-linear regression of blood concentrations versus time across the terminal elimination phase. The amounts of radioactivity excreted in urine or feces between the end of consecutive sampling and infinity were estimated by dividing the excretion rate during the last of the consecutive sampling periods by the rate constant of the urinary or fecal excretion, respectively. The latter was obtained by log-linear regression of the urinary or fecal excretion rate of radioactivity versus time.
Results
Demographic, Safety, and Tolerability Data.
Four healthy, male Caucasian subjects were enrolled and completed the study. Their mean age was 40 years (range 35–45 years), height was 184 ± 5 cm (mean ± S.D.; range 179–191 cm), and weight was 82.0 ± 4.7 kg (range 75.1–85.2 kg). Fingolimod was generally well tolerated. However, one subject experienced severe sinus bradycardia, starting at 4 h postdose, associated with temporary hypotension and syncope, whereas no abnormalities were observed in the 12-lead ECG evaluation other than sinus bradycardia. After treatment with atropine (0.5 mg twice), the subject's heart rate recovered to baseline conditions at approximately 24 h postdose. Another subject experienced moderate fatigue of 8.5 h duration during the 1st day after the administration of fingolimod. No concomitant medication was administered in this case. The safety laboratory parameters showed no clinically significant abnormalities or changes in any of the four subjects that would suggest a relationship to the study drug.
Blood Concentrations of Radioactivity, Fingolimod, and Fingolimod Phosphate.
The blood concentrations of total radiolabeled components (radioactivity) and fingolimod increased slowly after dosing, reaching a first maximum at approximately 12 h, followed by a shallow dip and a second maximum at 36 h. Thereafter, the concentrations decreased with estimated terminal half-lives of 382 h (15.9 days) and 137 h (5.7 days) for radioactivity and fingolimod, respectively. The blood concentrations of fingolimod phosphate, derived from the metabolite profiles, reached their maximum at 12 h and decreased thereafter with a terminal half-life of approximately 166 h (6.9 days), hence approximately in parallel to fingolimod (Tables 1 and 2; Fig. 2). Approximately 15% of the AUC0–∞ of radioactivity accounted for fingolimod and 8% for fingolimod phosphate, whereas the rest was due to metabolites other than fingolimod phosphate (see below).
Pharmacokinetic parameters of total radiolabeled components (radioactivity) and fingolimod in blood
Data are means ± S.D. or median (range) from healthy male subjects treated with a single oral dose of 4.5 mg of [14C]fingolimod; n = 4. Radioactivity and fingolimod were determined by liquid scintillation counting and LC-MS/MS, respectively.
Pharmacokinetic parameters of fingolimod and metabolites in blood, derived from metabolite profiles
Data are from healthy male subjects treated with a single oral dose of 4.5 mg of [14C]fingolimod and represent the sum of polar and nonpolar fractions (see Materials and Methods), analyzed individually or as pools of three or four subjects, depending on available sample size. Components are listed in the order of elution.
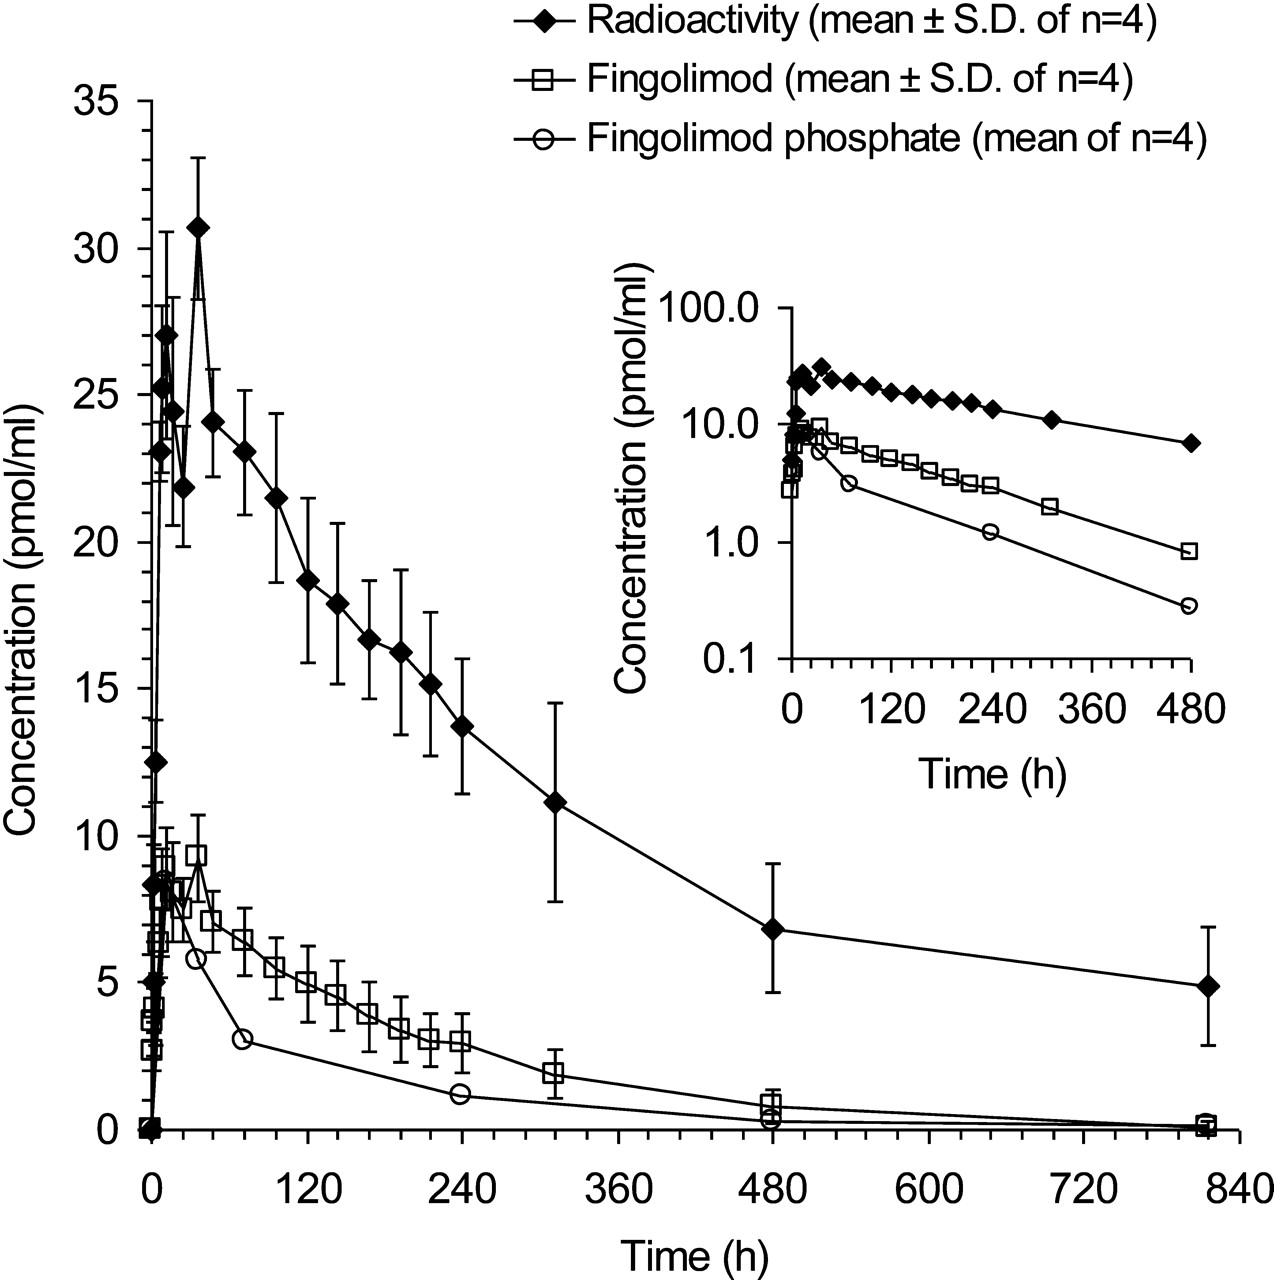
Time profiles of total radiolabeled components (radioactivity), fingolimod, and fingolimod phosphate in blood of four healthy male subjects treated with a single oral dose of 4.5 mg of [14C]fingolimod. Concentrations of fingolimod were determined by LC-MS/MS; concentrations of fingolimod phosphate were derived from metabolite profiles. Inset, semilogarithmic plot up to 480 h; the fingolimod phosphate concentration at 816 h could not be determined with sufficient accuracy.
Metabolite Structures.
The metabolites M1 to M4 and fingolimod phosphate as well as fingolimod itself were assigned to peaks in the radiochromatograms of blood, urine, and feces (Fig. 3) by comparison of their retention times with those of the respective authentic standards. In addition, the mass spectra of M1 to M4, fingolimod phosphate, and fingolimod, obtained after isolation of the compounds from biological samples, matched those of the respective standards. Examples of mass spectra are shown in Fig. 4, A to C; structures of the metabolites are given in Fig. 5.

Representative metabolite profiles in blood (A–D) and excreta (E–F) of healthy male subjects treated with a single oral dose of 4.5 mg of [14C]fingolimod. For technical reasons, blood extracts had to be analyzed in two fractions, a polar and a nonpolar fraction.

Mass spectra of fingolimod (A) and selected metabolites (B–D).

Metabolic pathways of fingolimod in humans.
Metabolite M22 was identified as a glucuronide of metabolite M3, based on the product ion mass spectrum of its [M + H]+ ion, obtained by nano-LC-MS/MS. Protonated M22 at m/z 458 underwent a prominent neutral loss of 176 mass units (anhydroglucuronic acid), typical for glucuronides, resulting in a fragment at m/z 282. The latter underwent further fragmentation very similar to protonated metabolite M3 (data not shown). The structure of M3 contains four potential sites of glucuronidation: two hydroxy groups, a primary amino group, and a carboxyl group. An acyl glucuronide structure could be excluded because isolated M22 was stable in alkaline solution (pH 10, 2 h at room temperature). The remaining possibilities could not be differentiated on the basis of the available data.
The structures of the nonpolar metabolites M27 to M30 shown in Fig. 5 were assigned primarily on the basis of retention times, in comparison with metabolites previously characterized by mass spectrometry and comparison with reference compounds (M29 and M30) in animals (Novartis, unpublished data). As an example, the product ion spectrum of protonated M30, obtained after isolation from monkey blood, is shown in Fig. 4D. All four metabolites are proposed to be products of acylations with endogenous fatty acids at the amino group of fingolimod, i.e., analogs of endogenous ceramides. M27 is proposed to be an amide of an octadecadienoic acid (possibly linoleic acid), M28 an amide of palmitic acid, M29 an amide of 2-hydroxystearic acid, and M30 an amide of stearic acid. The low concentrations of these metabolites in human blood did not allow us to characterize them by mass spectrometry. To further support the structures of M27 to M30 in human blood, the four metabolites were isolated by HPLC all together in one fraction (including additional nonpolar trace metabolites), subjected to alkaline hydrolysis as described under Materials and Methods, and reanalyzed by HPLC. The radiochromatogram showed three peaks: a front peak (natural radioactivity of 40K+ in the KOH used for hydrolysis), [14C]fingolimod, and a trace of [14C]fingolimod phosphate (resulting from trace metabolites other than M27–M30). Fingolimod phosphate was stable under the hydrolysis conditions (data not shown). The alkaline hydrolysis of M27 to M30 to fingolimod is fully in line with the proposed structures of the four metabolites.
In contrast to fingolimod, its phosphate has an asymmetric center and can, therefore, exist as one of two enantiomers or a mixture of the two. As described previously (Albert et al., 2005), only the (S)-enantiomer was detected in human blood, both at early (12 h) and later times after dosing (72 h). The (R)-enantiomer was not detected (limit of detection: 3% of total fingolimod phosphate).
Metabolite Profiles in Blood, Urine, and Feces.
Fingolimod-related components in blood covered a wide range of polarities and had, therefore, to be analyzed in two fractions: a polar fraction containing the major part and a nonpolar fraction containing a minor part of the total radioactivity. Some compounds were observed in both fractions. Attempts to analyze the two fractions in a single HPLC run resulted in poor chromatographic peak shapes and were not pursued. Because of limitations in sample size, blood had to be pooled across subjects for some of the analyses. The recovery of radioactivity after sample preparation was 87 to 98% for blood sampled between 12 and 480 h (sum of polar and nonpolar fractions) but dropped to 63% at 816 h postdose. All radioactivity injected onto the HPLC column was recovered in the column effluent. The polar fraction contained fingolimod, fingolimod phosphate, and M3 as the major components, whereas M2 and the nonpolar ceramide analogs M28, M29, and M30 were minor components. The latter were recovered predominantly in the nonpolar fraction, together with M27. Numerous polar and nonpolar trace components of unknown structure, eluting mainly between 0 and 7 min and between 60 and 85 min, respectively, were observed as well. Quantitative data are given in Table 2, and examples of radiochromatograms are shown in Fig. 3, A to D. In line with the results of the quantitative LC-MS/MS analysis, the blood concentrations of fingolimod derived from the metabolite profiles showed essentially a plateau between 12 and 36 h and decreased slowly thereafter. The concentrations of M2, M3, and fingolimod phosphate maximized at 12 h, followed by a slow decrease. After 36 h postdose, the concentrations of fingolimod, M2, M3, and fingolimod phosphate declined approximately in parallel. The ceramide analogs M27 to M30 showed very shallow time profiles. Between 480 and 816 h postdose, M29 and M30 decreased very slowly with apparent half-lives of approximately 400 h (17 days), close to the half-life of radioactivity and longer than the half-lives of fingolimod and the more polar metabolites. The two minor ceramide analogs M27 and M28 were detected only sporadically.
Metabolite profiles in the 0 to 240 h urine and feces pools were analyzed for each of the four subjects individually. The recovery of radioactivity after sample preparation was 100% for urine and 63% for feces. The recovery of radioactivity in the HPLC effluent, relative to the amount injected, was 100% for urine and 94% for feces. Quantitative data on the fingolimod-related components in urine and feces are given in Table 3; Fig. 3, E and F, shows examples of radiochromatograms. In urine, M3 was the major metabolite, accompanied by M2 and small amounts of M4 and M22. Unidentified metabolites were present in traces only. Neither fingolimod nor fingolimod phosphate nor the ceramide analogs M27 to M30 were detected in urine. The radiolabeled material in the feces extracts consisted mainly of fingolimod and fingolimod phosphate with smaller contributions of M1, M2, M3, and a few unidentified metabolites of very low abundance. The ceramide analogs M27 to M30 were not detected in the feces extracts.
Amounts of fingolimod and metabolites excreted in urine and feces, derived from metabolite profiles
Data are means ± S.D. from healthy male subjects treated with a single oral dose of 4.5 mg of [14C]fingolimod; n = 4. Components are listed in the order of elution.
Excretion of Radioactivity in Urine and Feces.
Urine and feces were collected quantitatively between 0 and 240 h postdose. Additional urine fractions were collected during the time periods 288 to 312, 456 to 480, and 792 to 816 h. All excreta portions were assayed for radioactivity (Table 4). Approximately one-third of the administered radioactivity appeared in urine and feces within the first 3 days after administration. After 10 days, on average 62% of the dose was recovered in the excreta: 52% in urine and 10% in feces. Small amounts of radioactivity in the additional urine fractions, collected after 240 h, indicated that the excretion of radioactivity was still continuing. The excretion rate of radioactivity in urine between 96 and 816 h and in feces between 96 and 240 h decreased close to monoexponentially with apparent half-lives of approximately 173 h (7.2 days) in urine and approximately 65 h (2.7 days) in feces (Fig. 6). Based on these values, the urinary and fecal excretion of radioactivity between time 0 and infinity was estimated to be 81 and 11% of dose, respectively.

Cumulative excretion of radioactivity in healthy male subjects treated with a single oral dose of 4.5 mg of [14C]fingolimod. Measured values are given as mean ± S.D. for n = 4. Extrapolations are described under Materials and Methods.
Cumulative excretion of radioactivity in urine and feces
Data are means ± S.D. from healthy male subjects treated with a single oral dose of 4.5 mg of [14C]fingolimod; n = 4.
Discussion
Fingolimod was absorbed slowly after oral administration. The blood concentrations showed maxima at 12 and 36 h with a small dip in between, followed by a slow decrease (Fig. 2). Similar time profiles had been found previously (Budde et al., 2002; Kovarik et al., 2004). The extent of absorption was estimated to be ≥84% of dose, based on the amount of radioactivity excreted in urine (81% of dose) (Table 4) and the amount of metabolites excreted in feces (≥3% of dose) (Table 3). The absolute bioavailability (F) could not be determined in the present study but can be assumed to be high (Kovarik et al., 2007a). The low apparent clearance of fingolimod (CL/F, 8.7 ± 3.7 l/h), its high apparent terminal volume of distribution (Vz/F, 1509 ± 225 liters), and its long terminal half-life (137 ± 55 h) (Table 1) are in line with data from previous studies (Kovarik et al., 2004, 2006).
The structures of the fingolimod metabolites in blood and excreta indicate three biotransformation pathways: 1) formation of (S)-fingolimod phosphate; 2) ω-hydroxylation at the octyl chain (metabolite M12, not observed in vivo), followed by rapid further oxidation to the carboxylic acid metabolite M1 and subsequent β-oxidation; and 3) formation of nonpolar ceramide analogs (Fig. 5). In addition, a glucuronide of one of the β-oxidation products was observed as a trace metabolite in urine.
Fingolimod phosphate has been demonstrated to be the active principle (Brinkmann et al., 2002; Mandala et al., 2002), whereas fingolimod itself showed negligible pharmacological activity. Of the two enantiomers of fingolimod phosphate, the (S)-form is pharmacologically active, whereas the (R)-form shows only marginal activity as an agonist at sphingosine 1-phosphate receptors or as an inhibitor of lymphocyte migration (Hale et al., 2004; Albert et al., 2005; Kiuchi et al., 2005). Only the (S)-enantiomer of fingolimod phosphate was observed in blood (Albert et al., 2005). According to data from in vitro experiments, (S)-fingolimod phosphate does not undergo direct oxidative biotransformation. Only dephosphorylation back to fingolimod was observed in incubates with human liver microsomes, human liver S9 fractions, and human liver cytosol fractions. The intrinsic clearance of (S)-fingolimod phosphate by hydrolysis in human liver microsomes was low (12 μl · min−1 · mg microsomal protein−1) (Novartis, unpublished data) and in a similar order of magnitude as the intrinsic clearance of fingolimod by oxidation in human liver microsomes (10 μl · min−1 · mg microsomal protein−1) (Jin et al., 2010). Hence, the phosphorylation of fingolimod is reversible, in line with the approximately constant concentration ratio of fingolimod to fingolimod phosphate in blood during the elimination phase (Fig. 2, inset), observed also in a previous study (Kovarik et al., 2007b). The phosphorylation of fingolimod is catalyzed predominantly by sphingosine kinase type 2 with a smaller contribution by sphingosine kinase type 1 (Billich et al., 2003; Paugh et al., 2003). The dephosphorylation of fingolimod phosphate seems to be catalyzed mainly by the lipid phosphate phosphohydrolases LPP1a and LPP3 and to a smaller extent by the specific sphingosine 1-phosphate phosphatase SPP1 (Mechtcheriakova et al., 2007; Yamanaka et al., 2008).
The oxidative biotransformation of fingolimod occurred predominantly or exclusively by hydroxylation at the methyl terminal of the octyl chain. The resulting primary metabolite M12 was not observed in vivo because of rapid further oxidation to the carboxylic acid metabolite M1. However, in incubates with human liver microsomes, M12 was the major metabolite of fingolimod, formed predominantly by CYP4F2 and possibly other enzymes of the CYP4F subfamily with only minor contributions by other cytochrome P450 enzymes (Jin et al., 2010). Metabolite M1 underwent further biotransformation by sequential losses of two-carbon units, forming the carboxylic acid metabolites M2, M3, and M4 through β-oxidation, analogous to the degradation of endogenous fatty acids, known to occur in mitochondria and peroxisomes (Poirier et al., 2006).
Among the nonpolar metabolites in blood, the two major ones (M29 and M30) and two minor ones (M27 and M28) were characterized as ceramide analogs of fingolimod, possibly formed by the action of (dihydro)ceramide synthase and potentially also by ceramidase (reverse reaction), in analogy to the biosynthesis of endogenous dihydroceramide and ceramide (Merrill, 2002). The formation of the ceramide analogs of fingolimod might be reversible because of the action of ceramidase. However, this was not investigated.
These biotransformation pathways of fingolimod are all quite unusual for a xenobiotic and follow metabolic pathways known for structurally related endogenous compounds. The phosphorylation of fingolimod and the formation of ceramide analogs can be explained with the similarity between fingolimod and sphingosine or sphinganine. The β-oxidation must be triggered by the similarity of M1 to endogenous fatty acids. Even the initial hydroxylation of fingolimod at the methyl group seems to follow endogenous pathways because it is catalyzed mainly by CYP4F, a subfamily of enzymes poorly known for involvement in drug metabolism but catalyzing the hydroxylation of saturated and unsaturated fatty acids with a high preference for the ω-position (Ortiz de Montellano, 2008).
The major fingolimod-related components in the systemic circulation, as judged from their AUC values (Table 2), were fingolimod itself, fingolimod phosphate, M3, M29, and M30. M2, M27, and M28 were present in traces only. In terms of maximum concentration (Cmax), fingolimod, fingolimod phosphate, and M3 were the major circulating components. M29 and M30 appeared to be formed very slowly, as suggested by their shallow concentration-time profiles with low blood concentrations at all time points analyzed. However, the half-lives of M29 and M30 (approximately 400 h) were longer than those of fingolimod (137 h on average) and fingolimod phosphate (approximately 166 h) and similar to that of radioactivity (382 h on average), resulting in a substantial contribution of M29 and M30 to the AUC0–∞ of total radioactivity.
The elimination of fingolimod occurred almost exclusively by metabolism, as opposed to direct excretion. No fingolimod was excreted in urine and only 2 to 3% of the dose appeared in the feces (0–240 h) in the form of unchanged compound. Among the primary biotransformation pathways (phosphorylation, hydroxylation to M12, and formation of ceramide analogs), the hydroxylation was clearly the major contributor to the elimination of fingolimod. Elimination due to phosphorylation was a minor process because only 1 to 2% of dose was recovered in the feces in the form of fingolimod phosphate, and no fingolimod phosphate was found in urine. Reversible phosphorylation of fingolimod is not an elimination pathway but rather a distribution-type process. The formation of the ceramide analogs does not seem to be a major elimination pathway of fingolimod either, because no ceramide analogs were detected in urine or feces. However, excretion of a minor amount of ceramide analogs in the feces cannot be excluded because these nonpolar components might not have been recovered efficiently from the fecal matrix. The elimination of fingolimod phosphate occurred predominantly by dephosphorylation back to fingolimod, followed by oxidation of the latter. Direct oxidation of fingolimod phosphate does not seem to occur, as mentioned above, and direct excretion (1–2% of dose detected in feces 0–240 h and no fingolimod phosphate detected in urine) seemed to be a minor process.
The excretion of radioactivity was slow and still incomplete after 10 days of sample collection (approximately 52 and 10% of dose in urine and feces, respectively). However, by extrapolation, an estimate of total excretion up to infinity of 92% of dose was obtained (Table 4), indicating essentially complete excretion of fingolimod-related material. The carboxylic acid metabolite M3 accounted for a major part (approximately 70%) of the radioactivity excreted in urine 0 to 240 h, accompanied by smaller amounts of M2, M4, M22, and some unidentified trace metabolites. The radioactivity in feces 0 to 240 h represented mainly fingolimod and fingolimod phosphate with smaller contributions by M1, M2, M3, and a few trace metabolites of unknown structure (Table 3).
In conclusion, orally administered fingolimod is absorbed slowly but almost completely. The pharmacologically active principle is formed by reversible phosphorylation to (S)-fingolimod phosphate. Conjugation of fingolimod with endogenous fatty acids results in ceramide analogs. The elimination of fingolimod occurs predominantly by CYP4F-catalyzed ω-hydroxylation at the octyl chain, followed by further oxidation to a carboxylic acid and subsequent β-oxidation. All of these biotransformations are rather unusual in drug metabolism but follow metabolic processes of structurally related endogenous compounds. The excretion of fingolimod-related material was very slow but essentially complete with the major portion appearing in the urine.
Authorship Contributions
Participated in research design: Zollinger, Gschwind, Jin, and Hartmann.
Conducted experiments: Jin and Sayer.
Performed data analysis: Zollinger, Gschwind, Jin, Sayer, and Hartmann.
Wrote or contributed to the writing of the manuscript: Zollinger, Gschwind, and Hartmann.
Other: Zécri synthesized the reference compounds for metabolites M29 and M30.
Acknowledgments
We thank Jean-Pierre Baldeck, Christine Douglas von Däniken, and Hubert Borell (Drug Metabolism and Pharmacokinetics, Novartis) for technical support; Dr. Rhys Salter (Isotope Laboratory, Novartis) for the preparation of the radiolabeled compound; Drs. Robert L. Schmouder (Translational Medicine, Novartis) and Felix Waldmeier (Drug Metabolism and Pharmacokinetics, Novartis) for their contributions to the study design and protocol; Dr. Gilles-Jacques Rivière and Nathalie Gauducheau (Drug Metabolism and Pharmacokinetics, Novartis) for bioanalytical support; Drs. Urs Keller and Michael Seiberling (Swiss Pharma Contract Ltd.) for their support of the clinical part of the study; and Drs. Pieter J. Swart and Olivier Kretz for critical review of the article.
Footnotes
Article, publication date, and citation information can be found at http://dmd.aspetjournals.org.
doi:10.1124/dmd.110.035907.
-
ABBREVIATIONS:
- fingolimod (FTY720)
- 2-amino-2-[2-(4-octylphenyl)ethyl]-1,3-propanediol
- LC
- liquid chromatography
- MS/MS
- tandem mass spectrometry
- HPLC
- high-performance liquid chromatography
- MS
- mass spectrometry
- AUC
- area under the concentration-time curve.
- Received August 16, 2010.
- Accepted November 2, 2010.
- Copyright © 2011 by The American Society for Pharmacology and Experimental Therapeutics


