


Luteolin is mainly metabolized by phase II enzymes in animals and humans with glucuronidation and sulfation as the two known metabolic pathways. Although methylation of luteolin was reported previously, the structure of the methylated metabolites and the enzymes involved in the process have not been clarified. In our study, two methylated metabolites, M1 (chrysoeriol) and M2 (diosmetin), were identified in the urine after intravenous administration of luteolin to rats, and the data suggested that the methylation was mediated by catechol-O-methyltransferase (COMT). When luteolin was coadministered with a specific COMT inhibitor, entacapone, the formation of M1 and M2 was significantly reduced, whereas the plasma concentration of luteolin increased. Methylation of luteolin was also studied in vitro using rat tissue homogenates. The apparent kinetic parameters associated with the formation of M1 and M2 in vitro were estimated, and regioselectivity of methylation of luteolin was observed. In the in vitro experiment, there was a preference for the formation of M2 over M1. In contrast, accumulation of M1 was preferred in vivo in both rat plasma and urine after an intravenous dose of luteolin. In conclusion, COMT played a crucial role in the disposition of luteolin in rats. Our results indicated that the methylation pathway in rats was significantly reduced when luteolin was coadministered with a specific COMT inhibitor. Therefore, COMT-associated drug-drug interactions need be considered in the future in luteolin clinical trials because the plasma concentrations and related therapeutic effects may be altered in vivo in the presence of a COMT inhibitor.
Introduction
Luteolin (3′,4′,5,7-tetrahydroxyflavone) is one of the most widely occurring flavonoids in the plant kingdom. Several epidemiological studies have shown that high consumption of foods containing luteolin is associated with a reduced risk of developing chronic diseases (López-Lázaro, 2009). Numerous experimental data have revealed that luteolin possesses a wide range of pharmacological effects, including antioxidation, anti-inflammation, antimicrobial activity, and anticarcinogenic activity (Seelinger et al., 2008a,b; López-Lázaro, 2009).
Because knowledge of the potential benefits of luteolin on health is increasing, it is essential to study the absorption, distribution, metabolism, and excretion process of luteolin in vivo. Luteolin is present in plants as the aglycone and glycosides (López-Lázaro, 2009). In general, the aglycone of luteolin can be directly absorbed in the intestine through passive diffusion, whereas the glycosides of luteolin will be absorbed after being hydrolyzed in the intestine by microbacteria or lactase phlorizin hydrolase (Shimoi et al., 1998; Sesink et al., 2003; Kottra and Daniel, 2007; Lu et al., 2010). It has been proved that luteolin was mainly absorbed in the jejunum passively in a single-pass perfused rat intestinal model (Zhou et al., 2008), and luteolin was relatively permeable (with a apparent permeability coefficient of 5.8 ± 0.1 × 10⁻⁶ cm/s) in a Caco-2 cell model (Ng et al., 2004), which indicated moderate (20–70%) absorption (Yee, 1997). Because of its polyphenol structure, luteolin is a good substrate of uridine diphosphate glucuronosyltransferases and sulfotransferases and mainly undergoes glucuronidation and sulfation during passage through the intestinal mucosa or the liver (Shimoi et al., 1998). Consistent with our previous studies, luteolin occurred mainly as conjugated forms in vivo when Chrysanthemum morifolium extract, containing luteolin 7-O-glucoside, was orally administrated to rat, dog, and human (Li et al., 2005; Li and Jiang, 2006; Chen et al., 2007).
In our previous excretion studies after administration of C. morifolium extract containing luteolin 7-O-glucoside to rat and human (Li and Jiang, 2006; Chen et al., 2007), we focused on the free luteolin or glucuronide and sulfate conjugates of luteolin, and the total excreted luteolin (free and conjugated forms) in rat urine, bile, and feces was 6.60, 2.05, and 31.3% of the dose, respectively, whereas the excreted luteolin (free and conjugated forms) in human urine was 2.03%. Apart from the glucuronidation and sulfation, few reports focused on the other metabolism pathways responsible for disposition of luteolin. On the basis of the structure of catechol, luteolin might be a substrate of catechol-O-methyltransferase (COMT) (EC 2.1.1.6) (Fig. 1); however, this has not been clarified. In our preliminary experiment, two metabolites with longer retention times than luteolin on HPLC chromatograms were found in acidic hydrolyzed urine from rats dosed with luteolin, and we deduced that they were methylated metabolites of luteolin. Therefore, the present study was designed to identify the methylated metabolites of luteolin, to characterize the methylation of luteolin systemically, and to evaluate the effect of methylation in disposition of luteolin in rats. The results will undoubtedly contribute to a better understanding of the disposition and pharmacological effects of luteolin.

Proposed COMT-mediated O-methylation of luteolin. Metabolites: chrysoeriol (3′-O-methylation) and diosmetin (4′-O-methylation).
Materials and Methods
Chemicals.
Luteolin was purchased from Hangzhou Skyherb Technologies Co., Ltd. (Hangzhou, Zhejiang, China) (purity >99%). Diosmetin (3′,5,7-trihydroxy-4′-methoxyflavone) was purchased from Shaanxi Huateng Biotechnology Co., Ltd. (Xian, Shanxi, China) (purity >95%). Chrysoeriol (4′,5,7-trihydroxy-3′-methoxyflavone) was synthesized by the Department of Medicinal Chemistry, College of Pharmaceutical Sciences, Zhejiang University (Hangzhou, Zhejiang, China) (purity >99%). S-Adenosyl-l-methionine p-toluene sulfonate salt was obtained from Aladdin Reagent (Shanghai, China) (purity >80%). Entacapone was obtained from Jinan Wedo Industrial Co., Ltd. (Jinan, Shandong, China) (purity >99%). Methanol, acetonitrile, formic acid, and water were HPLC-grade. All other chemicals were from standard commercial sources and were of the highest quality.
Animals.
Male Sprague-Dawley rats weighing 200 to 250 g were obtained from the Experimental Animal Center of Zhejiang Academy of Medical Sciences. They were housed in cages at 23°C with a 12-h light/dark cycle and given ad libitum access to food and water. All animals were handled according to an approved animal use protocol of Zhejiang University. Animals were given free access to water but were fasted for 12 h before an experiment and for 2 h after drug administration.
Preparation of COMT Fractions from Rat Tissues.
Liver, kidney, small intestine (jejunum), and lung tissue homogenates were prepared as described previously (Bonifácio et al., 2009). In brief, six male Sprague-Dawley rats were sacrificed by cervical dislocation after fasting for 12 h. Tissues (liver, kidney, small intestine, and lung) were homogenized in phosphate buffer (5 mM, pH 7.4) and then were centrifuged at 15,000g for 20 min. The supernatant was used as the total COMT fraction (containing both soluble COMT and membrane-bound COMT).
The erythrocyte total COMT fraction was prepared from hemolyzed erythrocyte as described previously (Soares-da-Silva et al., 2003) with minor modifications. In brief, erythrocytes were separated by centrifugation for 10 min (2000g, 4°C), plasma and the uppermost cell layer were removed, and the remaining erythrocytes were washed twice with 3 volumes of ice-cold 0.9% NaCl solution. Then erythrocytes were lysed with 4 volumes of ice-cold water, the membranes were separated by centrifugation for 20 min (15,000g, 4°C), and the lysate was applied for total COMT assay. The protein concentration was assayed with the BCA protein assay kit (Beyotime Institute of Biotechnology, Jiangsu, China).
Preparation of Rat Liver Microsomes.
Rat liver microsomes were prepared by an ultracentrifugation method. Male rats were sacrificed by cervical dislocation after fasting for 12 h, and livers were perfused with 0.9% NaCl at 4°C and homogenized in 4 volumes of 0.25 M sucrose. After centrifugation for 20 min (9000g, 4°C), the supernatant was collected and centrifuged for another 20 min (19,000g, 4°C), and then the supernatant was centrifuged for 55 min (100,000g, 4°C) to precipitate the microsomes. After removal of the supernatant, the pellet was rehomogenized with 0.15 M KCl and then centrifuged for another 45 min (100,000g, 4°C). The microsomal pellet was resuspended in 20 mM Tris-sucrose (pH 7.4). The protein concentration was assayed with the BCA protein assay kit.
HPLC-DAD Analysis of Two Metabolites of Luteolin in Rat Urine.
Urine samples from rat were hydrolyzed with hydrochloric acid and extracted with ethyl acetate after intravenous administration of 6.5 mg/kg luteolin (Chen et al., 2007). The HPLC analysis was performed as described previously by Chen et al. (2007), and the mobile phase was optimized to separate luteolin and its two metabolites. In brief, the HPLC analysis was performed using an Agilent 200 HPLC-DAD system (Agilent Technologies, Waldbronn, Germany). The separation was performed on an Agilent Zorbax SB-C18 column (250 × 4.6 mm, 5 μm) with a mobile phase consisting of 0.1% phosphoric acid, acetonitrile, and methanol (60:16:24, v/v/v) at 30 ± 1°C with a constant rate of 1 ml/min. The injection volume was 50 μl, and the DAD was set at a wavelength of 350 nm for quantitative analysis. The UV spectra were obtained with the DAD from 200 to 400 nm.
MS/MS Analysis of Two Metabolites of Luteolin.
Two metabolites from the rat urine were separated and collected on HPLC with the chromatographic conditions described above except that 0.2% formic acid was used instead of 0.1% phosphoric acid to adapt to mass spectrometry. The collected elutions were dried under vacuum and redissolved with methanol. Mass spectrometry and MS/MS analysis was performed on an ACQUITY TQD triple quadrupole instrument (Waters, Milford, MA) with a Z-spray electrospray ionization source. Metabolites and standard compounds were infused continuously into the electrospray ionization source, and the deprotonated molecular ions were detected on mass spectrometry with the following parameters: negative mode, capillary voltage of 3.7 kV, cone voltage of 68 V, source temperature of 120°C, desolvation gas temperature of 350°C and collision energy of 40 eV for the MS/MS spectra.
Methylation of Luteolin in Rat Tissue Homogenates with or without COMT Inhibitor.
The COMT reaction was performed as described previously with some modifications (Bonifácio et al., 2009). In brief, the reaction mixture containing homogenate protein (1.0 mg/ml), 100 μM MgCl2, 1.0 mM EGTA, and 20 μM luteolin, with or without 30 nM entacapone in 150 μl of phosphate buffer (5 mM, pH 7.8), was preincubated for 3 min at 37°C, and then 1.5 μl of 25 mM S-adenosylmethionine dissolved in phosphate buffer (5 mM, pH 7.8) was added to initiated the reaction. Reactions were terminated by adding 150 μl of ice-cold methanol after incubation for 0, 20, 40, and 60 min at 37°C. The mixture was centrifuged (15,000g for 10 min), and luteolin and its metabolites in the supernatant were analyzed by the HPLC method described above.
Kinetic Study of Formation of Two Methylated Metabolites of Luteolin with Rat Tissue Homogenates.
Protein concentration of homogenates (0.25 mg/ml for liver, 0.50 mg/ml for kidney, and 1.0 mg/ml for small intestine, lung, and erythrocyte homogenates, in which the initial formation rate of M1 and M2 could be detected within a 10-min incubation) and incubation time (10 min for all tissue homogenates) were used in the kinetic study. The COMT reaction was conducted in the same conditions as described above. The formation kinetics of both M1 and M2 was determined by incubating luteolin at a series of concentrations (1, 2.5, 5, 10, 20, 40, and 80 μM for liver, kidney, lung, and erythrocytes and 0.5, 1, 2.5, 5, 10, 20, 40, and 80 μM for small intestine). The experiments were performed in triplicate, and the reaction velocities were calculated in the unit of nanomoles of product formed per minute and milligram of homogenate protein. Apparent kinetic parameters Km and Vmax were obtained from nonlinear regression by Prism 5 software (GraphPad Software Inc., San Diego, CA) with the Michaelis-Menten equation.
Effect of Entacapaone on Pharmacokinetics of Luteolin and Two Methylated Metabolites In Vivo.
To evaluate the influence of methylation on the pharmacokinetics of luteolin in rat in vivo, entacapaone was used as a specific COMT inhibitor. Ten male Sprague-Dawley rats were allocated into the control group and entacapaone group with five rats each. A dose of 5 mg/kg entacapone [dissolved in 20% hydroxypropyl-β-cyclodextrin (w/v) containing 5% glucose (w/v)] and relevant vehicle was given to the entacapone group and control group intravenously through the tail vein 30 min before administration of 6.5 mg/kg luteolin [dissolved in 20% hydroxypropyl-β-cyclodextrin (w/v) containing 5% glucose (w/v)] intravenously through the tail vein. The blood samples from the orbital venous sinus were collected in heparinized tubes at 0.083, 0.25, 0.5, 1, 2, 3, 5, 7, 9, and 12 h postdose and centrifuged at 2000g for 10 min at 4°C. Plasma samples were stored at −20°C until analysis. Plasma samples were prepared according to the method developed in our laboratory (Chen et al., 2007). In brief, 100-μl plasma samples were hydrolyzed by hydrochloric acid (2 M) at 80°C for 1.5 h, and then the mixture was extracted by ethyl acetate. After the extraction was evaporated to dryness, the residue was reconstituted in the mobile phase, and the concentrations of luteolin and two methylated metabolites were determined by the HPLC methods described above.
Effect of Entacapone on Urinary Excretion of Luteolin and Two Methylated Metabolites.
Ten male Sprague-Dawley rats were allocated into the control group and entacapone group with five rats each, and each rat was housed individually in a metabolic cage at 23°C with a humidity level of 50%. Rats were administered luteolin (control group) or entacapone and luteolin using the method described above. Urine samples were collected in glass flasks containing 200 μl of ascorbic acid (0.1%, w/v) at the intervals of 0 to 4, 4 to 8, 8 to 12, and 12 to 24 h after dose. Residual urine adhering to the metabolic cages was carefully washed with a small volume of saline and pooled with the collected urine. Urine samples were prepared the same as the plasma samples, and luteolin and two methylated metabolites were determined by the HPLC methods described above.
Phase I Metabolism of M1 and M2 in Rat Microsomes.
The phase I metabolism of M1 and M2 in rat microsomes was conducted using the method described by Xia et al. (2007). In brief, 100 μl of mixture containing 14.9 mM trinatric isocitric acid, 0.035 unit/ml isocitric dehydrogenase, 0.15 M MgCl2, 10 μM substrate (M1 or M2), 0.4 mg/ml microsomal protein, and 0.1 M (pH 7.4) Tris-HCl buffer was preincubated at 37°C for 3 min, and the reaction was initiated by adding NADP and NADPH (0.9 mM/0.2 mM). After a 10- or 30-min incubation at 37°C, the reaction was terminated by adding 100 μl of ice-cold methanol. After centrifugation at 15,000g for 10 min, the supernatant was analyzed by HPLC.
Data Analysis.
Data are expressed as the mean ± S.D. Student's t test (unpaired, two-tail) was used to evaluate the significance of the COMT inhibitor (P ≤ 0.05). Pharmacokinetic parameters of luteolin and its two metabolites were estimated by the noncompartmental method using DAS 2.0 software (Chinese Pharmacologic Society, Beijing, China).
Results
Identification of Two Methylated Metabolites in Urine after Intravenous Administration of Luteolin to Rats.
Urine samples were collected after intravenous administration of 6.5 mg/kg luteolin to rats. With a hydrolysis and extraction preparation, urine samples were analyzed by reverse-phase HPLC, and luteolin and two metabolites were separated from endogenous substances in the chromatography system with a retention time of 15.46 min (luteolin), 29.35 min (M1), and 30.85 min (M2), respectively (Fig. 2A). The retention times of M1 and M2 were matched with the standard of chrysoeriol and diosmetin, respectively, under the same HPLC conditions (Fig. 2A). In addition, the two metabolites were also detected in rat tissue homogenates from the in vitro incubation study with luteolin.

Identification of two methylated metabolites of luteolin in hydrolyzed urine after intravenous administration of 6.5 mg/kg luteolin to rats. A, HPLC chromatograms of blank rat urine (A1), 0 to 4 h urine (A2) after intravenous administration of 6.5 mg/kg luteolin to rat, standard compounds, chrysoeriol (A3), and diosmetin (A4). B, UV spectra of M1, M2, chrysoeriol, and diosmetin. C, MS/MS spectra of M1, M2, chrysoeriol, and diosmetin. mAU, milli-arbitrary units.
The M1 and M2 metabolites had the same UV and MS/MS spectra as chrysoeriol and diosmetin, respectively (Fig. 2, B and C). In the MS/MS analysis, a characteristic fragmentation of flavonoids was obtained, in which the [M − H − CH3]− ion of 284 represented a methylated luteolin, ion m/z 107 and 151 represented the A ring of luteolin and ion m/z 132 represented the B ring of luteolin, and ion m/z 255 and 284 represented [M − H − CH3 − CO]− and [M − H − CH3], respectively. On the basis of the HPLC chromatograms, UV spectra, and MS/MS analysis, M1 and M2 were identified to be 3′-O-methylated luteolin (chrysoeriol) and 4′-O-methylated luteolin (diosmetin), respectively.
Methylation of Luteolin in Rat Tissue Homogenates.
Methylated metabolites, M1 and M2, were detected after incubation with luteolin in rat liver, kidney, lung, small intestine, and erythrocyte homogenates in the presence of S-adenosylmethionine. The time profiles of luteolin elimination and metabolites formation are shown in Fig. 3. It was revealed that methylation contributed almost all of the elimination of luteolin in rat tissue homogenates after incubation. The elimination of luteolin and formation of M1 and M2 both dramatically decreased in the presence of 30 nM entacapone, the specific COMT inhibitor (Fig. 3). In all of the tissue homogenate incubations investigated, there was a preference for formation of M2 over M1, with a M2/M1 ratio of 2.2 to 2.6 in liver, kidney, and erythrocyte and 1.2 in small intestine and lung (incubation for 20 min). The M2/M1 ratio did not change significantly except for a slight decrease in the small intestine and lung in the presence of entacapone. Of all tissues studied, liver showed the highest methylation activity, followed by kidney, small intestine, lung, and erythrocyte (Fig. 3).

Luteolin metabolism and metabolite formation by incubation of rat tissue homogenates [liver, kidney, small intestine (jejunum), lung, and erythrocytes] with 20 μΜ luteolin in the absence (– – –) or in the presence (——) of 30 nM entacapone. Incubation for 0, 20, 40, and 60 min at 37°C. Protein concentrations of tissue homogenates were 1 mg/ml. Values are expressed as the mean ± S.D. (n = 3). Data between control and experiment groups were compared with Student's t test (unpaired, two-tailed): *, P < 0.05; **, P < 0.01.
Kinetics Study of M1 and M2 Formation in Rat Tissue Homogenates.
M1 and M2 were formed on the basis of the methylation of luteolin, and the initial formation rate could be obtained within 10 min of incubation. Both M1 and M2 followed Michaelis-Menten kinetics well (Fig. 4). The formation rate of M1 and M2 almost reached the apparent Vmax at 40 μΜ luteolin in all the tissue homogenates. The apparent Vmax of M2 was approximately 2-fold higher than that of M1 in all the tissue homogenates, and both M1 and M2 showed the highest apparent Vmax in the liver, followed by kidney, small intestine, lung, and erythrocyte (Table 1). M1 and M2 had a similar apparent Km (3.57–3.82 μM) in liver and kidney homogenates, but with different apparent Km values in other tissues (Table 1). The estimated values of Vmax/Km for M2 were approximately two times higher than that of M1 in all the tissues except for the lung (Table 1).
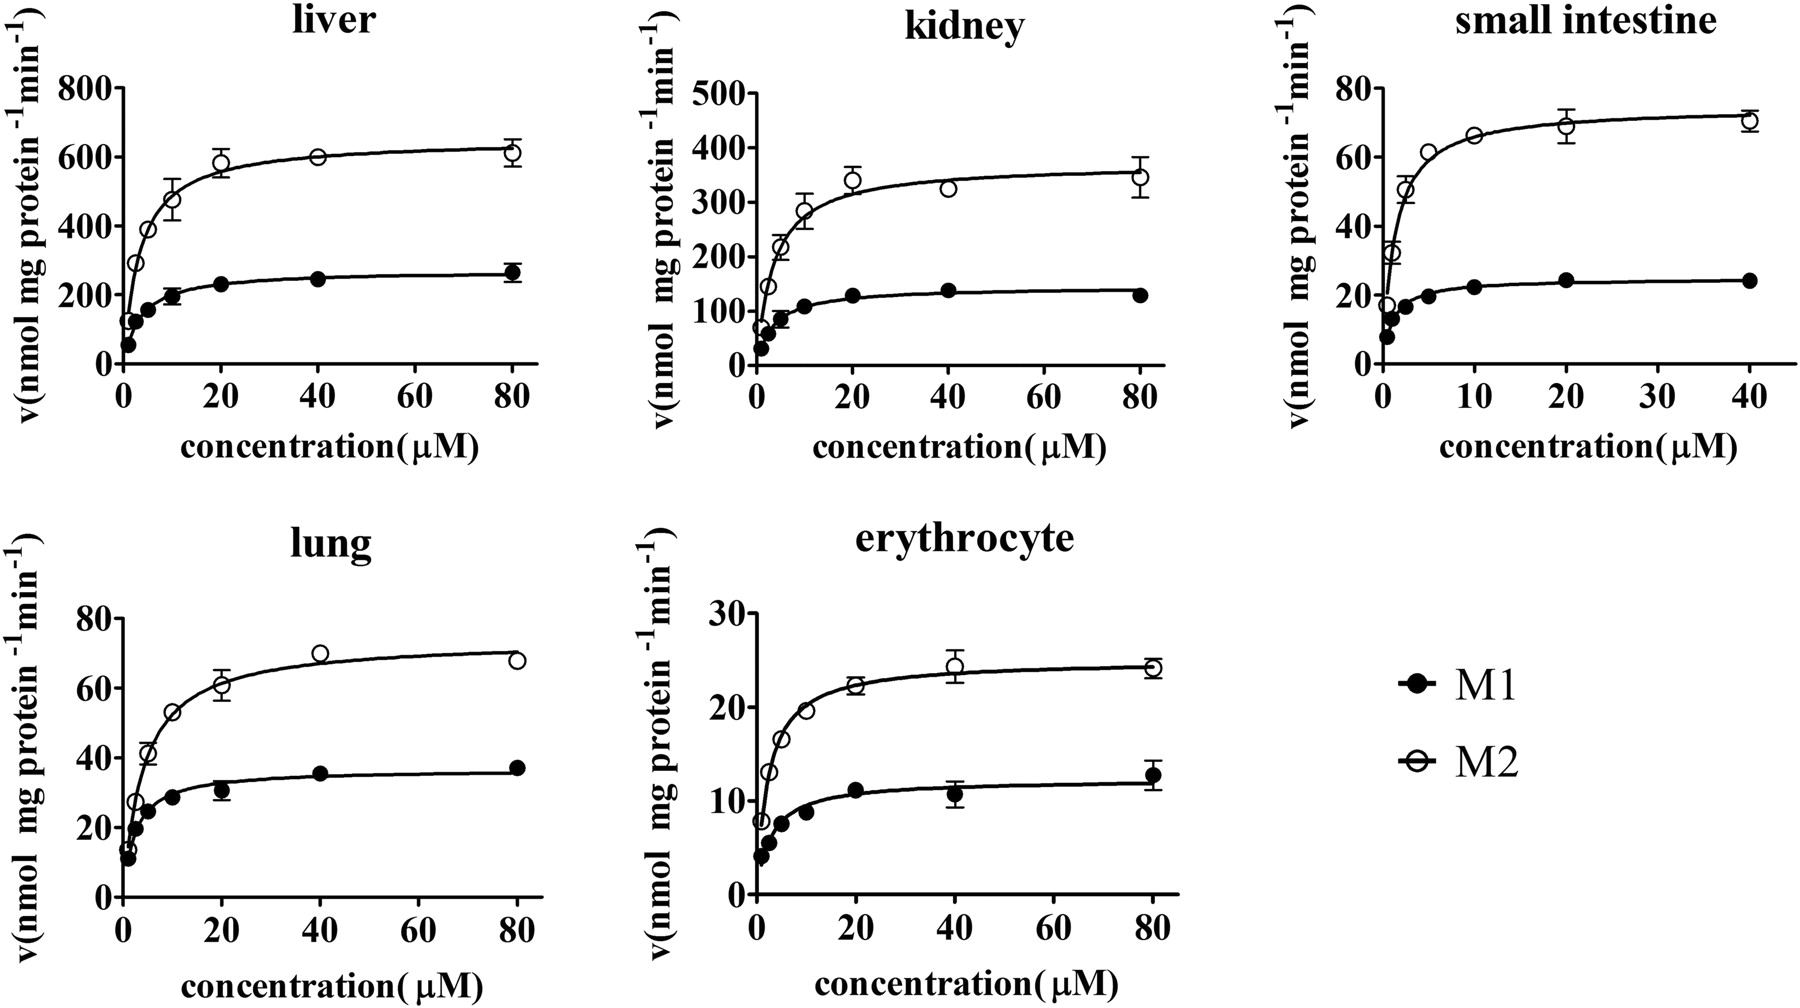
Apparent formation rates of M1 (3′-O-methylation) and M2 (4′-O-methylation) in rat tissue homogenates [liver, kidney, lung, small intestine (jejunum), and erythrocyte]. Formation rates of M1 and M2 were determined with a series of concentrations of luteolin (1, 2.5, 5, 10, 20, 40, and 80 μM for liver, kidney, lung, and erythrocytes and 0.5, 1, 2.5, 5, 10, 20, 40, and 80 μM for small intestine). Protein concentrations of 0.25 mg/ml for liver, 0.5 mg/ml for kidney, and 1.0 mg/ml for small intestine, lung, and erythrocyte homogenates and incubation time of 10 min were used. The formation rate is the average of three determinations, and the error bar represents the S.D. of the mean. The points are observed formation rates of M1 and M2, and the curves were estimated on the basis of nonlinear regression using Prism 5 software with the Michaelis-Menten equation.
Apparent kinetics parameters for M1 and M2 by rat tissue homogenates with luteolin
Data are expressed as the mean ± S.D. n = 3.
Pharmacokinetics of M1, M2, and Luteolin in Rats with or without Entacapone.
The plasma concentration-time profiles of M1, M2, and luteolin after intravenous administration of 6.5 mg/kg luteolin to rats in the control (without entacapone) and entacapone-treated groups are presented in Fig. 5A. In the control group, the intact profiles of luteolin, M1, and M2 could be obtained, the maximal concentration of M1 and M2 was reached at 5 min after dosing, and the total AUC0–∞ values of the two metabolites were 33.6% of that of luteolin (Tables 2 and 3). In vivo, the M2/M1 ratio in AUC0–t was 0.20, whereas the in vitro ratio ranged from 1.4 to 2.6 using AUC0–t calculated from the formation profiles of M1 and M2 (Fig. 3). In the entacapone-treated group, the plasma concentration of luteolin was significantly higher than that of the control group, and the AUC0–∞ of luteolin increased by 52% and the MRT0–t was longer than that of the control group (Table 2). Meanwhile, the plasma concentrations of M1 and M2 dramatically decreased (Fig. 5A). M1 was only detected at 0.083, 0.25, 0.5, and 1 h postdose, whereas M2 was not detected at any time points.
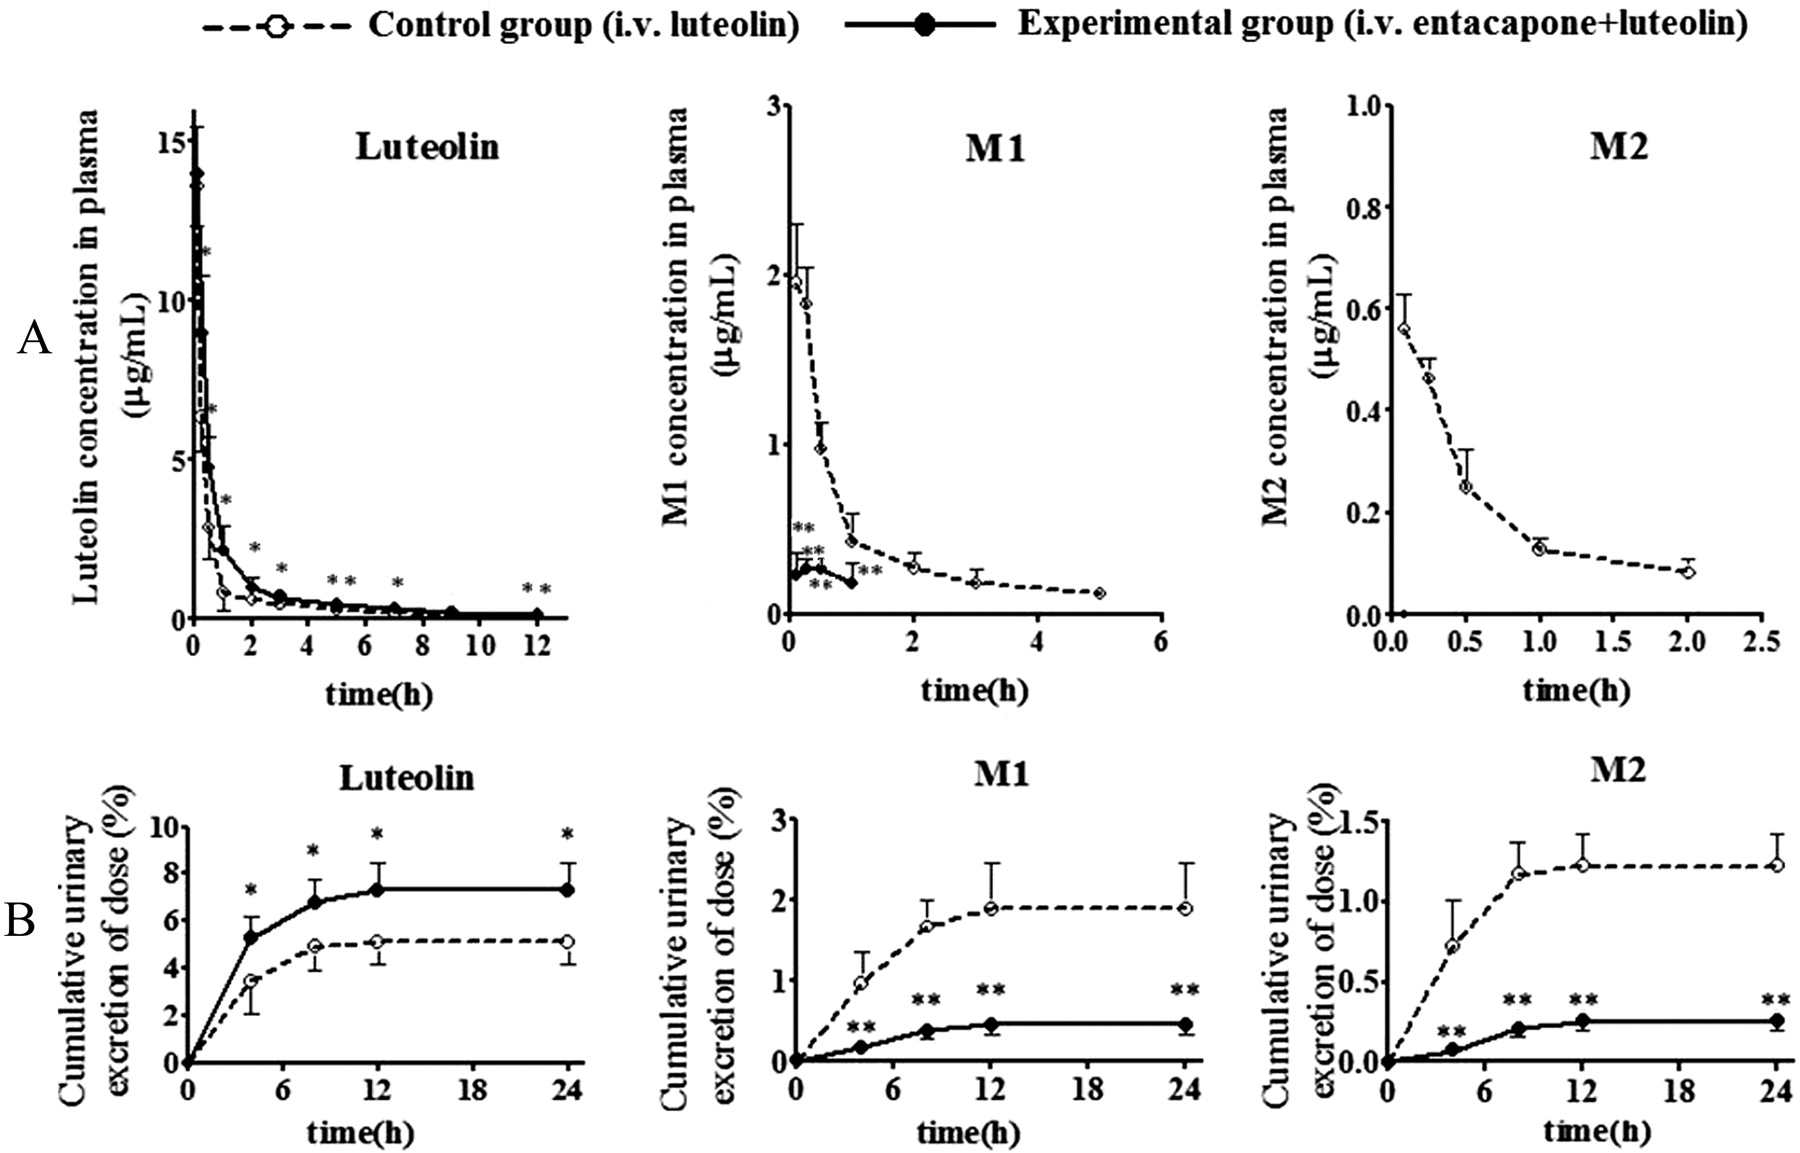
Plasma concentration-time curves (A) and urinary excretion-time profiles (B) of luteolin and metabolites after intravenous administration of 6.5 mg/kg luteolin to vehicle-treated (– – –, control group) or entacapone-treated (——, experimental group) rats. Values are expressed as the mean ± S.D. (n = 5). Data between control and experiment groups were compared with Student's t test (unpaired, two-tailed): *, P < 0.05; **, P < 0.01.
Pharmacokinetics parameters of luteolin after intravenous administration of 6.5 mg/kg luteolin to vehicle-treated or entacapone-treated rats
Data are expressed as the mean ± S.D. n = 5. Vehicle: 20% hydroxypropyl-β-cyclodextrin (w/v) containing 5% glucose (w/v). Both entacapone and luteolin for intravenous administration were dissolved in this vehicle.
Pharmacokinetic parameters of M1 and M2 after intravenous of 6.5 mg/kg luteolin to rats
Data are expressed as the mean ± S.D. n = 5.
Excretion of M1, M2, and Luteolin in Rat Urine.
After intravenous administration of luteolin to rats, luteolin and its two methylated metabolites were detected in rat hydrolyzed urine, and the cumulative excretion did not increase noticeably after 12 h (Fig. 5B). In the control group, the cumulative excretion of luteolin, M1, and M2 in 24-h urine samples was 5.12, 1.92, and 1.22% of the dose, respectively; hence, the total methylated metabolites were 3.14% of the dose, which was approximately half of the luteolin excreted in urine. In the entacapone-treated group, the total excretion of luteolin increased to 7.32% of the dose, whereas the total excretion of M1 and M2 decreased to 0.451 and 0.254% of dose, respectively. The ratio of M2/M1 in the urine collected in each period (0–4, 4–8, 8–12, and 12–24 h) in the two groups was approximately 0.71, which was in line with the results from plasma.
Stability of M1 and M2 in Rat Microsomes.
In the in vitro experiment, there was a preference for the formation of M2 over M1. In contrast, the concentrations of M1 were significantly higher than those of M2 in vivo in both rat plasma and urine after an intravenous dose of luteolin. The data suggest that M1 and M2 might be converted back to luteolin in vivo, especially in the liver. To confirm this deduction, an experiment was conducted using rat liver microsomes, and the result demonstrated that M1 and M2 could be demethylated by the phase I enzymes and converted back to luteolin. However, the amount of luteolin formed from M2 was approximately 2-fold higher than that formed from M1 (Fig. 6B), and this finding might suggest that M1 was more stable than M2 in rat microsomes (Fig. 6A).

Phase I metabolism of M1 and M2 in rat microsomes. A, remaining M1 and M2 after incubation for 10 and 30 min. B, luteolin demethylated from M1 and M2 after incubation for 10 and 30 min. The initial concentration of M1 or M2 was 10 μM. Values are expressed as the mean ± S.D. (n = 3). Data between the two groups were compared with Student's t test: *, P < 0.05; **, P < 0.01.
Discussion
In the present study, two metabolites [M1 (chrysoeriol) and M2 (diosmetin)] were identified in rat urine after intravenous administration of luteolin (Fig. 1). This is the first time that the two methylated metabolites in rats were clearly identified and enzymatically characterized. We may speculate that the 3′- or 4′-hydroxyl of luteolin is subjected to methylation based on its structure; however, this speculation has not been confirmed. Because the 3′- and 4′-methylated metabolites of luteolin have similar partition coefficients, it was hard to separate them in the chromatography system, and this might be the reason that only one methylated metabolite was reported in the previous studies of luteolin (Gradolatto et al., 2004). In addition, the two methylated metabolites could be further metabolized by uridine diphosphate glucuronosyltransferases or sulfotransferases in vivo, which made it difficult for them to be identified and quantitated. To simplify the analysis of methylation, samples, such as blood and urine, were hydrolyzed in the preparation before HPLC analysis, with which total methylation (conjugated and free forms) was assayed.
COMT is a phase II enzyme that is responsible for O-methylation and that is involved in the inactivation of the catecholamine neurotransmitters, such as dopamine, epinephrine, and norepinephrine. COMT introduces a methyl group to the catechol ring, which is donated by a cosubstrate, S-adenosylmethionine. Luteolin has a catechol ring and was identified as a substrate of COMT in rat in the present study. It is known there are two isoforms of COMT from one gene in mammals, membrane-bound COMT and soluble COMT. In our study, the rat tissue homogenates containing both membrane-bound COMT and soluble COMT were used in the kinetic study; thus, the Km and Vmax for M1 and M2 were all apparent parameters.
In our in vitro study, COMT showed a preference in methylation of 4′-hydroxyl luteolin over that of 3′-hydroyxl luteolin in all rat tissues investigated, with a 4′/3′ ratio of approximately 2.5 in Vmax/Km (Table 1). In fact, regioselectivity of the COMT reaction was previously reported for compounds such as l-dopa, dopamine, and quercetin; however, the 3-hydroxyl (the 3- and 4-positions in catechol are equivalent to the 3′- and 4′-positions in luteolin) was preferentially methylated in these substrates (Zhu et al., 1994; Lotta et al., 1995; de Boer et al., 2005), because rat soluble COMT was crystallized, and the critical atomic structure was described in detail (Vidgren, 1998). Regioselectivity of methylation could be further explained by the protein-substrate interaction. According to the molecular dynamic simulation studies (Lau and Bruice, 1998), the catechol ring displays a tilt of approximately 30° compared with the active site of COMT, which directs the substituent at the 1-position of catechol ring (Fig. 1, equivalent to the 1′-position in luteolin) into a hydrophobic pocket. Thus, hydrophobic substituents accommodated in this pocket have a preference for 4-O-methylation, whereas polar substituents repelled by this hydrophobic pocket make 3-O-methylation favorable. According to this hypothesis, methylation of l-dopa, dopamine, and quercetin would be preferred to 3-hydroxyl in the catechol because they are relatively polar with the calculated logP (ChemOffice 2004 software) of substituents −2.83, −0.32, and −0.57, respectively, whereas a preferential 4-O-methylation of catechol (4′-O-methylation in luteolin) will take place on luteolin because of its relative hydrophobicity with the calculated logP value of 0.6.
An unexpected finding was that the concentration of 3′-O-methylated luteolin (chrysoeriol) was significantly higher than that of 4′-O-methylated luteolin (diosmetin) in plasma and urine after intravenous dosing of luteolin to rats, contradictory to the in vitro result. Such different regioselectivities of O-methylation by COMT in in vivo versus in vitro conditions were previously reported for other substrates but not clearly explained (Palma et al., 2003). We supposed that further metabolism might cause different degradation of each metabolite (Palma et al., 2003). For example, some cytochrome P450s, such as CYP1A and CYP2C, selectively demethylate the 4-O-methyl (Busse et al., 1995; Androutsopoulos et al., 2010), which may result in accumulation of 3-O-methylation in vivo. The present study indicated that diosmetin (4′-O-methylation of luteolin) was more unstable than chrysoeriol (3′-O-methylation of luteolin) and the demethylation of diosmetin was significantly faster than that of chrysoeriol in rat microsomal phase I metabolism (Fig. 6). However, the demethylation only explained approximately 39% of reduced substrates (in a 30-min reaction), and other metabolism pathways for the remaining 61% were still to be disclosed. It is proposed that luteolin may indeed be methylated with a preference for 4′-O-methylation over 3′-O-methylation, but the subsequent metabolic pathways preferentially metabolized 4′-O-methylated luteolin, which led to the apparent preference for 3′-O-methylation over 4′-O-methylation in vivo in rat.
COMT is widely distributed throughout the organs of the body in mammals. This result is consistent with our preliminary study that methylation of luteolin was detected in all incubations with rat tissue homogenates that were investigated, including liver, kidney, small intestine, lung, erythrocyte, brain, spleen, and heart. The first five tissues were selected for further study because of their significant role in metabolism in vivo. The in vitro study revealed that liver showed the highest COMT activity to luteolin, followed by the kidney, small intestine, lung, and erythrocyte. Therefore, the liver is considered to play the major role in methylation of luteolin in rats. However, the contribution of other tissues should not be neglected because of the wide distribution of COMT in nonliver tissues. For example, erythrocytes display relatively low COMT activity, but they compose the majority of the blood and drugs are exposed to erythrocytes for a relatively long time, which indicates a potential contribution to pharmacokinetics of catechol compounds. In a recent study, the platelet was reported to have COMT activity (Wright et al., 2010), which might mediate the methylation of luteolin in vivo. Although the small intestine may play a minor role in methylation of luteolin when luteolin is intravenously administrated to rats, COMT will methylate oral drugs once absorbed into the enterocytes. Almost all of these tissues are able to methylate luteolin in vivo; therefore, the methylated metabolites detected in plasma or urine may result from not only liver but also other nonliver tissues.
Because the catechol structure is always associated with many biological activities, such as antioxidant activity and as a free radical scavenger (Heim et al., 2002), it is essential to study whether the pharmacodynamics of luteolin will be influenced by COMT. Of interest, it was reported that some catechol-containing flavonoids, such as luteolin and quercetin, displayed mutagenic activity in vitro (Rueff et al., 1995), but in fact they did not play this role in vivo because of wide methylation in the body (Zhu et al., 1994). On the other hand, the metabolites (chrysoeriol and diosmetin) of luteolin not only possessed many biological activities, as did luteolin, but also showed specific activities (Hsu and Kuo, 2008; Cha et al., 2009; Liu et al., 2009). Thus, it is more complex to study the pharmacodynamics of luteolin in vivo when methylation occurs, and we should distinguish the effects from luteolin and metabolites in mechanism studies.
A typical treatment is to use a COMT inhibitor to prolong the elimination half-life of l-dopa in Parkinson's disease (Piccini et al., 2000), and the nitrocatechol COMT inhibitors, entacapone and tolcapone, are widely used in clinical therapy. A further point of concern is to discover completely new COMT inhibitors without a nitrocatechol structure, which possibly is associated with some side effects (Männistö and Kaakkola, 1999). Some flavonoids, such as quercetin and tea catechins, were reported to efficiently decrease COMT activity, and might be potential COMT inhibitors (Lu et al., 2003; Singh et al., 2003). In our current study, luteolin also showed a relatively high affinity for COMT; thus, it is essential to verify the inhibitory role of luteolin on COMT in further studies.
In conclusion, the present study identified two methylated metabolites of luteolin both in vitro and in vivo and characterized the enzymology of the methylation of luteolin in rat tissue homogenates. Regioselectivity of methylation of luteolin revealed the reaction mechanism of COMT, and different regioselectivities of the O-methylation of luteolin in in vivo versus in vitro conditions could be explained by further metabolism. Moreover, the contribution of methylation to disposition of luteolin in rat was revealed, and COMT was another crucial phase II enzyme for luteolin, which indicates a potential COMT-based luteolin-drug interaction. Because the methylated metabolites (chrysoeriol and diosmetin) of luteolin have their own pharmacological effects, it is essential to take these metabolites into consideration when we study the pharmacological mechanism of luteolin in vivo.
Authorship Contributions
Participated in research design: Z. Chen, Zeng, and Jiang.
Conducted experiments: Z. Chen and M. Chen.
Contributed new reagents or analytic tools: Z. Chen, Pan, Sun, and Li.
Performed data analysis: Z. Chen, Pan, Sun, Li, Zeng, and Jiang.
Wrote or contributed to the writing of the manuscript: Z. Chen, M. Chen, Li, and Jiang.
Footnotes
The work was supported by the National Major Special Project for Science and Technology Development of the Ministry of Science and Technology of China [Grant 2009ZX09304-003]; and the Bureau of Zhejiang Traditional Chinese Medicine, China [Grant 2007ZA012].
Article, publication date, and citation information can be found at http://dmd.aspetjournals.org.
doi:10.1124/dmd.110.037333.
-
ABBREVIATIONS:
- COMT
- catechol-O-methyltransferase
- HPLC
- high-performance liquid chromatography
- DAD
- diode array detector
- MS/MS
- tandem mass spectrometry
- MRT0–t
- mean residence time from 0 to t postdose
- AUC0–t
- area under the plasma concentration versus time curve from 0 to t postdose
- AUC0–∞
- area under the plasma concentration versus time curve from 0 to infinity.
- Received November 18, 2010.
- Accepted January 5, 2011.
- Copyright © 2011 by The American Society for Pharmacology and Experimental Therapeutics


