


Abstract
The aim of the current study was to evaluate the accuracy of allometric scaling methods for drugs metabolized by UDP-glucuronosyltransferases (UGTs), such as ketoprofen, imipramine, lorazepam, levofloxacin, zidovudine, diclofenac, furosemide, raloxifene, gemfibrozil, mycophenolic acid, indomethacin, and telmisartan. Human plasma clearance (CL) predictions were conducted from preclinical in vivo data by using multiple-species allometry with the rule of exponents and single-species allometric scaling (SSS) of mice, rats, monkeys, or dogs. Distribution volume at a steady state (Vss) was predicted by multiple-species allometry or SSS of Vss. Oral plasma clearance (CLpo) was calculated under the assumption that Fa × Fg was equivalent across species. Each of the results was compared with the observed parameter calculated from the clinical data after intravenous or oral administration. Multiple-species allometry and SSS of mice, rats, and dogs resulted in a similar accuracy of CL and CLpo predictions. Monkeys tended to provide the most accurate predictions of human CL and CLpo. The ability to predict the half-life, which was determined from CL and Vss predictions, was more accurate in SSS of rats and monkeys. The in vivo fraction metabolized by glucuronidation (fm,UGT) in bile duct-cannulated monkeys was relatively similar to that of humans compared with other animal species, which likely contributed to the highest accuracy of SSS prediction of monkeys. On the basis of the current results, monkeys would be more reliable than other animal species in predicting human pharmacokinetics and fm,UGT for drugs metabolized by UGTs.
Introduction
Glucuronidation is an important reaction in the metabolism of drugs. UDP-glucuronosyltransferases (UGTs) are primarily involved in the conjugation of metabolites from oxidation reactions. However, if a suitable electrophilic acceptor group is present, UGTs can also conjugate drugs directly without any prior oxidation step. Recently, there has been an increasing awareness of the importance of glucuronidation, especially in drug development (Williams et al., 2004). Therefore, the prediction of human pharmacokinetics (PK) from both oxidative and conjugative preclinical metabolism data is an important goal in the drug discovery and development process; ultimately, these processes will also allow researchers to choose the best drug candidates for clinical study and to minimize risk to participants during first-in-human studies.
Several approaches have been developed for providing quantitative predictions of human PK and have been increasingly integrated into all stages of the drug research process (Shibata et al., 2002; Soars et al., 2002; Hosea et al., 2009). These predictive approaches typically use either empirical (e.g., animal in vivo preclinical data) or mechanistic (using in vitro humans tissue such as microsomes or hepatocytes) methods. However, prediction of clearance (CL) from microsomal in vitro data has shown a general trend toward underprediction (Kilford et al., 2009), and studies reported a 10- to 30-fold underprediction of CL (Miners et al., 2006). Allometric scaling is widely used in predicting human CL on the basis of animal data. Because prediction errors are commonly observed in the practical application of this approach, various modifications to allometric scaling have been proposed (Ward and Smith, 2004; Tang and Mayersohn, 2005; Tang et al., 2007). Hosea et al. (2009) demonstrated that allometric scaling from single-species allometric scaling (SSS) would be just as successful as full allometric scaling using multiple species of not only compounds cleared almost exclusively by cytochrome P450 (P450)-mediated pathways, but also those compounds by non–P450-mediated pathways. However, the accuracy of allometric scaling methods for human PK prediction of UGT substrates from preclinical in vivo data is still unknown.
The aim of the current study was to evaluate the accuracy of allometric scaling methods for drugs metabolized by UGTs. We conducted PK studies by using mice, rats, monkeys, and dogs for 12 marketed drugs that are directly conjugated with glucuronic acid. Of the 12 marketed drugs, 8 were acids, 2 were carbinol glucuronides, 1 was an ether glucuronide, and 1 formed an N-glucuronide. These drugs are directly conjugated with glucuronic acid and attempt to model both Phase 1 oxidation followed by Phase 2 conjugation, which adds another dimension of complexity. The choice of test drugs was influenced by what human data were available in the literature; however, UGT substrates with a percentage of direct glucuronidation reported to be more than 50% were selected, such as ketoprofen, lorazepam, zidovudine, raloxifene, and mycophenolic acid. In addition, drugs that were directly conjugated with glucuronic acid by human liver microsomes or hepatocytes were also selected. Species differences are common in drug glucuronidation. For example, glucuronidation is a minor pathway for zidovudine elimination in rats (de Miranda et al., 1990). Therefore, it is important to compare the percentage clearance via glucuronidation of each drug in the various test species. Human PK parameters were predicted by multiple-species allometry with the rule of exponents (ROE) and SSS of each animal species. Then, each of the results was compared with the observed values published by literatures. In addition, the in vivo fraction metabolized by glucuronidation (fm,UGT) of the gallbladder- or bile duct-cannulated animals were compared with that of humans. This assessment provided important information about the predictability of the in vivo fm,UGT, the potential relevance of enterohepatic circulation, UGT genetic polymorphism, and UGT-mediated clinical drug-drug interactions.
Materials and Methods
Test Compounds.
Ketoprofen, imipramine hydrochloride, diclofenac sodium salt, indomethacin, and telmisartan were purchased from Sigma-Aldrich (St. Louis, MO). Lorazepam, zidovudine, and mycophenolic acid were obtained from Wako Pure Chemical Industries (Osaka, Japan). Levofloxacin hydrochloride, furosemide, and gemfibrozil were purchased from LKT Labs (St. Paul, MN), and raloxifene was obtained from Toronto Research Chemicals Inc. (North York, ON, Canada). All other chemicals were of analytical grade and commercially available.
Preclinical Data.
All animal experiments were carried out according to the guidelines provided by the Institutional Animal Care and Use Committee of Daiichi Sankyo Co., Ltd. (Tokyo, Japan). Plasma protein binding data (n = 2) were generated by using the ultracentrifugation method (Nakai et al., 2004). To improve throughput in preclinical in vivo PK studies, cassette dosing was used (dosing formulation A: ketoprofen, imipramine, lorazepam, and levofloxacin; dosing formulation B: zidovudine, diclofenac, furosemide, and raloxifene; and dosing formulation C: gemfibrozil, mycophenolic acid, indomethacin, and telmisartan). Grouping of compounds in the cassette dosing was determined by the electrospray ionization mode of each analysis. All compounds were dissolved in 92 mg/ml SBE-β-CyD (CyDex Pharmaceuticals, Inc., Terrace Lenexa, KS) and administered to male CD mice (Charles River Laboratories Japan, Inc., Kanagawa, Japan), male Sprague-Dawley rats (Charles River Laboratories Japan, Inc.), male cynomolgus monkeys (HAMRI Co. Ltd., Ibaraki, Japan), and male beagle dogs (Nosan Corporation, Kanagawa, Japan) either intravenously (0.2 mg/kg; n = 2) or orally (2 mg/kg as solution; n = 3) under a fasted condition. A lower dose was used to reduce the potential risk for drug-drug interactions by cassette dosing. All plasma samples were analyzed individually for the parent drug by liquid chromatography/tandem mass spectrometry (LC/MS/MS). Parameter estimates of plasma CL and distribution volume at steady state (Vss) were obtained from noncompartmental analysis by using WinNonlin (Pharsight, Mountain View, CA) of individual plasma concentration-time profiles obtained after intravenous dosing. Each CL was converted to blood CL (CLB) by correcting with the blood-to-plasma concentration ratio (RB) determined from in vitro methods (n = 3) (Izumi et al., 1996). Oral bioavailability (F) was estimated by the dose-adjusted area under the concentration-time curve ratio after single oral and intravenous administration.
Prediction Methodologies.
Methods for the prediction of human CL, Vss, F, oral plasma clearance (CLpo), and t1/2 used in the analysis are shown below (Hosea et al., 2009). Human CL and Vss were predicted using allometry of CLB with the ROE (eq. 1), the SSS of CLB (eq. 2), the allometry of Vss (eq. 3), and the SSS of Vss, which were estimated by assuming that the human volume would be identical to that in one of the preclinical animals.
 where, a and b are the coefficient and exponent of the allometric equation, respectively, and W is the body weight. In eq. 1, N = 1, maximal life span potential or brain weight, when b is derived from simple allometry = ≤0.7, 0.71 to 1.0, and >1.0, respectively.


Human F was predicted by eq. 4 under the assumption that Fa × Fg was the same between human and animal species, and CLh was equal to CLB. Fa and Fg are fraction-absorbed and fraction-escaping gut-wall elimination, respectively, and CLh and Qh are the hepatic CL and hepatic blood flow rate, respectively.
CLpo,human was calculated as the quotient of the individual predicted CL and predicted F (eq. 5) after the conversion of CLB,human to CLhuman.


Human t1/2 was predicted from the combination of individual CL and Vss predictions from the same species (eq. 6).

Determination of the In Vivo fm,UGT.
After a single intravenous administration (0.2 mg/kg), bile and urine were collected up to 24 h from gallbladder-cannulated mice or bile duct-cannulated rats, monkeys, or dogs in the presence of approximately 1% formic acid as the final concentration. The sum of the parent drug and glucuronide concentration in bile and urine was analyzed as the parent drug by LC/MS/MS after an overnight treatment of the samples with β-glucuronidase (Sigma-Aldrich) after neutralization by NaOH. The concentration of glucuronide was calculated by subtracting the parent drug concentration in the sample without treatment of β-glucuronidase. fm,UGT was obtained from eq. 7.
 where Cbile, Curine, Vbile, and Vurine are the concentrations of glucuronide excreted in bile and urine (micromoles per milliliter) and the volume of bile and urine samples (milliliter), respectively.
Analytical Methods.
The LC/MS/MS systems used consisted of an Alliance 2795 (Waters, Elstree, UK) with a Micromass Quattro Premier mass spectrometer (Waters) or Prominence LC-20A system (Shimadzu, Kyoto, Japan) with API 4000 (Applied Biosystems/MDS Sciex, Foster City, CA). Varying gradients of four mobile phases were used, and the compositions were 1) 5 mM ammonium acetate and 0.2% formic acid with 5% acetonitrile, 2) 5 mM ammonium acetate and 0.2% formic acid with 95% acetonitrile, 3) 5 mM ammonium acetate with 5% acetonitrile, and 4) 5 mM ammonium acetate with 95% acetonitrile. A CAPCELL PAK MG II C18 column [3 μm, 20 i.d. × 50 mm (Shiseido, Tokyo, Japan)] was used for chromatographic separation of analytes at 40°C. The flow rate was 0.5 ml/min. Additional analytical parameters are described in Table 1. The ion chromatograms were integrated and quantified, based on analyte/internal standard peak-area ratios by using Micromass QuanLynx software (Waters) or the Analyst data system (Applied Biosystems/MDS Sciex). Phenacetin or niflumic acid was used as the internal standard for the analysis in the positive ion mode, and furosemide or niflumic acid was used in the negative ion mode.
Summary of analytical methods
Clinical Data.
Clinical PK parameters and fm,UGT were obtained from the literature. The in vivo estimates of fm,UGT were obtained from the amount of glucuronide excreted in the urine; potential contribution of the glucuronide metabolites excreted in bile/feces was not accounted for because of a limited availability of such data.
Results
Preclinical Parameters.
The unbound fraction of plasma protein binding (fu) as determined by ultracentrifugation and RB for all compounds are summarized in Table 2. The fu ranged from 0.002 to 0.922, and the RB ranged from 0.46 to 2.13.
Summary of unbound fraction of plasma protein binding and blood-to-plasma concentration ratio
n = 2–3.
Mean noncompartmental PK parameter estimates of plasma CL, Vss, and F determined from in vivo PK studies conducted in mice, rats, monkeys, and dogs are summarized in Table 3. Imipramine, lorazepam, zidovudine, and raloxifene represented relatively large plasma CL in preclinical animals. Vss values for imipramine, lorazepam, levofloxacin, zidovudine, raloxifene, gemfibrozil, mycophenolic acid, indomethacin, and telmisartan were more than 1 l/kg in some animals. Imipramine, lorazepam, and raloxifene demonstrated low F in preclinical animals.
Summary of preclinical in vivo PK parameters
n = 2–3.
Comparison of Prediction Methods.
Table 4 summarizes the predicted and observed values of the PK parameters for the 12 drugs in humans. Prediction methods, including allometric scaling with the ROE using multiple species and SSS of mice, rats, monkeys, and dogs, were applied to the preclinical data sets (Tables 2 and 3) to predict human CL, Vss, and F. These primary PK parameters were used to estimate CLpo and t1/2, and predicted parameters were compared with the actual values observed in humans. The percentage of compounds for which the PK parameters were predicted within 2- to 4-fold of the actual values was determined for each method. Multiple-species allometry with the ROE and SSS of mice, rats, and dogs resulted in a similar percentage of compounds in which the CL and CLpo predictions fell within 3-fold of actual values (Table 4). The SSS of monkeys predicted human CL and CLpo within 2-fold of actual values for 58 and 50% and within 3-fold of actual values for 83 and 67%, respectively, resulting in the highest accuracy of all methods analyzed. When data from SSS of mice and rats were used (Figs. 1 and 2), a trend of underprediction for CL and CLpo was observed.
Observed and predicted values of human CL
All these values were quoted from the literature as follows: ketoprofen (Jamali and Brocks, 1990; Obach et al., 2008); imipramine (Shibata et al., 2002; Obach et al., 2008); lorazepam (Shibata et al., 2002); levofloxacin (Chien et al., 1997; Obach et al., 2008); zidovudine (Moore et al., 1995; Obach et al., 2008); diclofenac (Willis et al., 1979; Obach et al., 2008); furosemide (McCrindle et al., 1996; Obach et al., 2008); raloxifene (Heringa, 2003); gemfibrozil (Todd and Ward, 1988; Soars et al., 2002); mycophenolic acid (Bullingham et al., 1998); indomethacin (Alván et al., 1975; Cubitt et al., 2009); and telmisartan (Stangier et al., 2000b; Obach et al., 2008).
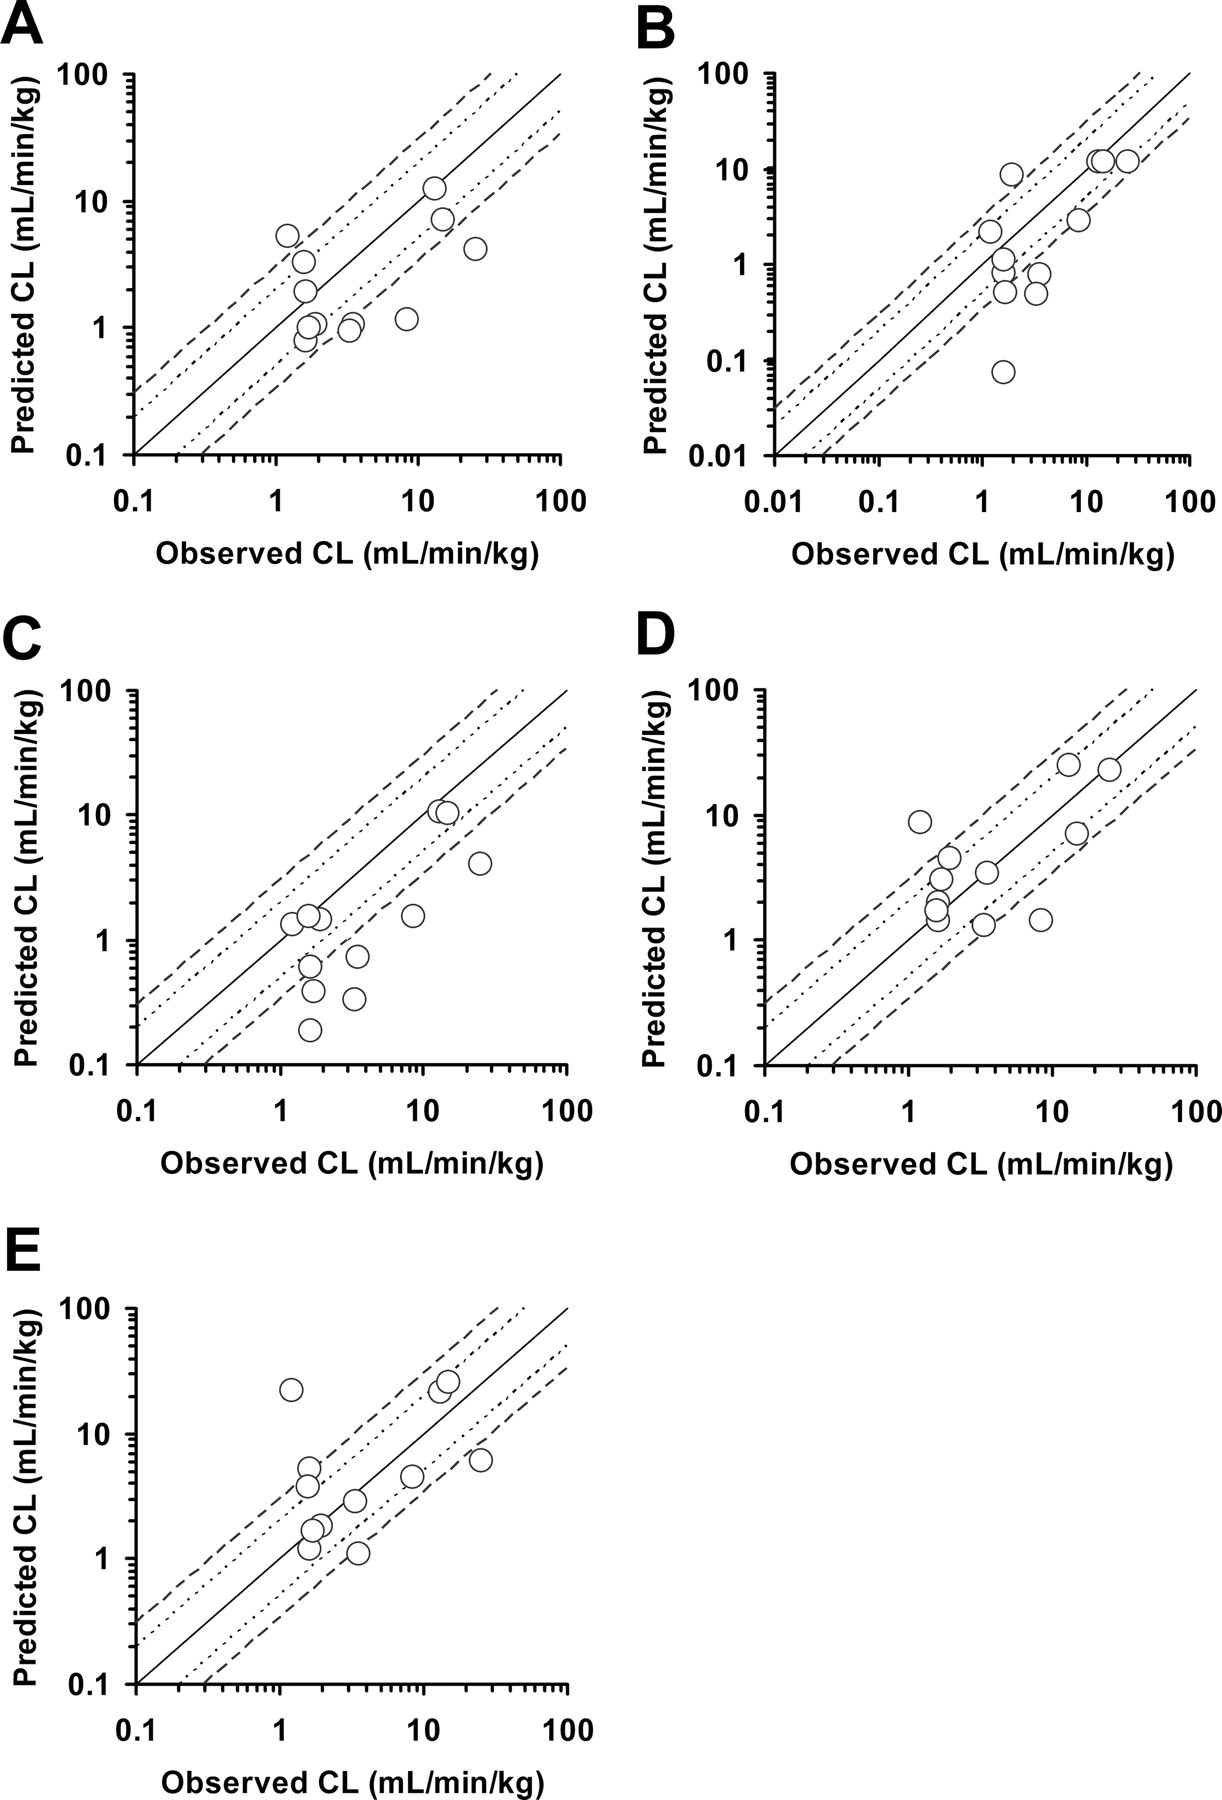
Predicted versus observed human plasma CL. Predictions are from allometry with the ROE (A) and SSS of mice (B), rats (C), monkeys (D), and dogs (E). The solid, dotted, and dashed lines represent the lines of identity and 2- and 3-fold identity, respectively.

Predicted versus observed human plasma CLpo. Predictions are from allometry with the ROE and Fa × Fg from monkeys (A) and SSS and Fa × Fg of mice (B), rats (C), monkeys (D), and dogs (E). In each SSS prediction (B–E), the product of Fa and Fg from the corresponding animal was used. The solid, dotted, and dashed lines represent the lines of identity and 2- and 3-fold identity, respectively.
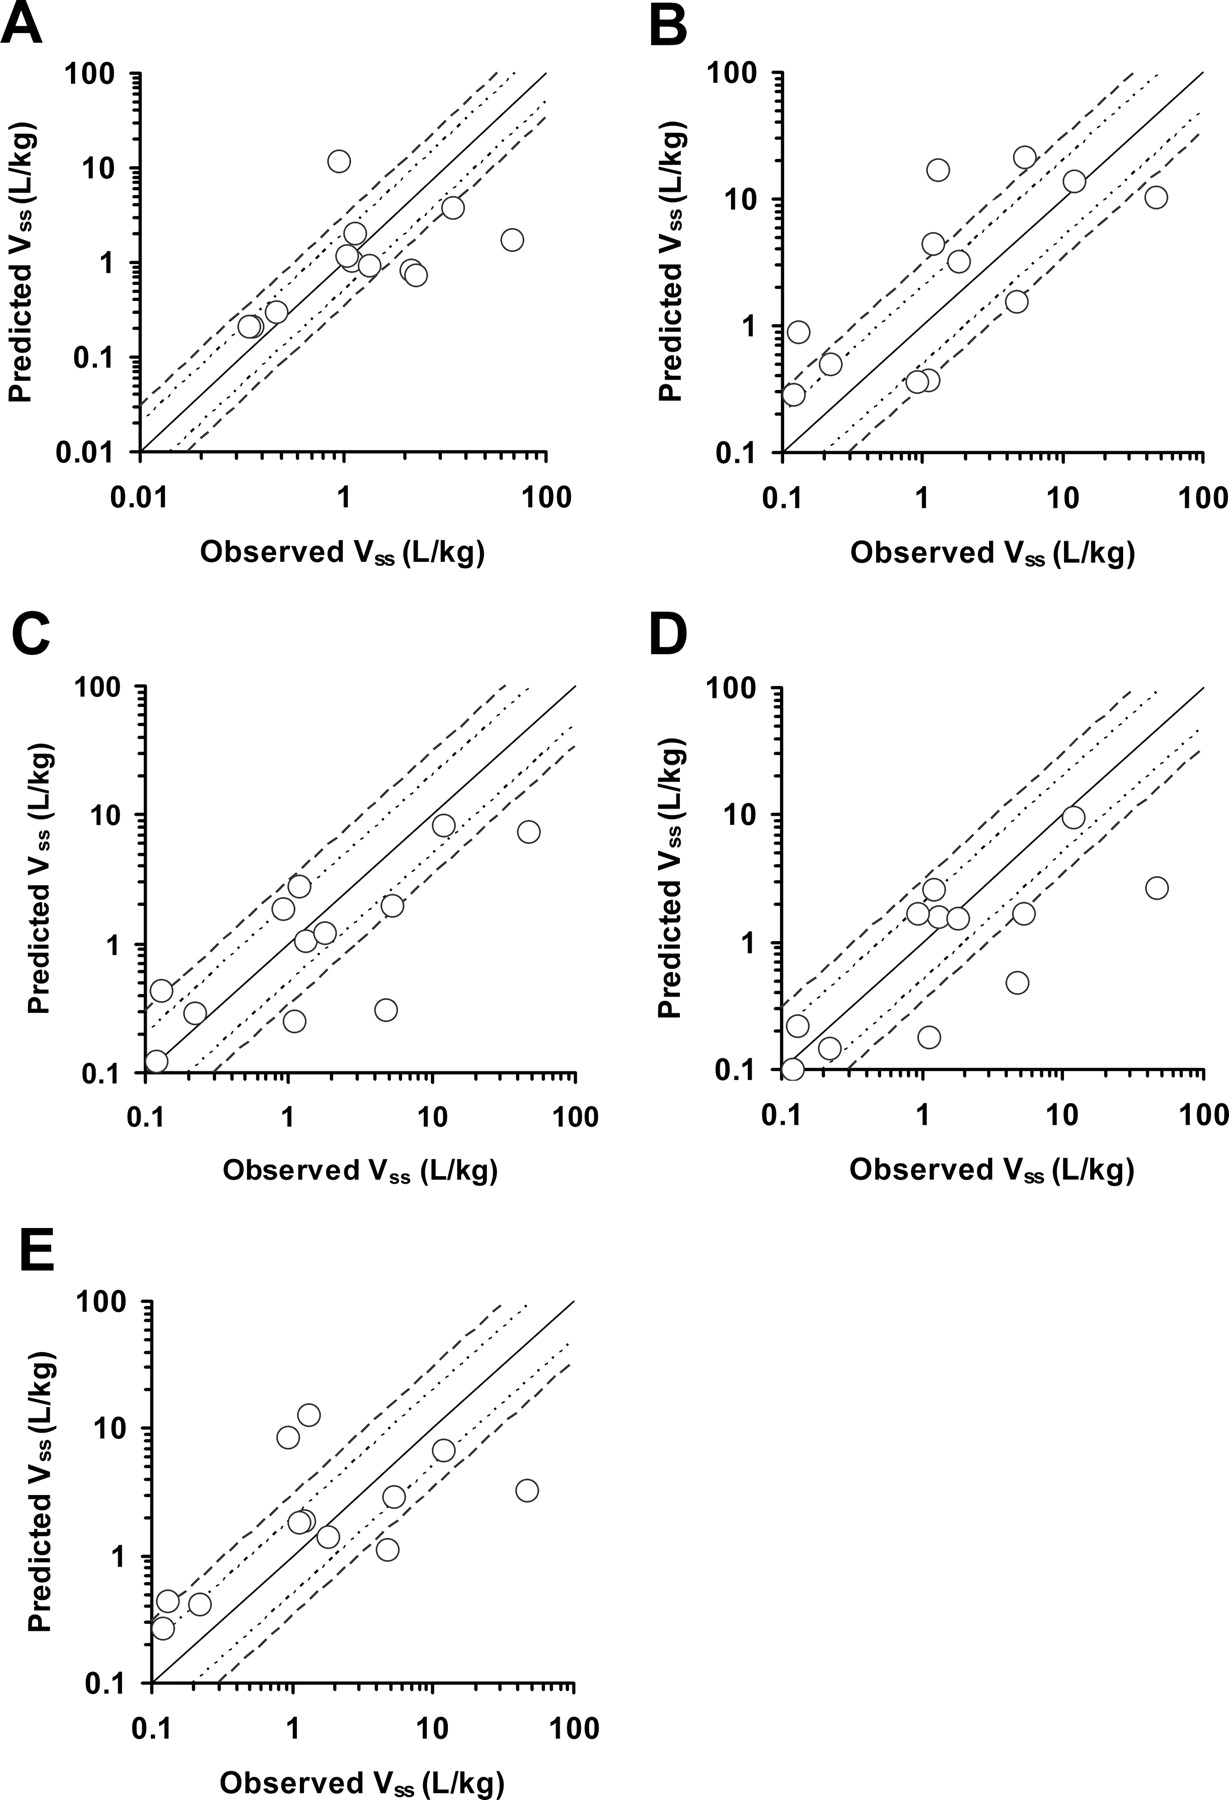
Predictions for Vss, multiple-species allometry, SSS of mice, rats, monkeys, and dogs resulted in 58, 17, 42, 58, and 50%, respectively, which fell within 2-fold prediction accuracy, and 67, 50, 67, 67, and 58%, respectively, which fell within 3-fold prediction accuracy (Fig. 3; Table 5). The ability to predict Vss within 3-fold prediction accuracy was similar between multiple-species allometry and SSS of each species. The accuracy of allometric scaling methods using unbound CL and unbound Vss tended to be less successful than those using CL and Vss (data not shown). Some fu values of test drugs were less than 0.01, which may decrease their predictability.

Predicted versus observed human Vss. Predictions are from allometry of Vss (A) and SSS of mice (B), rats (C), monkeys (D), and dogs (E). The solid, dotted, and dashed lines represent the lines of identity and 2- and 3-fold identity, respectively.
Observed and predicted values of human Vss and t1/2
All these values were quoted from the literature as follows: ketoprofen, imipramine, levofloxacin, zidovudine, diclofenac, furosemide, and telmisartan (Obach et al., 2008); lorazepam (Greenblatt et al., 1982); raloxifene (Heringa, 2003); gemfibrozil (Todd and Ward, 1988); mycophenolic acid (Bullingham et al., 1998); and indomethacin (Alván et al., 1975).
In the prediction for human t1/2, multiple-species allometry, SSS of mice, rats, monkeys, and dogs resulted in 42, 25, 42, 58, and 42%, respectively, which fell within 2-fold, and 50, 33, 67, 67, and 50%, respectively, which fell within 3-fold prediction accuracy (Fig. 4; Table 5). The ability to predict t1/2 within 3-fold prediction accuracy was more accurate in SSS of rats and monkeys.

Predicted versus observed human t1/2. Predictions are from allometry with the ROE for CL and allometry of Vss (A) and SSS of CL and Vss from mice (B), rats (C), monkeys (D), and dogs (E). The solid, dotted, and dashed lines represent the lines of identity and 2- and 3-fold identity, respectively.
Comparison of fm,UGT.
Although in vivo fm,UGT values in humans were estimated from only renal excretion in the literature, most of those values in preclinical animals, estimated from biliary and urinary excretion, were smaller than those in humans (Fig. 5; Table 6). fm,UGT values in monkeys were relatively similar to those of humans than to other animal species, which likely contributed to the highest accuracy of SSS prediction of monkeys. The median values of fm,UGT ratios (fm,UGT in animals/fm,UGT in humans) were within 2-fold identity in monkeys; however, they were smaller in other animal species.

Comparison of fm,UGT in each animal species. The dotted and dashed lines represent the lines of identity and the limits of 2-fold identity, respectively. The solid lines indicate the median value.
Comparison of fm,UGT in each animal species
Discussion
In the present study, we evaluated the accuracy of allometric scaling methods for drugs metabolized by UGTs. Human PK parameters predicted by multiple-species allometry with the ROE and SSS of mice, rats, monkeys, and dogs were compared with observed values reported in the literature. In the current analysis of CL and CLpo (Table 4), the prediction accuracy of multiple-species allometry with the ROE and SSS of rats, monkeys, and dogs was similar to that previously reported in which the compounds assessed were eliminated by various metabolic processes, including P450- and/or non-P450-mediated metabolism, active transport, and passive renal elimination (Tang et al., 2007; Hosea et al., 2009). Therefore, it is suggested that allometric scaling approaches could predict human PK of UGT substrates as accurately as compounds eliminated by various metabolic processes including P450, although the present data set was limited. The prediction of CL from in vitro data has shown a general trend toward underprediction for both P450 and UGT-mediated metabolism (Kilford et al., 2009), and studies reported 10- to 30-fold underprediction of CL (Miners et al., 2006). On the basis of the current results, allometric scaling approaches would seem to be more reliable than in vitro methods in predicting human CL values for drugs mainly metabolized directly by UGTs.
One key observation from this study is that the monkey is an important species for extrapolating CL and CLpo. In the present analysis for predicting human CL by SSS, a fixed allometric exponent of 0.75 was assumed, based on the fact that physiological factors (metabolic rate, tissue weight, blood flow rate, blood volume, passive renal CL, oxygen consumption, and so on) can be scaled among species (White and Seymour, 2005). The evaluation for the accuracy of allometric scaling methods demonstrated that the SSS of monkeys resulted in the highest accuracy of all methods with the prediction of CL and CLpo. In the drug discovery stage, species selection for PK investigation is driven by several factors, including the requisite species for preclinical efficacy and safety studies and an understanding of which species are likely to be most predictive of human PK. Although some debate still exists regarding the most appropriate species, it has been reported that monkeys tend to provide the most qualitatively and quantitatively accurate predictions of human CL. They also afford the least biased predictions than other species (Ward and Smith, 2004; Tang et al., 2007), supporting current results that the use of SSS of monkeys would be an efficient method to predict human CL of UGT substrates. In addition, fm,UGT values in monkeys were relatively similar to that of humans compared with other animal species (Fig. 5; Table 6), possibly suggesting that metabolic contribution may be involved in the accurate prediction by SSS of monkeys. From a simple perspective, this observation is unsurprising, given the phylogenetic proximity of humans to monkeys versus other species. Although human, rat, and mouse UGT genes have been identified, and preliminary drafts of the sequences of other mammalian genomes (chimpanzee, cow, dog, cat, sheep, and pig) have been published, it is difficult to identify orthologs across species because of their erroneous results from the use of gene and exon prediction software to define UGT exon/intron boundaries (Mackenzie et al., 2005). It is necessary to scrutinize the similarity in sequence and function of protein products of mammalian UGT genes. It has been reported that the multiple-species allometry and the SSS of each species resulted in a similar accuracy of the prediction of CL and CLpo, although the monkey method appeared to have better predictability than the other methods (Ward and Smith, 2004; Tang et al., 2007; Hosea et al., 2009). However, when data are used from the SSS of rats (Figs. 1 and 2), a trend of underprediction for CL and CLpo was observed. It may be explained by the species differences of metabolic activity, dominant enzyme isoforms, or enterohepatic circulation (Ruelius, 1978; Collins, 2001; Miles et al., 2005).
In contrast to CL scaling, Vss can generally be scaled with an allometric exponent of 1; therefore, a direct species scaling approach was applied in this analysis. This direct scalability of Vss is also physiologically consistent with allometric exponents associated with distributional factors such as organ weight and physiological volumes. In the current analysis, t1/2 tended to be less successfully predicted than previously reported in which the compounds were eliminated by various metabolic processes (Hosea et al., 2009). It is likely that the ability to predict Vss and t1/2 may prove problematic by species-specific components to the mechanism of distribution such as enterohepatic circulation and/or active transport. The existence of enterohepatic circulation makes the analysis of Vss and t1/2 considerably difficult, because the secondary peak on plasma time course makes the terminal phase too unstable to be extrapolated into infinite time. In contrast, CLpo also represented less predictability than CL, which is affected by F issues derived from the physicochemical property and metabolic stability in intestine and liver. In particular, the compounds with large CL and low F, such as imipramine, lorazepam, zidovudine, and raloxifene, tended to show a lower success rate in predicting CLpo. It is generally suggested that nonlinear PK, widely divergent or poor F in several animal species, could result in a greater possibility for misprediction of human CLpo. It was reported that the F of raloxifene was only 0.02 in humans, and the intestinal glucuronidation metabolism had more of an effect on the F of raloxifene than the hepatic glucuronidation metabolism (Heringa, 2003; Cubitt et al., 2009). In the current analysis, Fa × Fg values were calculated to be 1.00, 0.11, 0.01, 0, and 0.06 in mice, rats, monkeys, dogs, and humans, respectively, suggesting that in vivo animal PK studies, except in mice, could roughly predict potent glucuronidation metabolism in human intestine. Cubitt et al. (2009) reported that alamethicin-activated microsomes are useful for the assessment of intestinal glucuronidation in vitro and the prediction of glucuronidation CL by using raloxifene as a test compound. Therefore, a combination of in vivo and in vitro methods would be important to improve the human CLpo prediction. In real circumstances in the drug discovery and development process, it is crucial to optimize the predictions on the basis of inherent factors, including qualitative and quantitative metabolic profiles, involvement of uptake and efflux transporters, and prediction of F from a physicochemical property.
An increasing awareness of the importance of conjugation metabolism has led to a need for the incorporation of these pathways into drug CL prediction. In the present study, zidovudine, levofloxacin, and telmisartan showed dramatic differences of fm,UGT between humans and animals (Table 6). There are three possibilities to explain these differences: 1) species differences of glucuronidation, 2) stability of glucuronide, and 3) limited availability of human data. As previously mentioned, zidovudine is known to show species differences of glucuronidation between humans and preclinical animals (de Miranda et al., 1990; Collins, 2001). In addition, acyl glucuronides formed from carboxylic acid-containing drugs, such as ketoprofen, levofloxacin, diclofenac, furosemide, gemfibrozil, mycophenolic acid, indomethacin, and telmisartan, are unstable in physiological conditions, which could lead to the underestimation of the extent of glucuronidation in vivo (Sawamura et al., 2010). For example, fecal excretion of telmisartan consists of more than 90% of the dose composed mostly of the parent compound, although human liver microsomes and hepatocytes have demonstrated glucuronidation (Stangier et al., 2000a). The explanation for the underestimation of in vivo fm,UGT is that the glucuronide released into the gut lumen is cleaved by glucuronidase produced by the flora within the colon. In addition, the glucuronide itself can be a substrate of additional metabolism (Kochansky et al., 2005). In contrast, potential contribution of the glucuronide metabolites excreted in bile/feces was not accounted for because of limited availability. In fact, the glucuronide of levofloxacin in the common duct bile was detected at proportions between 0.9 and 36% in humans (Tanimura et al., 1992) but not in urine. fm,UGT in humans determined only from urinary excretion was used in this study, suggesting the potential risk to misread the species differences. However, most cases showed that fm,UGT in humans was higher than that in animals (Fig. 5); these cases suggested differences of fm,UGT in species, although it may not be an intrinsic comparison. fm,UGT in monkeys obtained in the present study was comparable with the published in vivo human fm,UGT values, showing an ability to estimate fm,UGT from monkey data. The estimation of in vivo fm,UGT by bile duct-cannulated monkeys could provide important information about the potential contribution of glucuronidation in humans by minimizing the underestimation of glucuronide, potential relevance of enterohepatic circulation, UGT genetic polymorphism, and UGT-mediated clinical drug-drug interactions.
In summary, the present study demonstrated that allometric scaling approaches are useful to estimate human PK of drugs metabolized by UGTs. In all instances, monkeys tended to provide the most accurate predictions of human PK and in vivo fm,UGT. These observations have major implications for lead optimization for drugs metabolized by UGTs and for predicting human PK from preclinical data.
Authorship Contributions
Participated in research design: Deguchi, Watanabe, Kurihara, Igeta, Suzuki, Hirouchi, and Iwasaki.
Conducted experiments: Deguchi, Watanabe, Igeta, Ikenaga, Fusegawa, Suzuki, Murata, Hirouchi, and Furuta.
Performed data analysis: Deguchi and Igeta.
Wrote or contributed to the writing of the manuscript: Deguchi, Watanabe, Kurihara, Iwasaki, Okazaki, and Izumi.
Footnotes
Article, publication date, and citation information can be found at http://dmd.aspetjournals.org.
doi:10.1124/dmd.110.037457.
-
ABBREVIATIONS:
- UGT
- UDP-glucuronosyltransferase
- CL
- clearance
- CLB
- blood clearance
- CLpo
- oral plasma clearance
- F
- oral bioavailability
- fm,UGT
- fraction metabolized by glucuronidation
- fu
- unbound fraction of plasma protein binding
- LC/MS/MS
- liquid chromatography/tandem mass spectrometry
- P450
- cytochrome P450
- PK
- pharmacokinetics
- RB
- blood-to-plasma concentration ratio
- ROE
- rule of exponent
- SSS
- single-species allometric scaling
- Vss
- distribution volume at steady state.
- Received November 29, 2010.
- Accepted January 31, 2011.
- Copyright © 2011 by The American Society for Pharmacology and Experimental Therapeutics


