


Abstract
In humans, the antimalarial drug chloroquine (CQ) is metabolized into one major metabolite, N-desethylchloroquine (DCQ). Using human liver microsomes (HLM) and recombinant human cytochrome P450 (P450), we performed studies to identify the P450 isoform(s) involved in the N-desethylation of CQ. In HLM incubated with CQ, only DCQ could be detected. Apparent Km and Vmax values (mean ± S.D.) for metabolite formation were 444 ± 121 μM and 617 ± 128 pmol/min/mg protein, respectively. In microsomes from a panel of 16 human livers phenotyped for 10 different P450 isoforms, DCQ formation was highly correlated with testosterone 6β-hydroxylation (r = 0.80; p < 0.001), a CYP3A-mediated reaction, and CYP2C8-mediated paclitaxel α-hydroxylation (r = 0.82; p < 0.001). CQ N-desethylation was diminished when coincubated with quercetin (20–40% inhibition), ketoconazole, or troleandomycin (20–30% inhibition) and was strongly inhibited (80% inhibition) by a combination of ketoconazole and quercetin, which further corroborates the contribution of CYP2C8 and CYP3As. Of 10 cDNA-expressed human P450s examined, only CYP1A1, CYP2D6, CYP3A4, and CYP2C8 produced DCQ. CYP2C8 and CYP3A4 constituted low-affinity/high-capacity systems, whereas CYP2D6 was associated with higher affinity but a significantly lower capacity. This property may explain the ability of CQ to inhibit CYP2D6-mediated metabolism in vitro and in vivo. At therapeutically relevant concentrations (∼100 μM CQ in the liver), CYP2C8, CYP3A4, and, to a much lesser extent, CYP2D6 are expected to account for most of the CQ N-desethylation.
Chloroquine (CQ1) is an antimalarial drug that has been used in the treatment and prophylaxis of malaria since the 1950s. In humans, the liver and kidneys contribute approximately equally to its body disposition (Frisk-Holmberg et al., 1983; Gustafsson et al., 1983; Ette et al., 1989). Following oral or i.v. administration, chloroquine is dealkylated into two main metabolites, N-desethylchloroquine (DCQ) and N-bis-desethylchloroquine (BDCQ) (Fig. 1). DCQ is rapidly detected in blood or plasma, its concentrations amounting to 20 to 50% of those of the parent (Gustafsson et al., 1983; Frisk-Holmberg et al., 1984). For BDCQ, plasma or blood concentrations never reach more than 10 to 15% of CQ levels (Frisk-Holmberg et al., 1983, 1984; Augustjins et al., 1992). Although CQ possesses cytochrome P450 (P450)-inhibiting properties, notably on CYP2D6 (Lancaster et al., 1990; Halliday et al., 1995; Masimirembwa et al., 1995), the enzymes catalyzing its N-dealkylation have never been identified.
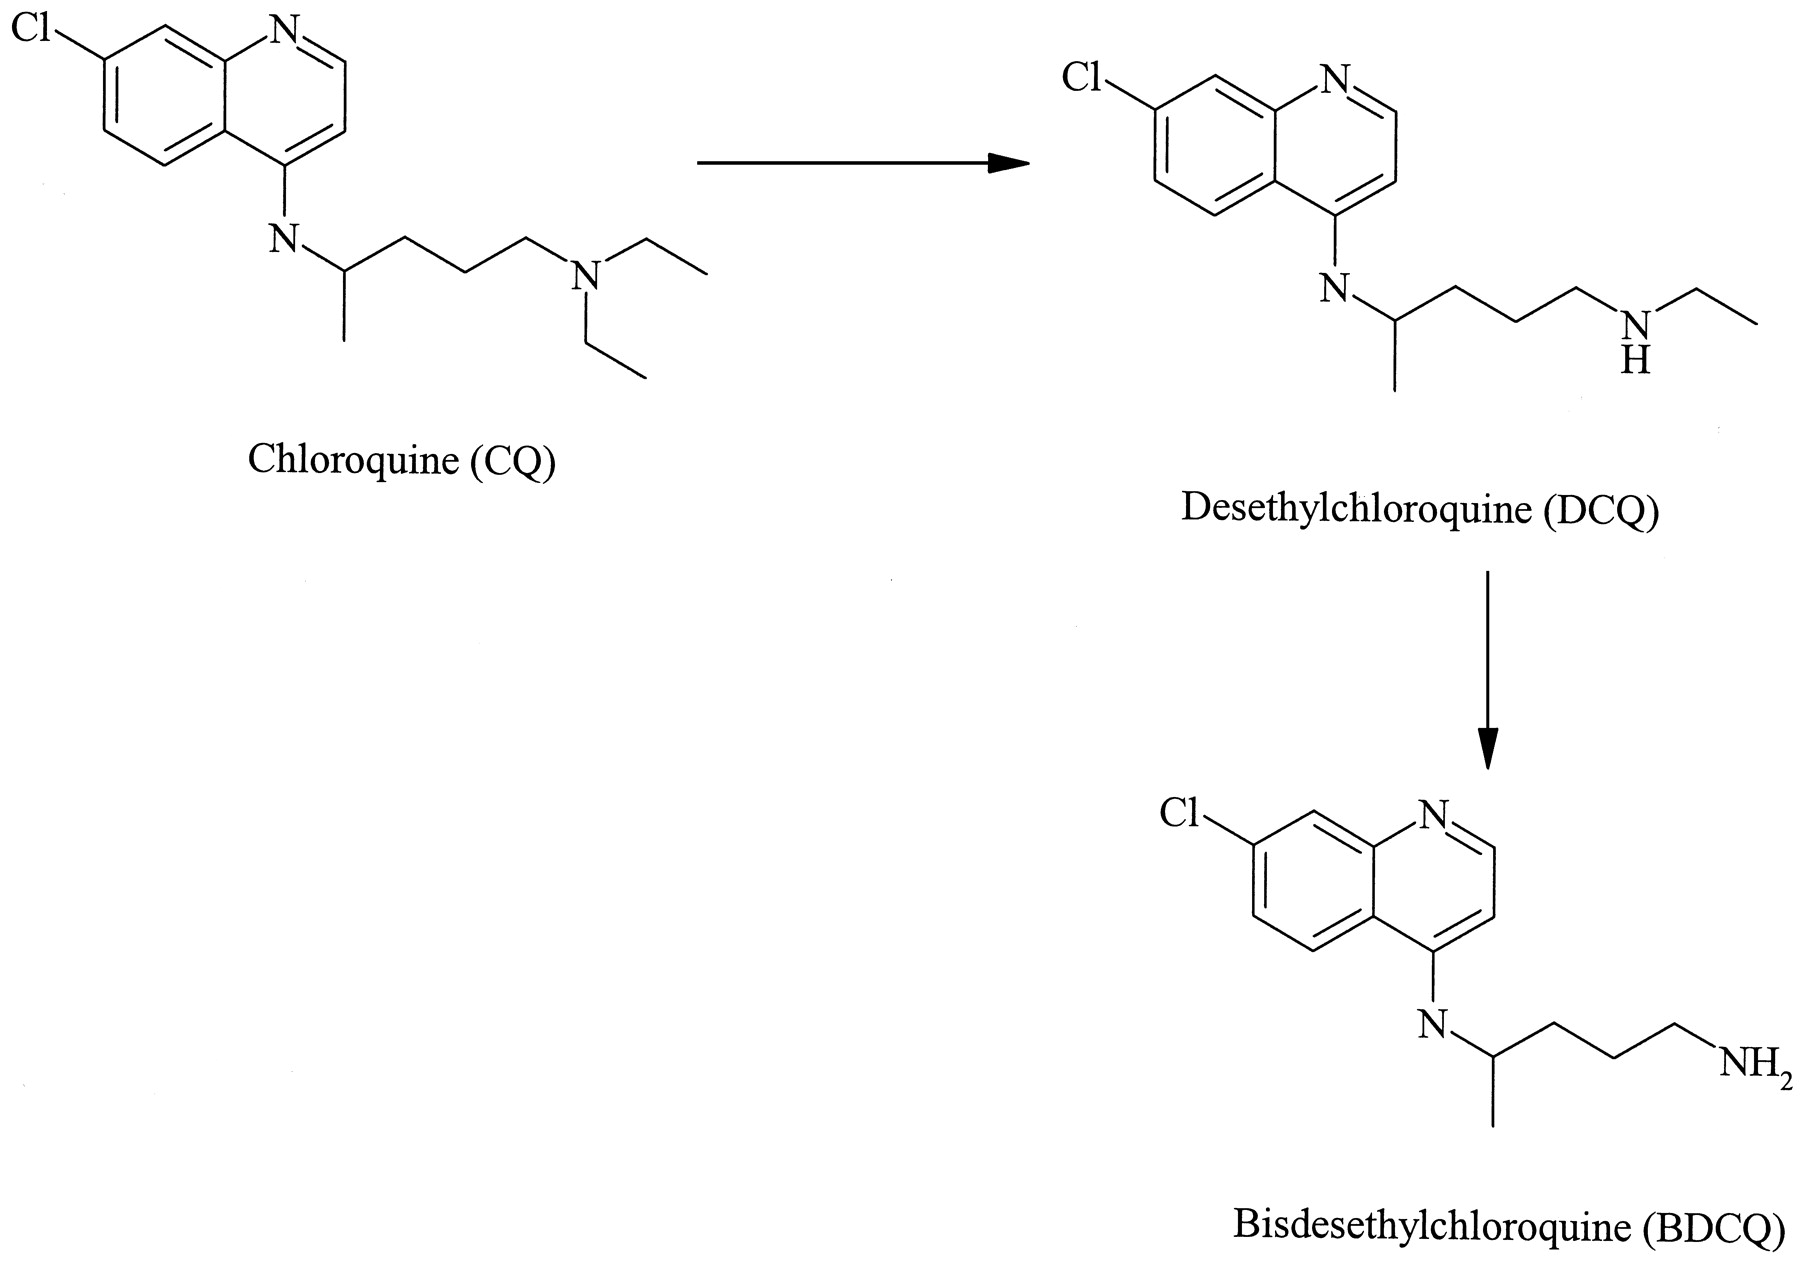
Chloroquine (CQ) and desethylchloroquine (DCQ) N-desethylase pathways in humans.
Distribution studies have shown that CQ is extensively sequestered in tissues, the liver, spleen, kidney, and lungs being the main repositories (Grundmann et al., 1971). Even if CQ plasma concentrations rarely exceed the micromolar range (0.25 ± 0.23 μM), liver concentrations may be several hundred times higher (McChesney et al., 1967; MacKenzie, 1983; Augustjins et al., 1992). In rats, liver to plasma ratios ranged from 209 to 541 (Adelusi and Salako, 1982).
All CQ indications entail long-term administration. For malaria prophylaxis and treatment, CQ may be given for several weeks (Ducharme and Farinotti, 1996). Against rheumatoid arthritis, maintenance doses are 7- to 20-fold greater (Maksymowych and Russel, 1987), and patients may take the drug for years to prevent disease progression. In view of its extremely long half-life (8.9–41 days), its extensive distribution, and its P450-inhibiting properties (see Ducharme and Farinotti, 1996, for review), CQ is likely to be implicated in clinically significant drug-drug interactions.
To better characterize the biotransformation of CQ in humans, we used a variety of in vitro approaches to assess its metabolic stability and determine which enzymes are involved in its metabolism.
Materials and Methods
Chemicals and Solutions. CQ sulfate, DCQ, and BDCQ were a generous gift from Aventis (Vitry, France). CQ stock solutions (50 and 100 mM) were prepared in distilled water and stored at -20°C. DCQ and BDCQ stock solutions (100 mM) were prepared in 50:50 (v/v) methanol/distilled water and stored at -20°C. Diluted aqueous solutions were prepared immediately before the incubations. Chemical reagents, P450 substrates, or inhibitors were purchased from Sigma-Aldrich (Saint Quentin Fallavier, France or St. Louis, MO).
Human Liver Microsomes (HLM). HLM were prepared and characterized as described previously (Baune et al., 1999) or obtained commercially from XenoTech LLC (Kansas City, KS).
General Protocol for Microsomal Incubations of CQ and DCQ. Preliminary experiments ensured that DCQ formation was linear with time (from 15 to 90 min of incubation) and protein concentration (from 0.2 to 1 mg/ml). Control incubations were carried out by excluding either the substrate, NADPH, or microsomes from the incubation mixture. All incubations [HLM (0.2 mg/ml proteins), substrate(s), 0.005 M Sorensen buffer at pH 7.4] were performed in duplicate at 37°C. Incubations were started by the addition of NADPH (1–10 mM), after 5 min of preincubation. The final assay volume was 500 μl. Reactions were stopped after 60 min by the addition of an equal volume of ice-cold acetonitrile. Samples were then vortex-mixed, put on ice for 10 min, and centrifuged (10,000g for 20 min at 4°C). Supernatants (350 μl) were frozen at -80°C until liquid chromatography-mass spectrometry (correlation and inhibition studies with furafylline, sulfaphenazole, quercetin, and troleandomycin) or fluorescence analysis (enzyme kinetics and all other inhibition studies).
HPLC Analysis of CQ and Its Desethylated Metabolites Using Fluorimetric Detection. Aliquots of the supernatants (15–30 μl) were directly injected into the HPLC system. Separations were achieved on a C1 column (as previously described by Ducharme and Farinotti, 1997). The mobile phase consisted of methanol/water (70:30, v/v) containing 0.1% triethylamine. Eluants were detected by fluorescence (excitation wavelength 250 nm, emission wavelength 380 nm) at 11 (CQ), 22 (BDCQ), and 26 min (DCQ). The method was linear, accurate, and reproducible down to a 78 nM concentration of each analyte.
HPLC-MS Analysis. DCQ was also was quantified by HPLC-MS [HP-1100 HPLC apparatus coupled to a bench-top mass selective detector equipped with an atmospheric pressure ionization-electrospray source; Agilent Technologies, Ville St-Laurent, QC, Canada]. Acetonitrile-diluted (200 μl) supernatants were evaporated to dryness under a stream of nitrogen. Dry residues were dissolved in 200 μl of 5 mM ammonium acetate (pH 3.66) and a volume of 5 μl was injected into the liquid chromatography-mass spectrometry system. Chromatographic separations were achieved on a C18 HPLC column (3-μm particle size, 4.6 × 150 mm, YMC 18 ODS-AQ; Chromatography Sciences Company, Montreal, QC, Canada). The mobile phase consisted of a mixture of methanol (A), acetonitrile (B), and formic acid 0.04% in water (C) and was delivered at a flow rate of 1 ml/min. Step-wise gradients of A and B were simultaneously run in C. It consisted of linear gradients increasing from 4 to 6% of A and from 0 to 30% of B over 10 min. Afterward, proportions of A were kept constant at 6%, and B was rapidly increased to 90% over 2 min. A re-equilibration phase of 2.5 min was allowed between samples. Using these conditions, retention times were 5.7 min for DCQ and 6.0 min for CQ. The mass selective detector was operated in scan mode for the qualitative analyses of incubates (m/z from 50 to 500) and in selected ion monitoring mode for quantitative studies (m/z = MH+, M being the mass of the parent compound; m/z and m/z/2 = 146.6 and 292.2 for DCQ, m/z and m/z/2 = 160.6 and 320.2 for CQ). Nebulizer pressure was 40 psi, and the drying gas (nitrogen) was delivered at 13 l/min. Capillary voltage was 3500 V, and the fragmentor (collision-induced dissociation cell) was set at 50 V. DCQ and CQ were identified on the basis of their retention times and mass spectra compared with CQ and DCQ standard solutions. DCQ calibration curves (9.88–10,000 nM) were constructed by linear regression (weighed for 1/x) of the peak area versus DCQ concentration. Mean intraday precision was less than 10%, mean accuracy was 90 ± 5%, and the limit of quantification was 9.88 nM.
Enzyme Kinetics in HLM and Estimation of CQ Nonrenal Clearance. Increasing concentrations of CQ (25–3000 μM) were incubated in microsomal preparations from three human livers according to the protocol described in the previous section. In vitro intrinsic clearance (CLint) was calculated as the ratio of Vmax over Km (Houston and Kenworthy, 2000). CQ N-desethylation CLint was scaled up to an in vivo intrinsic clearance [CL′int; eq. 1] using published values of scaling factors: 45 mg of microsomal protein per gram of liver, and 20 g of liver per kilogram of body weight (Carlile et al., 1997; Obach, 1999).  The CL′int of CQ N-desethylase was entered in eq. 2, along with estimates of human hepatic blood flow (Q = 20 ml/min/kg; Obach, 1999) and CQ free fraction (fu) in human plasma (0.39; Walker et al., 1983), to predict the in vivo hepatic clearance (CLh) of CQ using the well stirred model.
Correlation Studies. CQ (100 μM) N-desethylation was also investigated in a panel of 16 HLM and one pool of HLM (Reaction Phenotyping kit, Xenotech LLC). The microsomal preparations were characterized for the following activities: NADPH-P450 reductase, 7-ethoxyresorufin O-dealkylation (CYP1A2), coumarin-7-hydroxylation (CYP2A6), S-mephenytoin N-demethylation (CYP2B6), S-mephenytoin 4′-hydroxylation (CYP2C19), paclitaxel (Taxol) 6α-hydroxylation (CYP2C8), tolbutamide methyl-hydroxylation (CYP2C9), dextromethorphan O-demethylation (CYP2D6), chlorzoxazone-6-hydroxylation (CYP2E1), testosterone 6β-hydroxylation (CYP3A4/5), and lauric acid 12-hydroxylation (CYP4A11).
Inhibition Studies. CQ (400 μM) was incubated in HLM in the presence/absence of selective inhibitors or substrates of P450s, namely, furafylline (CYP1A2; Eagling et al., 1998); coumarin (CYP2A6; Pearce et al., 1992); diethyldithiocarbamic acid (DDC; Eagling et al., 1998); sulfaphenazole (CYP2C9; Newton et al., 1995); quercetin (CYP2C8; Rahman et al., 1994); S-mephenytoin (CYP2C19; Loft et al., 1991); quinidine (CYP2D6; Newton et al., 1995); troleandomycin (TAO; CYP3A; Newton et al., 1995), and ketoconazole (CYP3A; Eagling et al., 1998). Inhibitor/substrate concentrations are shown in Fig. 6. All inhibitor/substrate solutions were prepared in methanol or water. Appropriate controls containing 0, 0.5, 1, and 2% (v/v) methanol in the incubation medium were used. The mechanism-based inhibitors TAO and furafylline were preincubated with microsomes (15 min in the presence of NADPH) prior to the addition of CQ. All other inhibitors/substrates were preincubated with CQ prior to the addition of NADPH, as described previously.
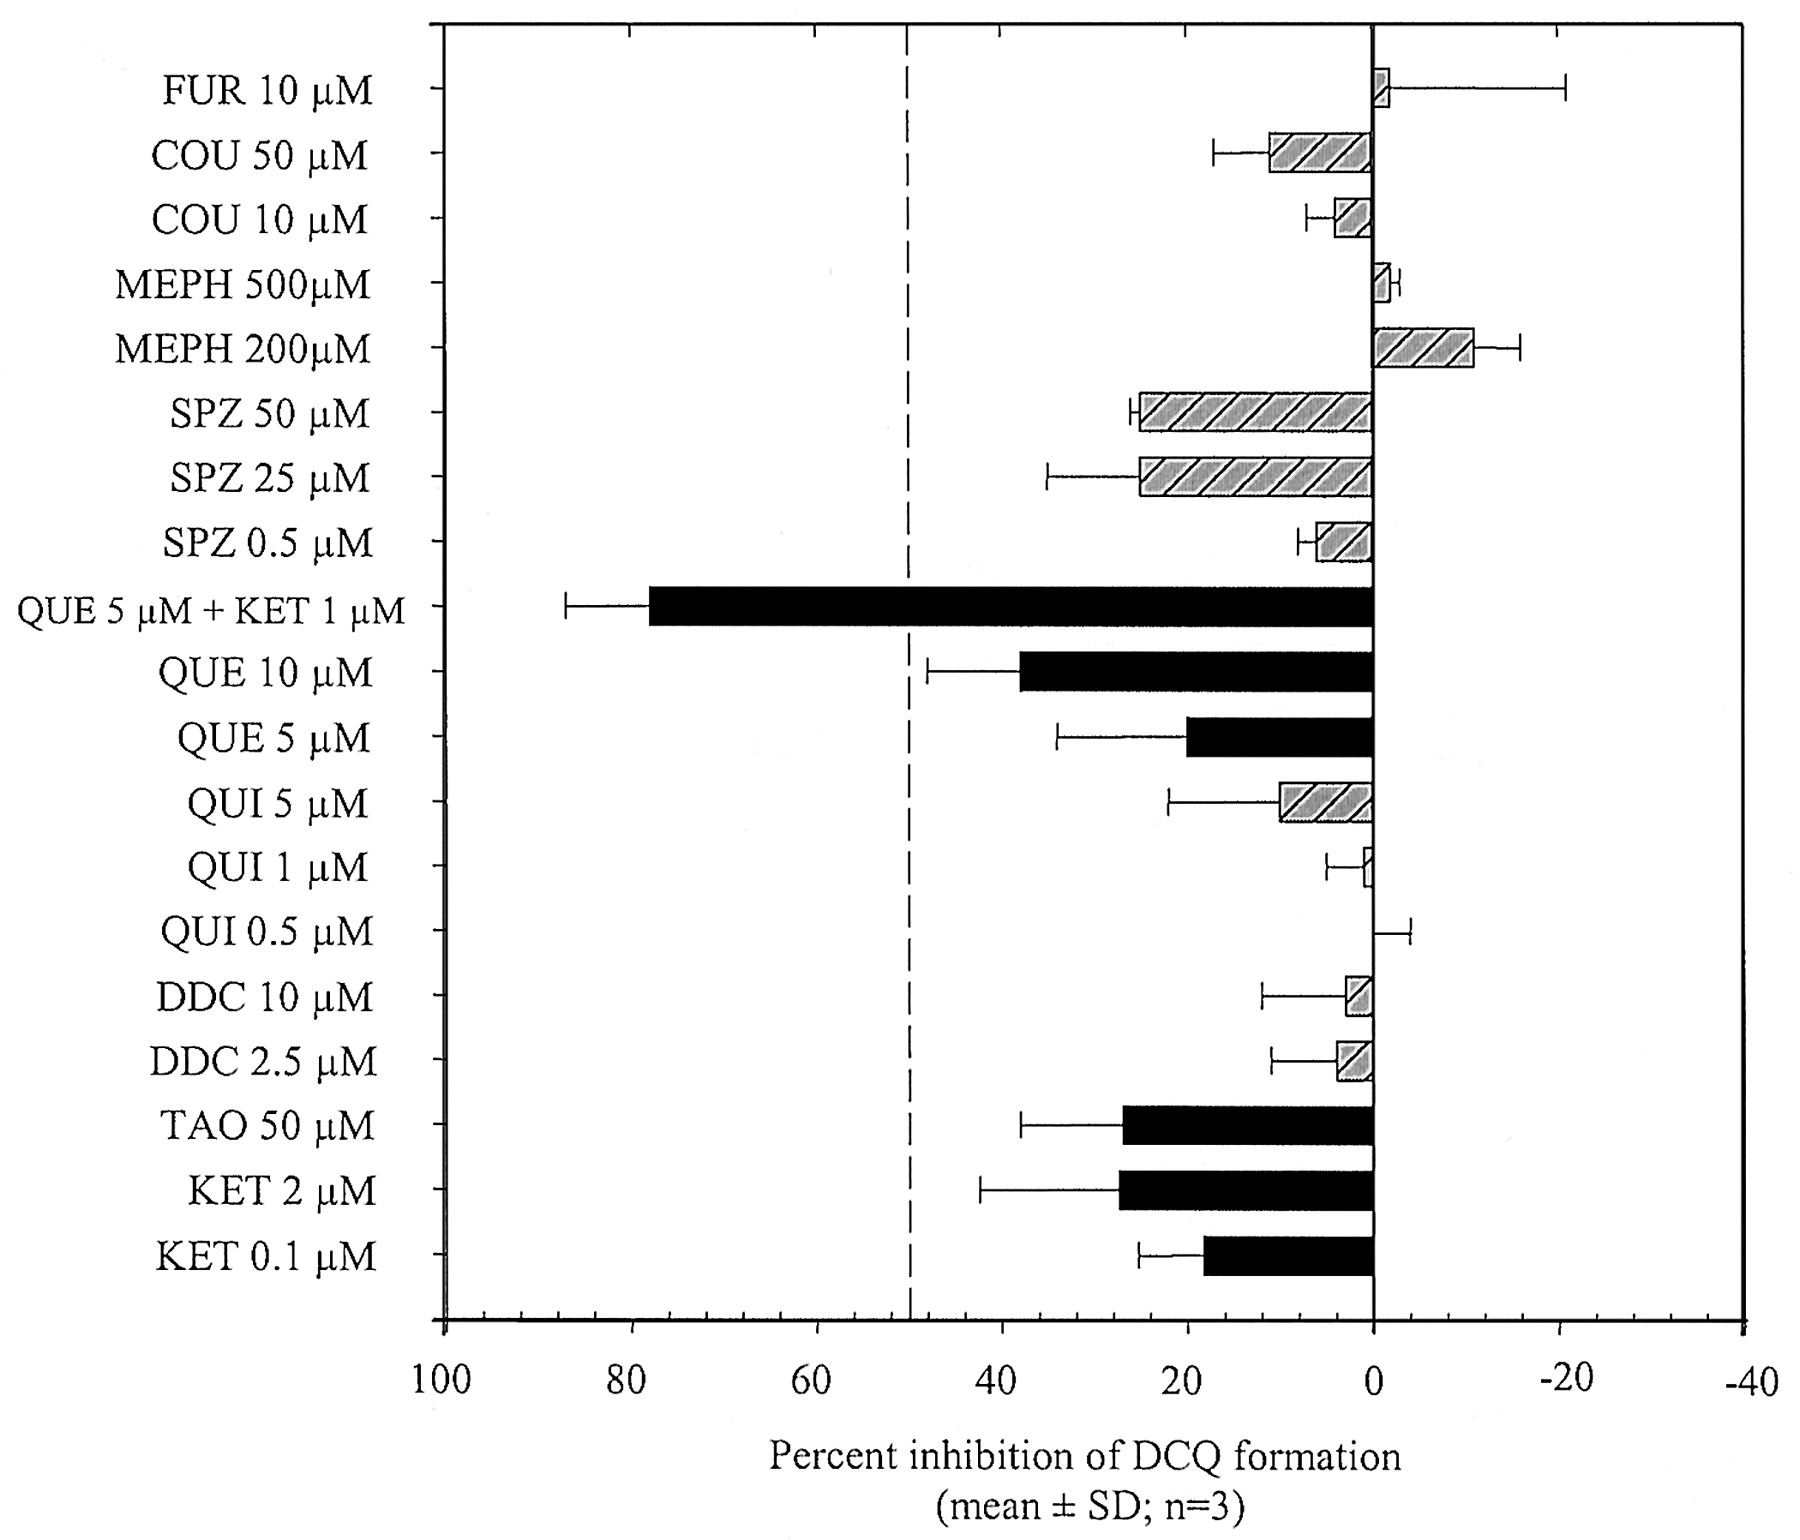
Chemical inhibition of DCQ formation by selective P450 substrates or inhibitors.
CQ was incubated at 400 μM in microsomal preparations from three human livers. Black bars indicate substrates/inhibitors of CYP2C8 or CYP3A4. FUR, furafylline; COU, coumarin; MEPH, mephenytoin; SPZ, sulfaphenazole; QUE, quercetin; QUI, quinidine; DDC, diethydithiocarbamate; TAO, troleandomycin; KET, ketoconazole.
cDNA-Expressed Human P450s. CQ N-desethylation was evaluated in microsomes prepared from insect cells transfected with cDNAs encoding for human CYP1A1, CYP2A6, CYP2C8, CYP2C9, CYP2C19, CYP2D6, CYP2E1, or CYP3A4. The recombinant enzymes and microsomes from untransfected insect cells were purchased from BD Gentest (Supersome; Woburn, MA). Each lot of recombinant P450s was accompanied with a certificate of analysis that guaranteed their full functionality against catalytically active positive controls if appropriate storage procedures were applied and freeze-thaw cycles minimized. These conditions were met and even exceeded since tubes were rapidly stored at -80°C following their arrival on dry ice, and a maximum of two freeze-thaw cycles was allowed. All incubations [Supersomes (100 pmol P450/ml), substrate, 0.005 M Sorensen buffer at pH 7.4] were performed in duplicate at 37°C. Incubations were started by the addition of NADPH (1 mM final concentration), after 5 min of preincubation. The final assay volume was 500 μl. Reactions were stopped after 20 min by the addition of an equal volume of ice-cold acetonitrile. Samples were then vortex-mixed, put on ice for 10 min, and centrifuged (10,000g for 20 min at 4°C). Supernatants (350 μl) were frozen at -80°C until HPLC-MS analysis. Mean DCQ formation rates in microsomes from untransfected cells were subtracted from rates of formation in microsomes from cells transfected with human P450s.
Enzyme Kinetics and Relative Contribution of CYPs to HLM CQ N-Desethylation. The Michaelis-Menten kinetics of CQ N-desethylation by CYP2D6, CYP2C8, and CYP3A4 were investigated using recombinant P450 and substrate concentrations ranging from 6.25 to 1000 μM. The relative contribution of individual CYPs (RCi of CYP2D6, CYP2C8, and CYP3A4) to CQ N-desethylation was estimated using the relative activity factor (RAF) approach described previously (Crespi, 1995; Strömer et al., 2000). The individual P450 reaction velocity [vri(S)] at the CQ concentration [(S)] was obtained using the Michaelis-Mentens equation (eq. 3). RAFi values for respective isoforms (8.33, CYP2C8; 41.7, CYP2D6; and 3.49, CYP3A4) were obtained from BD Gentest and entered with vi(S) in eqs. 4 and 5 to estimate RCi. 


Data Analysis. Enzyme kinetic parameters (Vmax, Km) were obtained by nonlinear least-squares analysis using Prism 3.02 (GraphPad Software Inc., San Diego, CA). The statistical significance of any correlation between DCQ formation rate and P450 selective activities was evaluated by least-squares regression using SigmaStat 2.03 (SPSS Science, Chicago, IL).
Results
Metabolite Identification (Data Not Shown). Control incubations were carried out to ensure that metabolite formation required microsomal enzymes and NADPH. In all CQ incubations, only the monodesethylated metabolite (DCQ) could be detected, and its formation increased linearly with time and protein concentration. When DCQ was incubated, the bisdesethylated derivative (BDCQ) was identified. When BDCQ was incubated in HLM, no metabolite could be found.
Kinetic Studies in HLM. DCQ formation was investigated in microsomal preparations from three human livers. The three livers metabolized CQ to a comparable extent (Table 1). In all cases, DCQ formation followed apparent first-order Michaelis-Menten kinetics, as illustrated in Fig. 2A for human liver HLM1. This was evidenced by a monophasic Eadie-Hofstee plot (Fig. 2B). Mean apparent Km and Vmax values were 444 ± 121 μM and 617 ± 128 pmol/min/mg protein, respectively, yielding a mean CLint of 1.41 ± 0.11 μl/min/mg protein. DCQ formation kinetics in HLM allowed us to extrapolate a hepatic clearance (CLh) of 0.52 ± 0.04 ml/min/kg.
Kinetic parameters of CQ N-desethylation by three different human liver microsomal preparations

A, DCQ formation kinetics in human liver microsomes prepared from HLM1. B, Eadie-Hoftsee plot demonstrating monophasic kinetics.
Symbols represent observed data (mean of duplicate samples); lines represent formation rates predicted with nonlinear regression (A) and linear regression (B). Kinetic parameters are displayed in Table 1.
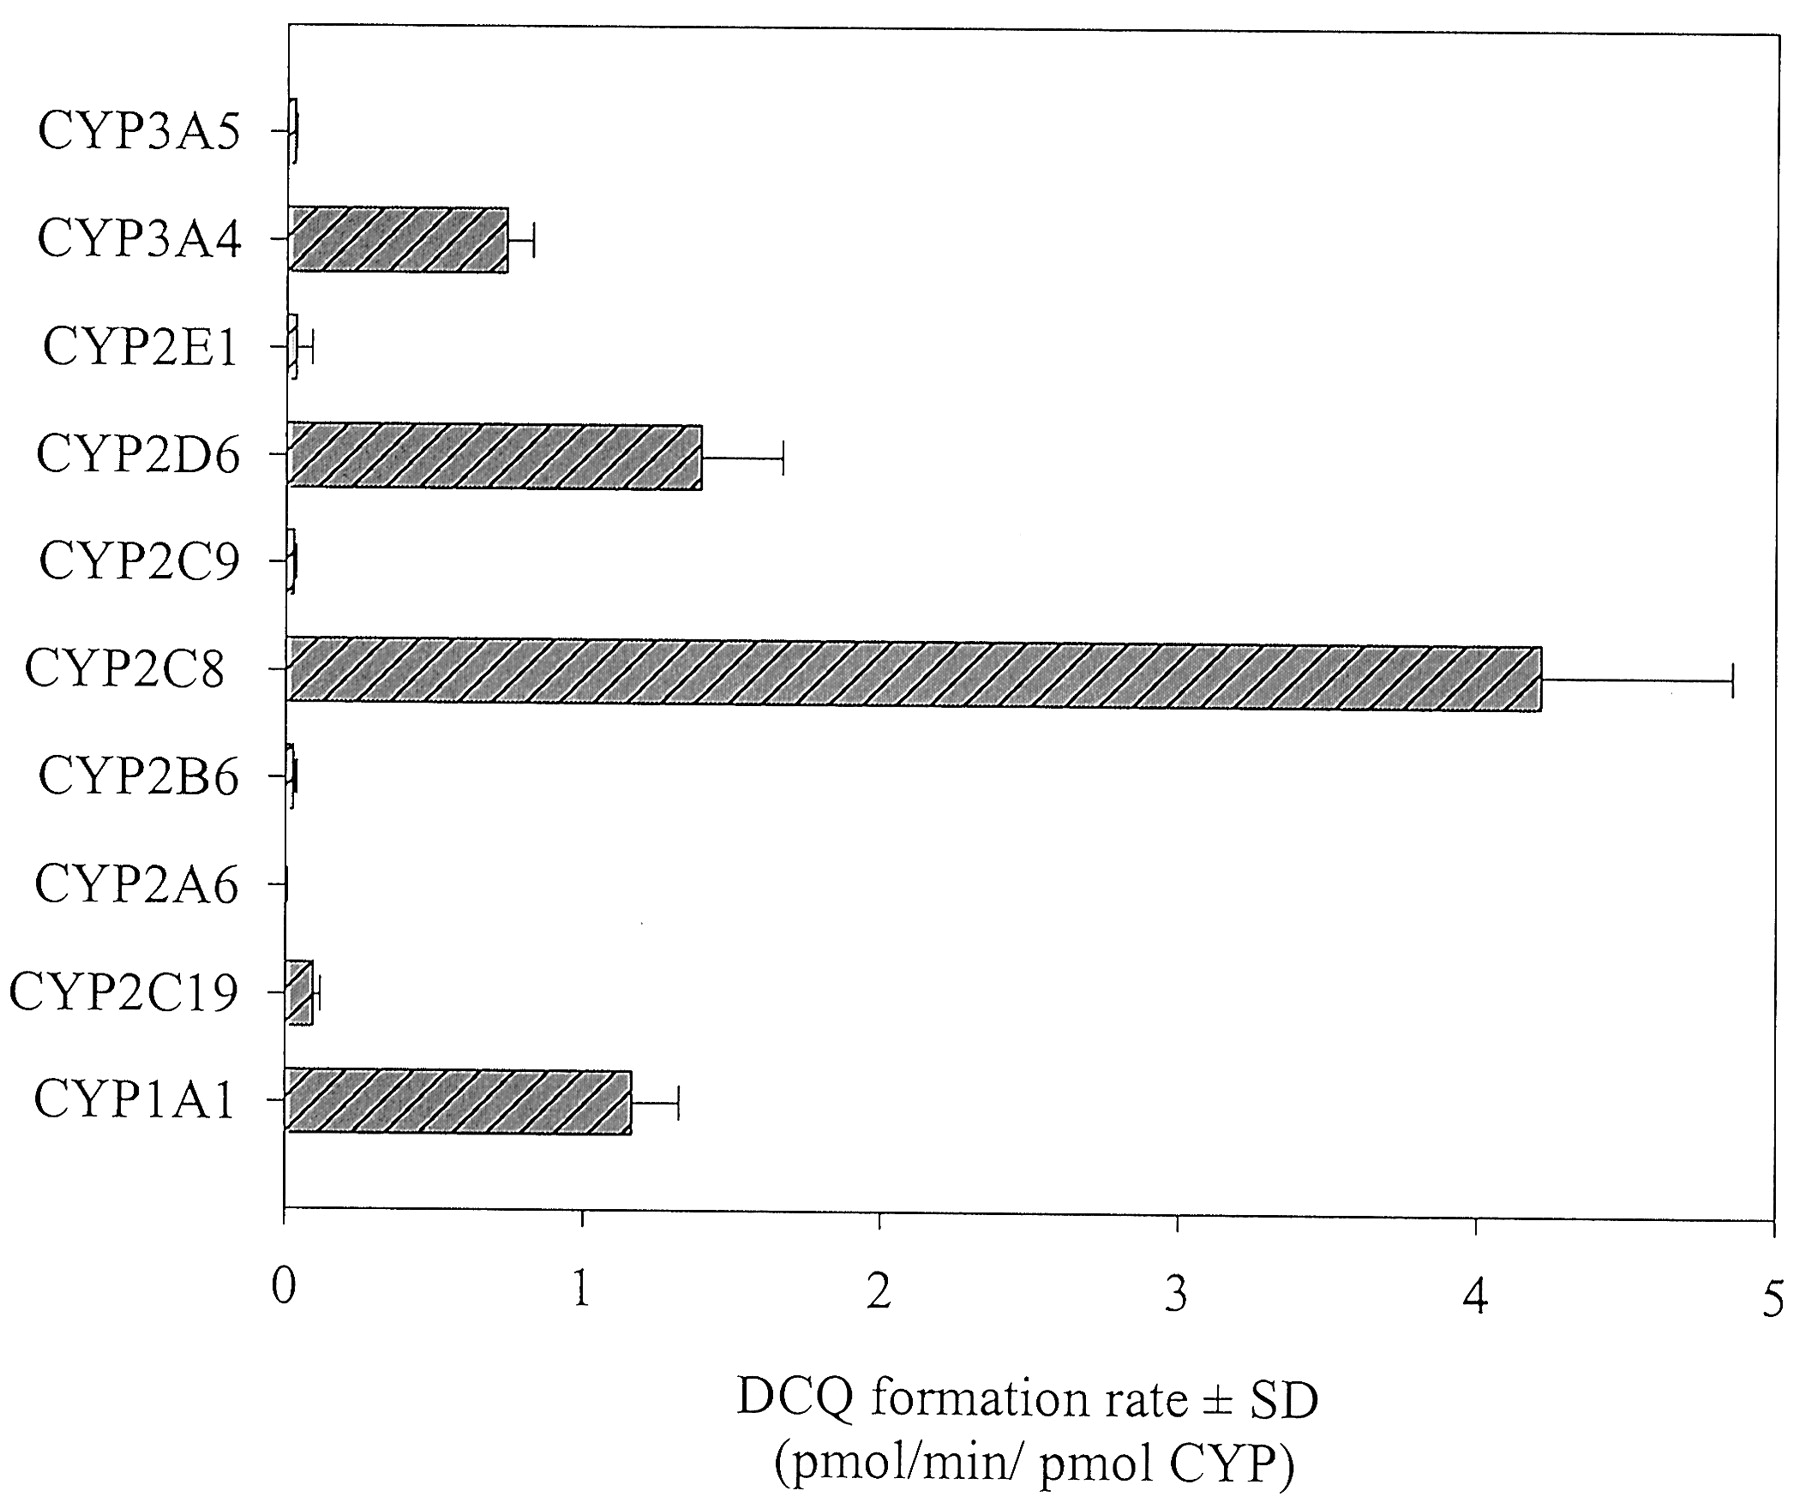
Human P450s Expressed in Insect Cells. The N-desethylation rates of CQ in microsomes from insect cell lines transfected with cDNA from human CYPs are presented in Fig. 3. Recombinant human CYP1A1, CYP2D6, CYP2C8, and CYP3A4 all showed the capacity to catalyze the formation of DCQ. The other P450 isoforms exhibited poor metabolic activities. The kinetics of DCQ formation were assessed in recombinant CYP2D6, CYP2C8, and CYP3A4, and DCQ formation followed a first-order Michaelis-Menten equation in all recombinant human P450s tested (Fig. 4). The most efficient enzyme for CQ N-desethylation was recombinant CYP2D6, which also exhibited the highest affinity for CQ, followed by CYP2C8 and CYP3A4 (Table 2).

DCQ formation rates (pmol/min/pmol P450) following the incubation of CQ (100 μM) in microsomes from insect cells expressing individual human P450s.
Bars represent means of triplicates.
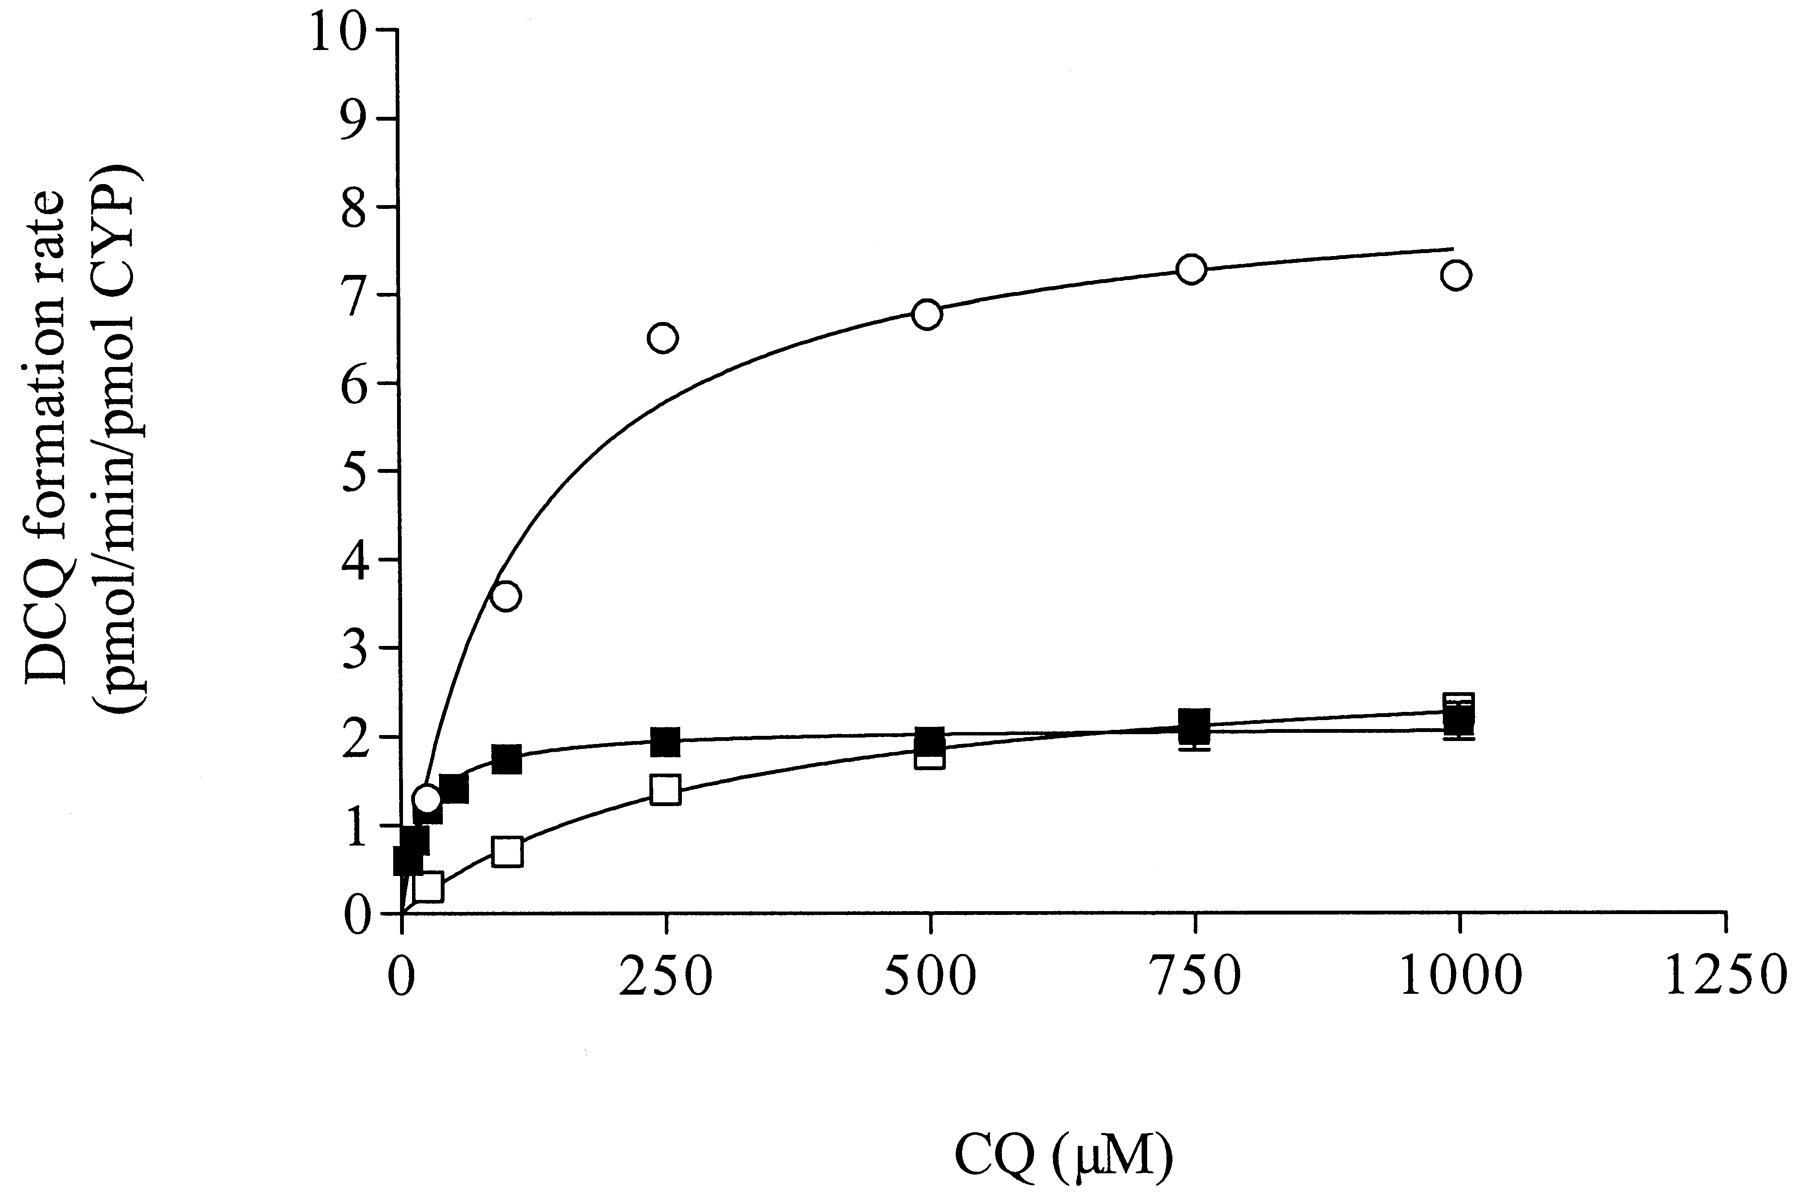
Kinetics of DCQ formation from CQ in cDNA-expressed human P450 enzymes (▪, CYP2D6; sh=cir, CYP2C8; and □, CYP3A4).
Symbols represent observed data (mean of duplicate samples); lines represent formation rates predicted with nonlinear regression. Kinetic parameters are displayed in Table 2.
Enzyme kinetic parameters (Km,r, Vmax,r) for CQ N-desethylation in recombinant CYP2D6, CYP3A4, and CYP2C8 and scaled parameters in HLM using the RAF approach
Contribution of CYP2C8, CYP3A4, and CYP2D6 to CQ N- Desethylase Activity in HLM. The relative contributions of CYP2C8, CYP3A4, and CYP2D6 to CQ N-desethylation in HLM were estimated using enzyme kinetic parameters obtained in recombinant human P450s with known RAF (Table 2). According to this approach, CYP2C8 was found to play the major role in CQ N-desethylation (∼60%), followed by CYP3A4 (∼25%) (Fig. 5). At low concentrations of CQ (<10 μM), CYP2D6 contributed significantly to DCQ formation (maximum of 15%). The contribution of this isoform became less important (∼5%) as CQ concentrations increased (Fig. 5).

Relative contributions of CYP2D6, CYP2C8, and CYP3A4 to CQ N-desethylation as predicted from recombinant P450s. Calculations were based on kinetic parameters displayed in Table 2.
Effect of Chemical P450 Inhibitors. In HLM, coincubations of 400 μM CQ with coumarin, furafylline, mephenytoin, and quinidine resulted in less than 20% inhibition of DCQ formation (Fig. 6). High concentrations of sulfaphenazole (CYP2C9) and CYP3A inhibitors such as ketoconazole and troleandomycin decreased DCQ formation by 20 to 30%. CQ N-desethylation was also inhibited (20–40% inhibition) by low concentrations of quercetin, a potent CYP2C8 inhibitor. When incubated in the presence of both ketoconazole (CYP3A) and quercetin (CYP2C8), DCQ formation was strongly inhibited (78% inhibition).
Correlation Studies. In characterized microsomal preparations obtained from 16 human livers, DCQ formation showed a 10-fold interindividual variability. Data from correlation analysis indicated, in decreasing order of correlation coefficients, that CYP2C8, CYP2B6, CYP3As, CYP2A6, CYP2C9, and CYP2C19 could all be involved in DCQ formation (Table 3). The CQ N-desethylase activity correlated significantly with testosterone 6β-hydroxylase (r = 0.80, p < 0.001) and paclitaxel 6α-hydroxylase (r = 0.82, p < 0.001) activity. The correlation between DCQ formation and S-mephenytoin hydroxylase (CYP2C19) achieved statistical significance (r = 0.51, p < 0.05) but was considered weak because the data distribution was sparse and did not evidence a clear trend. The correlation between tolbutamide methylhydroxylase (CYP2C9) and DCQ formation (r = 0.65, p < 0.01) was not considered biologically significant since it was driven by one or two individuals. When these individuals were removed, the correlation was no longer significant. In addition, within the panel of HLM, co-correlations were observed between some activity markers [i.e., between coumarin hydroxylase and S-mephenytoin N-demethylase (r = 0.76) and between coumarin hydroxylase and paclitaxel 6α-hydroxylase (r = 0.63)]. A significant cocorrelation was also observed between S-mephenytoin N-demethylase and testosterone 6β-hydroxylase (r = 0.57). Since negligible amounts of DCQ were found in incubations from recombinant CYP2A6, CYP2B6, CYP2C9, and CYP2C19, it is unlikely that these enzymes are involved in the formation of DCQ.
Correlation between CQ N-desethylase activity and various P450 selective activities following the incubation of CQ (100 μM) in a panel of 16 human liver microsomes and 1 pool of human liver microsomes
Discussion
This is the first investigation of CQ metabolism in HLM. Although CQ was assumed to be N-dealkylated via the P450 enzyme system, it had never been proven experimentally. By incubating the parent and the metabolites, the present experiments allowed us to conclude that BDCQ is a secondary metabolite, resulting from the biotransformation of the primary metabolite DCQ. No other metabolite could be detected using either fluorescence or MS.
In humans, following single oral doses, peak CQ plasma concentrations approximate 1 μM (Gustafsson et al., 1983; Frisk-Holmberg et al., 1984; De Vries et al., 1994). At doses of 250 mg/day, mean steady-state plasma concentrations are highly variable (0.25 ± 0.23 μM) and can attain 1.2 μM (Augustjins et al., 1992). Since high proportions of the drug are bound to platelets and granulocytes, whole blood concentrations are expected to be 5 to 10 times higher than those observed in plasma (Frisk-Holmberg et al., 1984). Higher concentrations of approximately 100 μM were measured in bone marrow, liver, spleen, and leukocytes (Grundmann et al., 1971). In fatal overdose cases, the highest CQ concentrations were found in the liver (Robinson et al., 1970). Therefore, micromolar to hundreds of micromolar levels are expected to represent relevant concentrations at which to carry out metabolic investigations.
In HLM, the mean apparent Km of approximately 400 μM indicates that enzymes metabolizing CQ into DCQ have a modest affinity for the substrate. DCQ formation was associated with a relatively high Vmax of about 617 pmol/min/mg protein, suggesting a high-capacity enzyme system. Accordingly, the finding that, in humans, DCQ was readily detectable in plasma during the absorption phase of CQ pointed to an enzymatic system with a high capacity (Ducharme and Farinotti, 1996). The predicted nonrenal clearance value of 0.52 ± 0.04 ml/min/kg estimated from the present HLM investigations is in agreement with the one obtained in vivo from normal subjects (0.63–1.02 ml/min/kg; Frisk-Holmberg et al., 1983; Gustafsson et al., 1983; Ette et al., 1989).
Although a one-enzyme model best fitted DCQ formation, one cannot exclude the involvement of more than one isoform. This is especially the case if one of the enzymes predominates in a particular reaction (Clarke, 1998). Studies using cDNA-expressed systems showed that CYP2C8, CYP2D6, CYP3A4, and CYP1A1 could all catalyze the formation of DCQ. However, unlike microsomal preparations that contain all P450s in their native proportions, cDNA-expressed enzymes alone cannot determine whether an enzymatic pathway makes a quantitatively important contribution to the overall metabolism of a compound. For instance, although recombinant human CYP1A1 catalyzed CQ desethylation, the extremely low expression of CYP1A1 in human liver precludes its implication in DCQ formation (Pastrakuljic et al., 1997).
The use of the RAF approach has been successfully applied to bridge the gap between recombinant systems and liver microsomes and estimate individual P450 contributions to drug metabolism (Crespi, 1995; Strömer et al., 2000). Using this approach, we identified CYP2C8 and CYP3A4 as the most active P450 isoforms, contributing collectively to more than 80% of total CQ N-desethylation over a wide range of concentrations. Recombinant CYP2D6 exhibited the highest affinity for CQ, but its contribution to DCQ formation in HLM was not detected in correlation or inhibition studies. Both findings can be reconciled by the fact that CYP2D6 is not expected to contribute significantly to DCQ formation at higher concentrations.
Observations in recombinant P450s are consistent with those obtained in HLM, where the formation of DCQ showed a high correlation with CYP2C8 and CYP3A activities, as assessed by paclitaxel 6α-hydroxylation and testosterone 6β-hydroxylation, respectively (Waxman et al., 1991; Rahman et al., 1994). Complementary studies with selective inhibitors (ketoconazole and TAO for CYP3As and quercetin for CYP2C8) confirmed the contribution of these two isoforms. Further corroboration of the involvement of CYP2C8 and CYP3A4 was obtained by a combination of ketoconazole and quercetin.
Our results are similar to those reported for the N-desethylation of the 4-aminoquinoline antimalarial, amodiaquine, which was found to be mainly catalyzed by CYP2C8 in HLM (Li et al., 2002). Our observations also support the hypothesis that a certain degree of overlap exists between CYP2C8 and CYP3A4 substrate specificity (Ong et al., 2000). Partial contribution of CYP3A4 to the metabolism of predominantly CYP2C8 substrates has been reported for cerivastatin and rosiglitazone (Baldwin et al., 1999; Muck, 2000).
Enzyme kinetic parameters obtained from recombinant P450s revealed that CYP3A4 had the lowest affinity for CQ when compared with CYP2C8 or CYP2D6. This may explain the lack of significant interactions found in vitro, in HLM, between CQ and CYP3A4 substrates, such as quinine and halofantrine (Zhao and Ishizaki, 1997; Baune et al., 1999). In vivo, coadministration of CQ and dapsone to volunteers did not affect CYP3A4-mediated dapsone metabolism (Adedoyin et al., 1998). In contrast, coadministration of CQ with cyclosporine, a CYP3A4 and P-glycoprotein (P-gp) substrate, led to an increase in cyclosporine plasma levels and transient nephrotoxicity (Nampoory et al., 1992). Since P-gp is an important determinant of interpatient variability in oral cyclosporine bioavailability (Tsuji and Tamai, 1996) and because CQ has been shown to interfere with P-gp function in vitro (Tiberghien and Loor, 1996), one could speculate that an interaction with P-gp rather than CYP3A4 could be responsible for the CQ-cyclosporine interaction.
CQ is well recognized to competitively inhibit CYP2D6 activity in HLM (Lancaster et al., 1990; Halliday et al., 1995; Masimirembwa et al., 1995). The inhibitory constant (Ki) values obtained for CQ in HLM (13–15 μM) approximate the Km of CQ N-desethylation in recombinant CYP2D6 (19.5 μM), which indicates some affinity for CQ at the CYP2D6 binding site. Our results, combined with those obtained in the literature, suggest that CQ may act as a substrate inhibitor of CYP2D6 in vitro. Compared with quinidine [Ki = 0.05 μM; Von Moltke et al. (1994)], CQ is approximately 300 times less potent in inhibiting CYP2D6 in vitro. However, the affinity of CQ for CYP2D6 could have clinical consequences in view of its high intrahepatic levels and extremely long half-life. Hence, CQ showed modest inhibitory effects on CYP2D6 activity in vivo in humans when coadministered with debrisoquine, a CYP2D6 probe-substrate (Adedoyin et al., 1998; Simooya et al., 1998).
Although we did not characterize the P450s involved in the biotransformation of DCQ into BDCQ, there is some evidence that DCQ and CQ are metabolized by the same enzymatic systems in humans. In vivo, the formation rates of DCQ and BDCQ, from CQ and DCQ, respectively, are strongly correlated (r = 0.83) (Ette et al., 1989). In vitro, in HLM, our study demonstrated that DCQ is N-desethylated into BDCQ via an NADPH-dependent system. In addition, CQ and DCQ share structure similarities and have been shown to exhibit similar Ki values for CYP2D6 substrates in HLM (Masimirembwa et al., 1995). Collectively, these observations suggest that CYP2D6, and probably other P450s catalyzing CQ N-desethylation, might be involved in the metabolism of DCQ. Further studies are needed to address this.
The present study suggests that, in humans, therapeutic concentrations of CQ would be metabolized into DCQ primarily via CYP2C8 and CYP3A4. At low CQ concentrations, CYP2D6 may also play a significant role. Overall, results show that CYP2C8 and CYP3A4 constitute low-affinity, high-capacity systems, whereas CYP2D6 has a higher affinity but a significantly lower capacity. This property may explain CQ's ability to inhibit CYP2D6-mediated metabolism in vitro and in vivo. In conclusion, drug-drug interactions or interindividual variability in activity or expression of CYP2D6, CYP3A4, or CYP2C8 may explain the wide range of CQ and DCQ concentrations found in plasma and urine following therapeutic doses of CQ (Ducharme and Farinotti, 1996).
Footnotes
-
↵ 1 Abbreviations used are: CQ, chloroquine; DCQ, desethylchloroquine; BDCQ, bisdesethylchloroquine; HLM, human liver microsome(s); HPLC, high-performance liquid chromatography; CLint, in vitro intrinsic clearance; CL′int, scaled in vivo intrinsic clearance; CLint,r, in vitro intrinsic clearance in recombinant P450i; CLh, hepatic clearance; P450, cytochrome P450; RAF, relative activity factor; RC, relative contribution; TAO, troleandomycin; P-gp, P-glycoprotein.
-
Denis Projean was supported by a Research Studentship from AstraZeneca R&D Montréal.
- The American Society for Pharmacology and Experimental Therapeutics


