


Abstract
The cytochrome P450 (P450) enzymes are the predominant enzyme system involved in human drug metabolism. Alterations in the expression and/or activity of these enzymes result in changes in pharmacokinetics (and consequently the pharmacodynamics) of drugs that are metabolized by this set of enzymes. Apart from changes in activity as a result of drug–drug interactions (by P450 induction or inhibition), the P450 enzymes can exhibit substantial interindividual variation in basal expression and/or activity, leading to differences in the rates of drug elimination and response. This interindividual variation can result from a myriad of factors, including genetic variation in the promoter or coding regions, variation in transcriptional regulators, alterations in microRNA that affect P450 expression, and ontogenic changes due to exposure to xenobiotics during the developmental and early postnatal periods. Other than administering a probe drug or cocktail of drugs to obtain the phenotype or conducting a genetic analysis to determine genotype, methods to determine interindividual variation are limited. Phenotyping via a probe drug requires exposure to a xenobiotic, and genotyping is not always well correlated with phenotype, making both methodologies less than ideal. This article describes recent work evaluating the effect of some of these factors on interindividual variation in human P450-mediated metabolism and the potential utility of endogenous probe compounds to assess rates of drug metabolism among individuals.
Introduction
Xenobiotics, including therapeutic agents, typically undergo chemical modification in the body to aid their elimination. The cytochrome P450 (P450) monooxygenase enzymes are the predominant enzyme system involved in human drug metabolism, accounting for about 75% of the total reactions for drug metabolism in the human liver, intestine, and kidney (Guengerich, 2008). The rate at which drugs and xenobiotics are metabolized by P450s affects the pharmacokinetics of the compound and, consequently, may also affect the pharmacodynamic response (Sim et al., 2013). Drug interactions involving either induction or inhibition of P450 enzymes can alter rates of P450-mediated metabolism. However, significant interindividual variation in basal rates of P450-mediated drug metabolism have been observed, including up to 30- to 40-fold variation for CYP3A enzymes (Westlind et al., 1999; Lamba et al., 2002; Hart et al., 2008), 100-fold variation for CYP2D6 (Hart et al., 2008), 50- to 60-fold variation for CYP2B6 (Saitoh et al., 2007), and 40- to 50-fold variation for CYP2C9 (Hart et al., 2008).
Pharmacogenetic variation associated with changes in the amino acid sequence of the coding region accounts for some of the basal interindividual variation in P450-mediated metabolism in humans. Clinically relevant examples of this pharmacogenetic variation have been observed with CYP2C9 (for warfarin) (Cooper et al., 2008; Takeuchi et al., 2009), CYP2C19 (for clopidogrel and omeprazole) (Hou et al., 2014), CYP2D6 (for tamoxifen and codeine) (Madadi et al., 2013; Gryn et al., 2014), and CYP3A5 (for tacrolimus) (Rojas et al., 2015). In some instances, the resulting protein is still functional but exhibits reduced activity (e.g., CYP2C9; Steward et al., 1997); in other cases, the resulting variant protein may be completely devoid of activity or is not expressed (e.g., , such as CYP2D6, CYP2C19, and CYP3A5; Dahl et al., 1992; de Morais et al., 1994; Kuehl et al., 2001, respectively). Depending on whether metabolism produces an active (e.g., clopidogrel) or inactive metabolite (e.g., warfarin), the consequences of these polymorphisms can result in significant alternations in therapeutic effect.
Beyond differences in rates of P450 metabolism as a result of coding region changes, investigators have explored whether other factors contribute to interindividual variation in basal P450 activity. These factors include genetic variation in promoter regions, altered expression of microRNA that affect P450 expression, genetic variation in transcriptional regulators, and the influence of modulating agents early in development, among others. Genetic variation in the promoter region of P450 enzymes can result in altered levels of expression, which in turn lead to alterations in rates of drug metabolism (Lamba et al., 2008). Likewise, variability in expression of microRNA has been demonstrated to alter expression of P450s (Lamba et al., 2014). Although less well studied, genetic variations in the noncoding region play an important role in the interindividual variation of human drug metabolism. Finally, the ontogeny of drug-metabolizing enzymes has been established by several investigators (Lacroix et al., 1997; Stevens, 2006; Hines, 2007). These studies have demonstrated that P450s mature at different rates throughout development, with some reaching adult activity shortly after birth, some taking several years before reaching full activity, and some even peaking and then diminishing after birth (Hines, 2007). However, little is known about the influence of environment or exposure to drugs or other xenobiotics on their long-term expression and activity.
Regardless of the cause of interindividual variation, it is desirable to determine an individual’s phenotype in the most rapid and least invasive manner. Typically, this has been accomplished by administering a “probe” compound and measuring the pharmacokinetics of the probe compound. Probe compounds have been studied for most P450s, and multiple probe compounds have been identified for some P450s. To assess the phenotype of several drug-metabolizing enzymes simultaneously, a “cocktail” of probe compounds can be used. However, ideally one would not have to administer an exogenous compound (or compounds), but be able to evaluate an individual’s phenotype through measurement of endogenous compounds and their pharmacokinetics. Cortisol and its metabolite, 6β-hydroxycortisol, are examples of endogenous compounds that have been used for CYP3A phenotyping (Galteau and Shamsa, 2003).
This symposium describes the work spanning genetic variation, regulation, development, and activity of P450s of four laboratories. The roles of transcriptional regulators, their genetic variation, xenobiotic exposure during the early developmental period in interindividual variation in human drug metabolism, as well as metabolomic approaches to predicting individual rates of human drug metabolism are described.
Genetic Predictors of P450 Expression and Activity (E.G.S., B.P., K.E.T., and A.S.C.)
Genetic polymorphisms have been identified for most human P450s. Many of these variant alleles contribute to interindividual differences in gene expression and/or enzyme activity and, consequently, underlie disease susceptibility and pharmacokinetic variability. Nevertheless, a large percentage of interindividual variation in P450 activities remains unexplained by common cis-variation. This talk reviewed the unique value of using a human liver resource as a basic biology discovery platform to identify cis- and trans-genetic variants and their P450 phenotypic consequences.
Somewhat surprisingly, we found a significant degree of coregulation in mRNA expression between some of the major human hepatic drug-metabolizing enzymes (Chaudhry et al., 2013). For example, the mRNA expression of CYP2C19, CYP2B6, and CYP3A4 was highly correlated despite the fact that these genes are on different chromosomes. Indeed, there are polymorphisms in shared hepatic transcriptional regulators of these P450s, such as hepatocyte nuclear factor (HNF) 4β, forkhead box proteins (FOX) A2 and A3, and pregnane X receptor (PXR). However, only about 10% of the variation in target P450 expression is explained by these trans-factor polymorphisms (Lamba et al., 2010).
In a collaborative study, we constructed an unbiased weighted coexpression network and a Bayesian regulatory network by using whole-genome mRNA expression in >400 human livers (Yang et al., 2010). A novel candidate regulatory gene, aldo-keto reductase 1D1 (AKR1D1), was identified as one master regulator driving coexpression of the P450 network. AKR1D1 was a reasonable candidate regulating P450 expression because of its central role in regulating bile acid concentrations in liver. Bile acids can activate nuclear receptors such as PXR, farnesoid X receptor (FXR), and constitutive androstane receptor (CAR). We used adenovirus to overexpress AKR1D1 and small interfering RNA to knockdown AKR1D1 expression in primary human hepatocytes to evaluate AKR1D1’s role in regulating P450 expression. CYP3A4, CYP2C8, CYP2C9, CYP2C19, and CYP2B6 mRNA expression was decreased by knockdown of AKR1D1, whereas AKR1D1 overexpression increased expression of these P450s. The AKR1D1 cDNA was resequenced in livers from approximately 100 donors. A 3′-untranslated region (UTR) (rs1872930) single nucleotide polymorphism (SNP) was identified that was associated with higher mRNA expression of AKR1D1. The AKR1D1 3′-UTRs from the wild type and variant alleles were engineered into luciferase reporters and transfected into HepG2 cells. Consistent with its mRNA expression, the variant 3′-UTR reporter had luciferase activity higher than the wild-type construct. This result suggests the 3′-UTR SNP can increase either AKR1D1 mRNA translational efficiency or AKR1D1 mRNA stability. In addition, the 3′-UTR SNP in AKR1D1 was significantly associated with mRNA expression and P450 activity of CYP2B6, CYP2C19, CYP2C8, and CYP3A4. In total, this study revealed that genetic variation in a master regulator (AKR1D1) of the P450 network can predict activity of numerous P450s in the network. Hence, identifying hub regulatory genes in P450 expression networks is an alternative way to identify genes whose genetic variation may alter P450 activity. Interestingly, this study demonstrates that genetic variation in genes, like AKR1D1, is an important contributor to variation in P450 activity, by influencing the level of ligands that activate nuclear receptors responsible for the transcriptional regulation of P450s (e.g., bile acids) (Chaudhry et al., 2013).
Another unique value of the human liver resource is that it offers a rich and robust resource of phenotypic variation that can be used to identify associated genotypic variation affecting mRNA processing (e.g., splicing). Because splicing is highly tissue specific, and the liver shows an unusually high level of alternative pre-mRNA splicing per gene compared with other tissues, the functional consequence of SNPs in hepatic genes has the greatest probability of generating unique liver-specific phenotypes that can only be detected in hepatic samples. Indeed, a single agarose gel analysis of P450 polymerase chain reaction products is able to quickly identify unique alternative mRNAs that are “polymorphically” expressed—that is, their expression is not proportional to the amount of canonical mRNA and is uniquely/polymorphically expressed only in some human livers. This approach was successfully used to identify the causative SNPs that lead to alternative splicing and polymorphic expression of CYP3A5*3, CYP3A5*6 (Kuehl et al., 2001), and CYP2B6*6 (Lamba et al., 2003).
In the course of polymerase chain reaction amplification of CYP2C19 to sequence and identify additional variants, we found that amplification from exons 2 to 4 revealed a novel alternative CYP2C19 mRNA in a substantial number of human livers. This CYP2C19 alternative mRNA was perfectly correlated with an intron 2 SNP, rs12769205 (Chaudhry et al., 2015). A survey of multiple genomic databases indicated that rs12769205 and rs4244285 are in linkage disequilibrium with CYP2C19*2 (Fig. 1A). However, in blacks (African ancestry), rs12769205 can also exist alone in CYP2C19*35. Notably, rs4244285, the SNP that defines CYP2C19*2, is located in exon 5 and leads to alternative splicing of the first 40 base pairs of this exon, ultimately changing the mRNA reading frame and leading to a premature termination codon. For 2 decades, rs4244285 was thought to be the exclusive SNP leading to loss of CYP2C19*2 function. This new SNP, rs12769205 in an intron 2 branch point adenine, leads to alternative splicing of this allele due to inclusion of all of intron 2, alteration of the reading frame, and a premature termination codon in CYP2C19*2. Minigene experiments showed that rs12769205 alone leads to inclusion of intron 2. To determine the independent contribution of each SNP to CYP2C19 protein expression in livers with CYP2C19*2, we used a quantitative proteomics with tandem mass spectrometry approach. The amount of CYP2C9 protein was quantified in wild-type and homozygous CYP2C19*2 livers (with both rs12769205 and rs4244285). In persons homozygous for both SNPs, some residual CYP2C19 protein was detectable with the exon 2 probe (which is 5′ of both SNPs); however, no CYP2C19 protein was detectable with the exon 4 probe (which is 5′ of rs4244285, but downstream of the intron 2 SNP). This result shows that rs12769205 in intron 2 can lead to the loss of CYP2C19 protein because of its preeminence in CYP2C19 mRNA splicing.

CYP2C19*35 and CYP2C19*2 (both with rs12769205) have REHH scores similar in magnitude to haplotypes associated with malaria resistance. (A) Structure of CYP2C19*1, CYP2C19*35, and CYP2C19*2 mRNAs and their haplotype frequency in Yorubans. (B) REHH scores for CYP2C19*2 and CYP2C19*35 and for two haplotypes, G6PD haplotype 8 and TNFSF5 haplotype 4, under positive natural selection for resistance to malaria. G6PD, glucose-6-phosphate dehydrogenase; REHH, relative extended haplotype homozygosity; TNFSF5, tumor necrosis factor receptor superfamily member 5; Yri, Yorubans.
We determined whether CYP2C19*35 and CYP2C19*2 are under natural selection in populations with African ancestry, and which allele arose first. Phylogenetic tree analysis of CYP2C19 haplotypes across African populations showed that rs12769205 was the original polymorphism arising first on CYP2C19*35 and that CYP2C19*2 was created later after the addition of rs4244285 (Fig. 1A). The final evidence that rs12769205 is functionally important came from screening CYP2C19*2 and CYP2C19*35 for natural selection in African populations, such as the Yorubans. In all African populations examined, there was significant evidence that both haplotypes carrying rs12769205 had undergone natural selection. Indeed, the degree of natural selection on both alleles carrying rs12769205 (CYP2C19*35 and CYP2C19*2) was similar in magnitude to the evolutionary force seen for genes such as glucose-6-phosphate dehydrogenase and tumor necrosis factor receptor superfamily member 5, which are under natural selection from infectious diseases such as malaria (Fig. 1B). This supports the data that rs12769205 has a significant functional effect exclusive of rs4244285. Hence, rs12769205 is the original ancestral polymorphism leading to abnormal splicing and intron 2 retention in both CYP2C19*35 and CYP2C19*2.
Effects of Drug Treatment at Early Life on Interindividual Variations of P450-Mediated Drug Metabolism in Adult Liver (X.Z. and Y.-C.T.)
Significant variation in P450 activities has been found during development, from the prenatal period through birth, infancy, childhood, adolescence, and adulthood (Hines, 2007). For example, CYP3A4 and CYP3A7 are differentially expressed at different developmental ages (Lacroix et al., 1997; Stevens, 2006). CYP3A7 is the predominant CYP3A enzyme expressed in fetal and early postnatal liver tissues and then generally decreases over a few years to an undetectable level for the rest of life. Conversely, CYP3A4 is not detectable before birth but gradually increases postnatally and is the dominant P450 enzyme in the adult liver and intestine. The differences in catalytic activities and gene expression of CYP3A4 and CYP3A7 can lead to differences in drug metabolism and responses between pediatric and adult patients. An ontogenic pattern with increased gene expression has also been found in CYP2B6 (Croom et al., 2009), CYP2C9, and CYP2C19 (Koukouritaki et al., 2004). Using the mouse as a model, we have demonstrated that ontogenic expression of P450 genes in the liver is a programmed biologic process (Peng et al., 2012). The similarity of ontogenic gene expression patterns has been observed between human CYP3A4 and mouse Cyp3a11, human CYP2B6 and mouse Cyp2b10, and human CYP2C9 and mouse Cyp2c29. For some mouse P450s, such as Cyp3a11 and Cyp3a16, ontogenic gene expression patterns are associated with epigenetic signatures, such as histone methylation, during liver maturation at postnatal development (Li et al., 2009).
Induction of P450 expression by drugs or other xenobiotic compounds also has clinical implications (Lin and Lu, 1998). Induction of P450 expression by drugs may result in an increased rate of P450-mediated drug metabolism, which may correspond to a decrease in therapeutic effect of the victim drug. It is known that some drugs can serve as ligands to activate transcription factors, such as nuclear receptors, and thus induce the expression of P450 genes (Handschin and Meyer, 2003). For example, rifampicin, hyperforin, or phenobarbital induces CYP3A4, CYP2C9, or CYP2B6 through the direct or indirect activation of PXR or CAR (Gervot et al., 1999; Goodwin et al., 1999, 2001; Sueyoshi et al., 1999; Chen et al., 2004). Induction of P450 enzymes by drugs has been identified as a factor that can contribute to interindividual variability of drug response (Lin and Lu, 2001).
Treatment with drugs during early life may have a long-term effect on persistent induction of P450 gene expression throughout the rest of life. Neonatal exposure to phenobarbital has shown an overinduction of P450 expression in adult liver through an imprinting mechanism in a rat model (Agrawal and Shapiro, 2003), which could result in reduced life expectancy and enhanced susceptibility to tumorigenesis (Agrawal and Shapiro, 2005). Neonatal activation of the nuclear receptor CAR by TCPOBOP (1,4-bis-[2-(3,5-dichloropyridyloxy)]benzene,3,3′,5,5′-tetrachloro-1,4-bis(pyridyloxy)benzene; a CAR ligand) also resulted in permanent changes of P450 expression in adult mouse livers through a mechanism that altered epigenetic memory (Chen et al., 2012), including a permanent increase of histone 3 lysine 4 mono-, di-, and trimethylation and a decrease of histone 3 lysine 9 trimethylation within the Cyp2b10 locus. Transcriptional coactivator activating signal cointegrator-2 and histone demethylase jumonji domain containing 2D (JMJD2d) are involved in the CAR-dependent alteration of epigenetic memory. These studies imply that drug treatment of neonates or infants may have a lifelong effect on the rate of P450-mediated drug metabolism.
In this talk, we reported that the dose of drug and age of treatment in early life are two key factors for the persistent induction of gene expression and consequent increases of enzyme activities of several P450 genes in Cyp2b, Cyp2c, and Cyp3a subfamilies in adult mouse liver (Tien et al., 2015). When mice mature under normal conditions (no drug treatment in early life), their P450 expression follows the typical ontogenic pattern with increased expression with age (Peng et al., 2012). Exposure to a low dose of phenobarbital (<100 mg/kg) early in life (day 5) resulted in an acute induction of Cyp2b, Cyp2c, and Cyp3a, but P450 levels returned to baseline levels after a few days and were similar to livers from control mice at day 60. Exposure to high-dose phenobarbital (>200 mg/kg) in early life (day 5) resulted in a persistent induction of gene expression in mouse liver throughout adulthood (Fig. 2A). However, exposure to high-dose phenobarbital (>200 mg/kg) in later life (day 20) did not result in such persistent induction (Fig. 2B). In summary, we found that phenobarbital treatment in early life with a low dose (<100 mg/kg) did not change expression and enzyme activities of Cyp2b, Cyp2c, and Cyp3a in adult mouse liver, whereas phenobarbital treatment at a high dose (>200 mg/kg) significantly increased expression and enzyme activities of these P450s in adult mouse liver. Such persistent induction of P450 gene expression and enzyme activities in adult livers by phenobarbital treatment only occurs within a sensitive age window in early life. With consideration of species differences between mice and humans, these results should stimulate studies to reevaluate the long-term effects of drug treatment with different doses in neonates and infants, and the resulting interindividual variation in drug metabolism, therapeutic efficacy, and drug-induced toxicity throughout the rest of life.
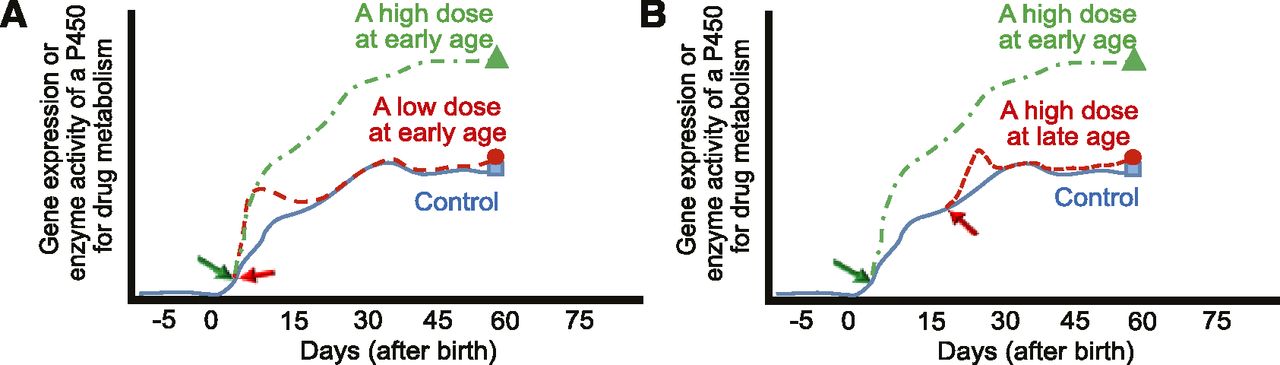
Models of the short- and long-term effect of phenobarbital exposure in early life on drug metabolism in mouse liver. (A) Effect of different doses of phenobarbital in early life. (B) Effect of high doses of phenobarbital at different developmental ages.
Interindividual Variability in CYP2D6-Mediated Drug Metabolism (H.J. and X.P.)
CYP2D6 is responsible for the metabolism of approximately 20% of clinically used medications and plays an important role in drug elimination. Notably, CYP2D6-mediated drug metabolism exhibits large interindividual variability (Sachse et al., 1997; Zanger et al., 2001). On the basis of CYP2D6 activity levels, an individual can be placed in one of four CYP2D6 phenotype categories: poor metabolizer intermediate metabolizer, extensive metabolizer, and ultra-rapid metabolizer (Hou et al., 1991; Dahl et al., 1992; Sachse et al., 1997; Zanger et al., 2001; Bertilsson et al., 2002). Genetic polymorphisms in CYP2D6 are known to explain part of the interindividual variability. For example, certain genetic polymorphisms in CYP2D6, linked with frame-shift mutations or splicing defects, lead to low or minimal expression of CYP2D6 protein or the expression of nonfunctional CYP2D6 protein. Carriers of these genetic polymorphisms present with the poor-metabolizer phenotype. To date, over 100 different genetic polymorphisms of CYP2D6 that are associated with decreased CYP2D6 expression or activity have been identified (http://www.cypalleles.ki.se). Despite accumulating data on how genetic polymorphisms of CYP2D6 lead to interindividual variability in CYP2D6-mediated metabolism, a large portion of CYP2D6 variability still remains unexplained, especially in subjects without the poor-metabolizer phenotype (i.e., >90% of population). Gaedigk et al. (2008) showed that for individuals carrying equivalently functional alleles of CYP2D6 (e.g., two copies of wild-type CYP2D6), phenotypic CYP2D6 activity levels (as measured by the urinary metabolic ratios of dextrorphan/dextromethorphan) were still highly variable. Consequently, one cannot reliably predict CYP2D6 activity levels in an individual based solely on CYP2D6 genotype, which thus presents an obstacle to the achievement of personalized medicine.
It was previously shown that the mRNA expression levels of CYP2D6 are well correlated with CYP2D6 activity levels (correlation coefficients range from 0.85 to 0.91) (Carcillo et al., 2003; Temesvári et al., 2012). The correlation coefficients between CYP2D6 mRNA and activity levels were comparable to those observed for CYP3A4, in which its expression and activity are governed at the transcriptional level. These results suggest that differential transcriptional regulation of CYP2D6 may explain part of the interindividual variability in CYP2D6-mediated drug metabolism. However, factors involved in the transcriptional regulation of CYP2D6 expression remain poorly defined. Better understanding of the regulation of CYP2D6 expression could potentially lead to identification of factors contributing to interindividual variability in CYP2D6 activity. The following is the summary of our recent work, in which we identified small heterodimer partner (SHP) as a novel regulator of CYP2D6 expression.
Accumulating clinical evidence indicates that CYP2D6-mediated drug metabolism is increased in pregnant women compared with postpartum controls (Högstedt et al., 1985; Wadelius et al., 1997; Tracy et al., 2005). The underlying mechanisms remained unknown, in part because of a lack of experimental models that can recapitulate CYP2D6 induction during pregnancy. For example, the homolog of CYP2D6 in rodents (e.g., rat CYP2D2) exhibited decreased, rather than increased, expression during pregnancy (Dickmann et al., 2008). CYP2D6-humanized transgenic (Tg-CYP2D6) mice were generated to study CYP2D6-mediated drug metabolism in vivo, and its genome harbors the human CYP2D6 along with its 2.5-kb upstream regulatory region (Corchero et al., 2001). We showed that CYP2D6 expression and activity was enhanced by 2- to 3-fold at term pregnancy compared with the prepregnancy or postpartum level in Tg-CYP2D6 mice (Koh et al., 2014), establishing these transgenic mice as a potential model to study regulation of CYP2D6 expression in pregnancy.
HNF4α is an abundant transcription factor belonging to the nuclear receptor family. HNF4α binds to DNA as a homodimer and regulates gene expression by recruiting coactivators. In the liver, HNF4α binds to approximately 40% of the actively transcribed genes in their regulatory regions (Odom et al., 2004) and plays a critical role in regulating expression of genes involved in key hepatic function such as glucose and lipid metabolism (Gonzalez, 2008). The nature of endogenous ligands for HNF4alpha remains controversial. Notably, studies have shown that HNF4α activity can be modulated by posttranslational modification of HNF4alpha, or interaction with other transcription factors (Gonzalez, 2008).
HNF4α governs the basal expression of CYP2D6 by binding to the proximal promoter region (Cairns et al., 1996); knockdown of hepatic expression of HNF4α led to a significant decrease in CYP2D6 expression (Corchero et al., 2001). To determine the potential involvement of HNF4α in CYP2D6 induction during pregnancy, the expression levels of HNF4α in livers of Tg-CYP2D6 mice were examined. The results showed that the mRNA or protein expression levels of HNF4α did not differ among different gestational time points (Koh et al., 2014). Interestingly, however, the HNF4α activity level (as reflected in the extent of HNF4α recruitment to the CYP2D6 promoter region; determined by chromatin immunoprecipitation assay) showed a significant increase at term pregnancy compared with the prepregnancy or postpartum level in Tg-CYP2D6 mice (Koh et al., 2014). Based on the findings that HNF4α activity can be modulated by its interaction with other transcription factors (Gonzalez, 2008), microarray experiments were performed to identify transcription factors whose expression was upregulated or downregulated at term pregnancy. This led to identification of SHP, a transcriptional corepressor, as a gene downregulated at term pregnancy in livers of Tg-CYP2D6 mice (Koh et al., 2014). Subsequent studies in HepG2 cells and Tg-CYP2D6 mice revealed that SHP represses CYP2D6 expression by decreasing HNF4α transactivation of the CYP2D6 promoter. For example, knockdown of SHP expression by using small interfering RNA in Tg-CYP2D6 mice led to enhanced hepatic CYP2D6 expression (Koh et al., 2014). In follow-up studies to identify the upstream regulators of SHP that are responsible for decreased SHP expression at term pregnancy, we found retinoids as a potential contributor. Retinoids are a class of compounds chemically related to vitamin A, which are essential for development and reproduction. All-trans retinoic acid (the bioactive form of vitamin A) was previously shown to induce SHP expression in HepG2 cells (Cai et al., 2010). In Tg-CYP2D6 mice, hepatic levels of all-trans retinoic acid exhibited an approximately 2-fold decrease at term pregnancy compared with the prepregnancy levels. Furthermore, administration of all-trans retinoic acid to nonpregnant Tg-CYP2D6 mice for 5 days led to decreased CYP2D6 and increased SHP expression (Koh et al., 2014). Importantly, these results illustrate how altered hepatic retinoid levels (e.g., during pregnancy) may modulate CYP2D6 expression.
SHP is a representative target gene of a bile acid sensor, FXR (Parks et al., 1999). When hepatic concentrations of bile acids are high (e.g., in cholestasis), the ligand-activated FXR transactivates the SHP promoter (Goodwin et al., 2000). SHP in turn represses the expression of genes involved in bile acid synthesis and uptake in the liver (e.g., CYP7A1), protecting the liver from the toxicity of excess bile acids (Li and Chiang, 2014). Whether FXR activation and subsequent changes in SHP expression could lead to altered CYP2D6 expression remained unknown. To characterize the effects of FXR activation on CYP2D6 expression, a synthetic agonist of FXR, GW4064 (3-[2-[2-chloro-4-[[3-(2,6-dichlorophenyl)-5-(1-methylethyl)-4-isoxazolyl]methoxy]phenyl]ethenyl]benzoic acid; Maloney et al., 2000), was administered to Tg-CYP2D6 mice for 5 days, and hepatic CYP2D6 expression was examined. The results showed that GW4064 significantly increased SHP expression by approximately 2-fold, and this was accompanied by an approximately 2-fold decreases in the expression and activity levels of CYP2D6 in the mice (Pan et al., 2015). The decrease in CYP2D6 expression by GW4064 was abrogated in mice without SHP expression [i.e., Shp(−/−);CYP2D6 mice], indicating an essential role of SHP in GW4064 action on CYP2D6 expression. The effects of FXR activation (and subsequent SHP induction) on CYP2D6 expression were further examined by using an estrogen-induced cholestasis model. Ethinyl estradiol was administered to Tg-CYP2D6 mice at a high dose (10 mg/kg) for 5 days, and CYP2D6 expression was examined. Cholestasis triggered by ethinyl estradiol led to a 2- to 3-fold decrease in CYP2D6 expression and an approximately 2-fold increase in SHP expression in the mice (Pan and Jeong, 2015). The repressive effects of GW4064 and bile acids on CYP2D6 expression were also observed in primary human hepatocytes (Pan et al., 2015), suggesting that the action of SHP modulators on CYP2D6 expression is conserved between humans and mice. Together, the results indicate that FXR activation by drugs or bile acids represses CYP2D6 expression through upregulating SHP.
These studies have demonstrated that SHP modulators, including bile acids and retinoids, alter CYP2D6 expression (Fig. 3). Whether differential hepatic levels of SHP modulators contribute to interindividual variability in CYP2D6 activity remains unknown. Of note, hepatic levels of vitamin A and bile acids exhibit approximately 300-fold and approximately 100-fold variability, respectively (Ukleja et al., 2002; Bentayeb et al., 2008; García-Cañaveras et al., 2012). The extent of CYP2D6 variability explained by these SHP modulators and their contribution to CYP2D6 variability (relative to that by the genetic variations of CYP2D6 gene) are yet to be defined.
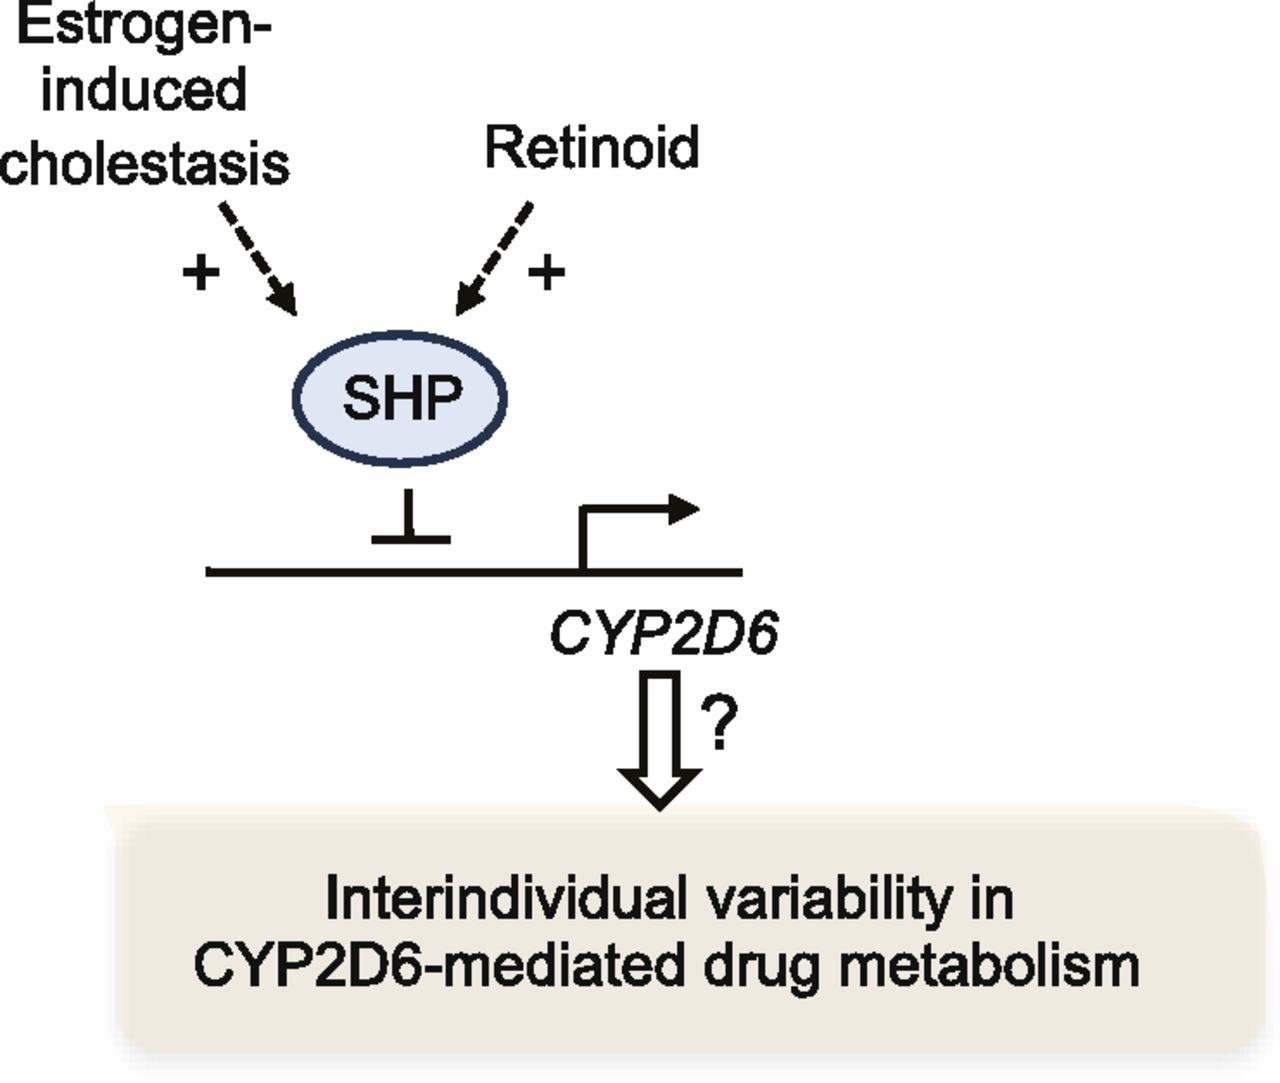
Differential transcriptional regulation of CYP2D6 through modulation of SHP expression may explain part of interindividual variability in CYP2D6-mediated drug metabolism.
Biomarkers of P450 Activity Using Metabolomic Approaches (L.M.S., J.T.-S., and Y.S.L.)
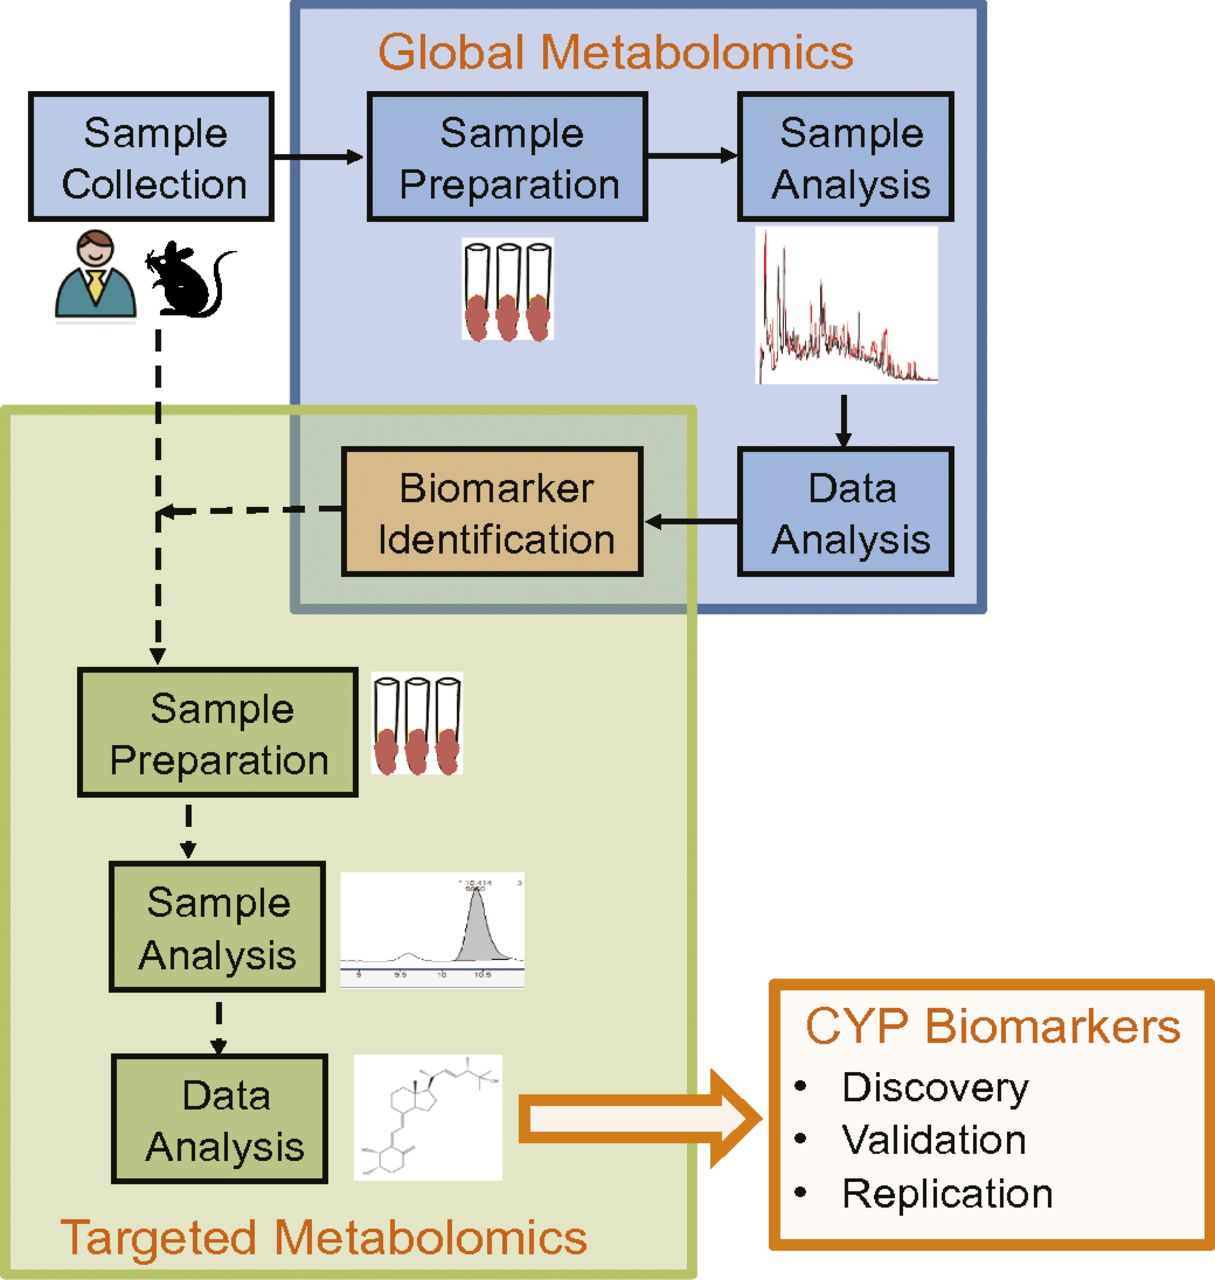
Interindividual variability in enzyme content or activity affects systemic drug exposure and, potentially, drug efficacy and safety. It is generally accepted that CYP3A and CYP2D6 account for the metabolic elimination of approximately 65% of drugs that undergo metabolism (Wienkers and Heath, 2005). In addition, because CYP3A is localized in the liver and small intestine, CYP3A activity contributes extensively to first-pass and systemic metabolism for many drugs. To estimate hepatic and intestinal activity for CYP3A substrates, intravenous and oral doses of probe drugs are required. Phenotyping with a probe drug is a routine, albeit time-consuming, process to determine the in vivo activity of P450 enzymes. An alternative method of assessing P450 activity is the use of urinary or plasma biomarkers, which may eliminate the risks associated with exogenous drug administration, involves less invasive sampling, and may be more acceptable to patients or study subjects. The application of metabolomics—the comprehensive analysis of small molecules in a biologic sample—can be used to explore P450 activity. In general, metabolomic analyses can be classified as targeted or global approaches (Fig. 4). For CYP3A and CYP2D6, examples of biomarkers determined by targeted and global metabolomics are discussed briefly and are summarized in Tables 1 and 2.

Workflow for global and targeted metabolomics analyses to determine biomarkers of P450 activity. CYP, cytochrome P450.
Examples of possible endogenous biomarkers of CYP3A activity
Examples of possible endogenous biomarkers of CYP2D6 activity
Biomarkers of CYP3A Activity.
Targeted analyses are focused on a small number of metabolites selected a priori to study P450 activity. Some endogenous markers have been in use for decades, such as the urinary 6β-hydroxycortisol/cortisol metabolic ratio (reviewed in Galteau and Shamsa, 2003), whereas others such as 4β-hydroxycholesterol or 4β,25-dihydroxyvitamin D3 were identified more recently (Bodin et al., 2001; Wang et al., 2012). Because the formation and subsequent excretion of cortisol follows a diurnal pattern, the 6β-hydroxycortisol/cortisol ratio determined over a long urine collection interval (e.g., 24 hours) is typically reported, rather than the concentration of metabolite alone (Ohno et al., 2000; Hu et al., 2009; Luo et al., 2009). Despite numerous studies with urinary 6β-hydroxycortisol, several reports demonstrate a lack of correlation with CYP3A substrates, especially under basal conditions (Chen et al., 2006; Luo et al., 2009; Dutreix et al., 2014). Other metrics of cortisol and its metabolites have been explored, such as the formation clearance of 6β-hydroxycortisol and a summed formation clearance of 6β-hydroxycortisol and 6β-hydroxycortisone (Luo et al., 2009; Peng et al., 2011). Because 6β-hydroxycortisol was found to be a substrate of the renal organic anion transporter 3, urinary 6β-hydroxycortisol/cortisol metabolic ratios may be affected if organic anion transporter 3 function is altered (Imamura et al., 2014).
Elevated plasma 4β-hydroxycholesterol levels were first identified in patients treated with antiepileptic drugs that induced CYP3A activity (Bodin et al., 2001). Since the initial study, plasma 4β-hydroxycholesterol and occasionally the 4β-hydroxycholesterol/cholesterol ratio have been studied after rifampin induction (Goodenough et al., 2011; Björkhem et al., 2013; Shin et al., 2013) and with inhibitors such as ketoconazole (Goodenough et al., 2011; Shin et al., 2013). Overall, rigorous validation of 4β-hydroxycholesterol as a CYP3A marker has been yet to be performed. However, a major drawback of 4β-hydroxycholesterol as a biomarker is its very long half-life (approximately 17 days; Diczfalusy et al., 2009), which may preclude its use in short-term drug–drug interaction studies or when CYP3A activity is changing rapidly.
Given the knowledge of CYP3A-dependent metabolic pathways, Shin et al. (2013) studied larger sets of steroids as potential CYP3A biomarkers. This study employed targeted profiling on an expanded scale to identify steroids that correlated with the systemic clearance of midazolam (Table 1). The investigators predicted midazolam clearance under basal, ketoconazole-inhibited, and rifampin-induced conditions using CYP3A5 genotype, dehydroepiandrosterone (DHEA) concentration, the 7β-hydroxy-DHEA/DHEA ratio, and the 6β-hydroxycortisone/cortisone ratio (r2 = 0.70). Although a substantial portion of the variability was predicted by these factors, the inhibited midazolam clearance was overpredicted for nearly all subjects, and the induced midazolam clearance was less accurately predicted (Shin et al., 2013). Thus, further refinement and validation of these steroid markers is needed.
Compared with the previous approaches, a global metabolomic analysis captures data on thousands of analytes simultaneously using nuclear magnetic resonance, gas chromatography/mass spectrometry, or liquid chromatography/mass spectrometry methodologies. Although no global metabolomics studies have been reported looking at basal CYP3A levels, Rahmioglu et al. (2011) used global metabolomics to predict the inducibility of CYP3A4 as determined by the urinary quinine parent-to-metabolite ratio after treatment with St. John’s wort, and Kim et al. (2013) studied altered urinary steroids after induction with rifampin. In both studies, the metabolome was extensively altered by PXR induction (Table 1). Because PXR can regulate numerous genes (e.g., other P450s, some phase II enzymes, and transporters as reviewed in Chai et al., 2013), alterations in levels of some of the listed compounds are likely the result of the induction of genes other than CYP3A4. Further in vitro and in vivo experiments are necessary to verify whether these compounds are truly CYP3A substrates or products, and to determine their utility as biomarkers of CYP3A4 activity.
Biomarkers of CYP2D6 Activity.
The number of identified endogenous substrates or products is more limited for CYP2D6 (Table 2). Much of the identification of substrates and products of CYP2D6 activity was performed using recombinant enzymes or microsomes. Many of these compounds are thought to be involved in neurologic function, including pinoline, 5-methoxy-N,N-dimethyltryptamine, 5-methoxytryptamine, and anandamide (Yu et al., 2003a,b; Snider et al., 2008).
A global metabolomics study was performed in CYP2D6-Tg mice and control mice to identify differences in the metabolome of brain homogenate and cerebrospinal fluid in these two strains of mice (Cheng et al., 2013). Compounds that were increased in CYP2D6-Tg mouse brain included pantothenic acid, l-carnitine, acetyl-l-carnitine, and serotonin. Compounds that were increased in CYP2D6-Tg mouse cerebrospinal fluid included 2′-deoxycytidine diphosphate, N-acetylglucosaminyl-amine, anandamide, l-carnitine, citric acid, and a compound with the formula C6H12O6. Stearoyl-l-carnitine was decreased in the cerebrospinal fluid of these mice (Cheng et al., 2013). To date, no data are available in humans to corroborate these potential CYP2D6 biomarkers identified by in vitro methods or in mice.
We recently reported the detection and validation of M1, an unknown ion (mass-to-charge ratio of 444.3), that distinguished CYP2D6 poor metabolizers from other phenotypes in urine samples from 189 pediatric subjects (Tay-Sontheimer et al., 2014). Because M1 was absent in the urine of CYP2D6 poor metabolizers and present in the urine of all other CYP2D6 phenotypes, our data suggest that M1 may be a product of a reaction catalyzed by CYP2D6. In a healthy adult volunteer study, urinary M1 decreased by 9-fold after potent CYP2D6 inhibition with multiple doses of fluoxetine, and urinary M1 levels were negatively correlated with CYP2D6 activity as determined by the urinary dextromethorphan/dextrorphan ratio (P = 0.012). Although the structure of M1 is still unknown, this was the first study to demonstrate the detection of an endogenous biomarker of CYP2D6 activity in humans using a global metabolomics approach.
In summary, the discovery of biomarkers for P450 activity spans targeted assays to a shotgun approach. The key advantages of these endogenous biomarkers are that they can be used in difficult-to-study populations such as children or pregnant women or in patients for whom giving a probe drug is not feasible, or they can be used to perform retrospective studies or predict the potential for drug–drug interactions in first-in-human studies. However, there are important considerations and limitations of the use of endogenous biomarkers. Biomarkers will likely reflect systemic P450 levels but may not reflect intestinal P450 levels (e.g., hepatic, but not intestinal, expression of CYP3A). Thus, the prediction of P450-mediated first-pass metabolism by biomarkers may be difficult. Some biomarkers exhibit diurnal variation (e.g., cortisol) and a sufficient urine collection interval, such as 24 hours, may be necessary to obtain a robust estimate of the urinary metabolic ratio (Hu et al., 2009). If the biomarker is to be used to inform dosing decisions, a long urine collection interval may be impractical. In many instances, additional in vitro and in vivo studies are needed to validate proposed endogenous biomarkers. Unlike probe drugs, the formation of specific metabolites from endogenous compounds may be catalyzed by more than one enzyme (e.g., hydroxy- and epoxy-eicosatrienoic acid ethanolamide metabolites from anandamide; Snider et al., 2008), which may complicate the interpretation of circulating concentrations or urinary metabolic ratios of endogenous compounds. Furthermore, the extent that these biomarkers reflect P450 activity from neonates to elderly persons or in various disease states should be explored. The ultimate goal would be to develop a panel of validated endogenous markers to support the “precision” dosing of drugs with a narrow therapeutic range or to monitor P450-related changes attributable to disease, age, genetics, or pregnancy.
Authorship Contributions
Wrote or contributed to the writing of the manuscript: Tracy, Chaudhry, Prasad, Thummel, Schuetz, Zhong, Tien, Jeong, Pan, Shireman, Tay-Sontheimer, Lin.
Footnotes
- Received October 16, 2015.
- Accepted December 16, 2015.
All authors contributed equally to this work.
This research was supported by the National Institutes of Health Eunice Kennedy Shriver National Institute of Child Health and Human Development [Grants R01HD065532 and R01HD058556]; the National Institutes of Health National Institute of General Medical Sciences [Grants T32GM007750, R01GM112746, and R01GM087376]; the National Institutes of Health National Institute of Environmental Health Sciences [Grants P30ES007033 and R01ES019487]; and the National Institutes of Health National Center for Advancing Translational Sciences [Clinical and Translational Science Awards TR000423, TR000421, and TR000001].
Abbreviations
- CAR
- constitutive androstane receptor
- DHEA
- dehydroepiandrosterone
- FOX
- forkhead box protein
- FXR
- farnesoid X receptor
- GW4064
- 3-[2-[2-chloro-4-[[3-(2,6-dichlorophenyl)-5-(1-methylethyl)-4-isoxazolyl]methoxy]phenyl]ethenyl]benzoic acid
- HNF
- hepatocyte nuclear factor
- P450
- cytochrome P450
- PXR
- pregnane X receptor
- SHP
- small heterodimer partner
- SNP
- single nucleotide polymorphism
- TCPOBOP
- 1,4-bis-[2-(3,5-dichloropyridyloxy)]benzene,3,3′,5,5′-tetrachloro-1,4-bis(pyridyloxy)benzene
- Tg-CYP2D6
- CYP2D6-humanized transgenic
- UTR
- untranslated region
- Copyright © 2016 by The American Society for Pharmacology and Experimental Therapeutics
References
In this issue


Jump to section
- Article
- Abstract
- Introduction
- Genetic Predictors of P450 Expression and Activity (E.G.S., B.P., K.E.T., and A.S.C.)
- Effects of Drug Treatment at Early Life on Interindividual Variations of P450-Mediated Drug Metabolism in Adult Liver (X.Z. and Y.-C.T.)
- Interindividual Variability in CYP2D6-Mediated Drug Metabolism (H.J. and X.P.)
- Biomarkers of P450 Activity Using Metabolomic Approaches (L.M.S., J.T.-S., and Y.S.L.)
- Authorship Contributions
- Footnotes
- Abbreviations
- References
- Figures & Data
- Info & Metrics
- eLetters