


Abstract
Bosentan is a substrate of hepatic uptake transporter organic anion–transporting polypeptides (OATPs), and undergoes extensive hepatic metabolism by cytochrome P450 (P450), namely, CYP3A4 and CYP2C9. Several clinical investigations have reported a nonlinear relationship between bosentan doses and its systemic exposure, which likely involves the saturation of OATP-mediated uptake, P450-mediated metabolism, or both in the liver. Yet, the underlying causes for the nonlinear bosentan pharmacokinetics are not fully delineated. To address this, we performed physiologically based pharmacokinetic (PBPK) modeling analyses for bosentan after its intravenous administration at different doses. As a bottom-up approach, PBPK modeling analyses were performed using in vitro kinetic parameters, other relevant parameters, and scaling factors. As top-down approaches, three different types of PBPK models that incorporate the saturation of hepatic uptake, metabolism, or both were compared. The prediction from the bottom-up approach (models 1 and 2) yielded blood bosentan concentration-time profiles and their systemic clearance values that were not in good agreement with the clinically observed data. From top-down approaches (models 3, 4, 5-1, and 5-2), the prediction accuracy was best only with the incorporation of the saturable hepatic uptake for bosentan. Taken together, the PBPK models for bosentan were successfully established, and the comparison of different PBPK models identified the saturation of the hepatic uptake process as a major contributing factor for the nonlinear pharmacokinetics of bosentan.
Introduction
Bosentan is a dual endothelin (ET) receptor antagonist and is indicated for the treatment of patients with pulmonary arterial hypertension (Rubin et al., 2002; Dingemanse and van Giersbergen, 2004; Galiè et al., 2008). Several clinical investigations have so far reported apparently opposing results in regard to a nonlinear relationship between intravenous and oral administration of bosentan and its systemic exposure in humans. When single intravenous bosentan doses ranging from 10 to 750 mg were administered to healthy volunteers, the systemic plasma clearance of bosentan decreased with increasing doses (10.8 and 5.7 l/h for the bosentan doses of 10 and 750 mg, respectively) (Weber et al., 1996). In the case of oral dosing, the systemic exposure of bosentan increased in a dose-proportional manner up to 600-mg doses of bosentan in healthy volunteers. However, with oral doses of bosentan greater than 600 mg, the fold increases in the systemic exposure [i.e., Cmax, and areas under the plasma concentration-time curve (AUCs)] were less than dose proportional (Weber et al., 1996). After repeated oral dosing of 500 mg of bosentan, the plasma clearance of bosentan was increased by approximately 2-fold, accompanied by an approximately 1.7-fold increase in 24-hour urinary excretion of 6β-hydroxycortisol, indicating autoinduction of bosentan metabolism mediated by CYP3A4 (Weber et al., 1999c).
Bosentan has also been associated with various cases of drug interactions when coadministered with drugs that inhibit/induce some cytochrome P450 (P450) enzymes and/or hepatic uptake transporter organic anion–transporting polypeptides (OATPs). For example, the systemic exposure of bosentan at the steady state was increased approximately 4-fold and 2-fold by coadministration of clarithromycin and ketoconazole, respectively (van Giersbergen et al., 2002; Markert et al., 2014). After the second concomitant dosing of bosentan with cyclosporine, average trough concentrations of bosentan were 31-fold higher than those after the first dosing of bosentan (Binet et al., 2000). In the case of rifampin coadministration, the changes in the bosentan pharmacokinetics (PKs) depended on the number of rifampin dosing (van Giersbergen et al., 2007). The systemic exposure of bosentan markedly increased after the single rifampin dose coadministered, but significantly decreased after multiple rifampin doses. The cases of drug interactions are also reported for bosentan when coadministered with simvastatin (Dingemanse et al., 2003) and warfarin (Weber et al., 1999a). These complex drug interactions with bosentan likely involve the saturation of OATP-mediated uptake, P450-mediated metabolism, or both in the liver, yet a detailed mechanistic understanding has been lacking.
Several clinical and nonclinical studies provided the evidence supporting the involvement of P450 enzymes and OATPs in the disposition of bosentan. A clinical study with 14C-labeled bosentan (Weber et al., 1999b) indicated extensive hepatic elimination of bosentan with minor renal and fecal excretion. The two major metabolites hydroxyl bosentan and desmethyl bosentan are reported to be produced mainly by CYP3A4/CYP2C9 and by CYP3A4, respectively (Dingemanse and van Giersbergen, 2004). Bosentan is also a substrate of OATP1B1, OATP1B3, and OATP2B1 (Treiber et al., 2007; Jones et al., 2012). In rats, PK interactions between bosentan and cyclosporine A were reported with the proposed mechanism involving the inhibition of hepatic uptake of bosentan by cyclosporine A (Treiber et al., 2004).
Physiologically based PK (PBPK) modeling has increasingly shown its utility in providing the kinetic and mechanistic insights into nonlinear PKs and complex drug interactions (Fan et al., 2010; Watanabe et al., 2010; Rowland et al., 2011). In the current study, we developed PBPK models for analyzing the systemic nonlinear PKs of bosentan after its intravenous administration at different doses by incorporating saturable processes of hepatic uptake, metabolism, or both via bottom-up and top-down approaches.
Materials and Methods
Materials.
Bosentan was purchased from the Cayman Chemical Company (Ann Arbor, MI). Bosentan-d4, hydroxyl bosentan, and desmethyl bosentan were purchased from Toronto Research Chemicals Inc. (Toronto, ON, Canada). Pooled cryopreserved human hepatocytes from 20 mixed-sex donors (Caucasian, 14 donors; Hispanic, 4 donors; and black, 2 donors) were purchased from Veritas (Tokyo, Japan). Pooled human liver microsomes from mixed-sex donors were purchased from Corning Japan (Tokyo, Japan). All other chemicals and reagents were readily available from commercial sources.
Kinetic Parameters for Bosentan Uptake (Human Cryopreserved Hepatocytes).
Uptake studies using human cryopreserved hepatocytes were performed using a rapid separation method, as described previously (Shitara et al., 2003). Briefly, cryopreserved hepatocytes were thawed out, washed, and resuspended in Krebs Henseleit buffer (at a density of 2 × 10⁶ cells/ml). After preincubation at 37°C for 5 minutes, bosentan uptake was initiated by adding an equal volume of bosentan-containing buffer (the final concentrations of 0.6, 3, 6, 10, 30, or 100 μM) to the hepatocyte suspensions. After incubation at 37°C for 0.5, 1.5, or 3 minutes, the reaction was terminated by separating the cells from the bosentan solution. The separation was performed using tubes containing 50 μl of 2.5 M ammonium acetate under a layer of 100 μl of oil mixture (a mixture of silicone oil and mineral oil; density = 1.015). After centrifugation at 2000g for 30 seconds, tubes were snap frozen immediately and kept at −80°C until analysis. After thawing on ice, the centrifuge tube was cut below the oil layer and cells were resuspended in 40 μl of water. This suspension was transferred to another tube containing an internal standard and acetonitrile, and sonicated for 4.5 minutes using a Bioruptor sonication device (Cosmo Bio Co., Ltd., Tokyo, Japan). After centrifugation at 15,000g for 5 minutes, the resulting supernatant was diluted 2-fold with 0.1% formic and subjected to liquid chromatography-tandem mass spectrometry (LC-MS/MS) analysis. Bosentan uptake into the hepatocytes was expressed as the uptake volume of bosentan [in microliters per 106 cells (the bosentan amount detected divided by the bosentan concentration in the assay buffer)]. The initial uptake velocity of bosentan was calculated from the slope of the uptake volume obtained from 0.5 to 3 minutes and was expressed as the uptake clearance (in microliters per minute per 106 cells). The kinetic parameters for the bosentan uptake of bosentan were calculated using the following equation: where v is the initial uptake rate (in picomoles per minute per 106 cells), S is the substrate concentration (micromolar), Vmax,uptake is the maximum uptake rate (in picomoles per minute per 106 cells), Km,uptake is the Michaelis constant of uptake (micromolar), and PSdif (microliters per minute per 106 cells) is the passive diffusion clearance.
The hepatic intracellular unbound fraction (fH) was calculated as described previously (Yoshikado et al., 2016). Briefly, the hepatocyte suspensions (2.0 × 10⁶ cells/ml) were incubated with an equal volume of buffer containing bosentan (the final concentration, 1 μM) on ice for 0.5, 15, 30, or 60 minutes, and cells were separated and processed using the same method as described above. Bosentan levels in cell lysates and medium were quantified by LC-MS/MS. It was assumed that the active transport and membrane potential were abolished on ice and that the protein unbound fraction in the medium was 1. Using the values at 60 minutes (when the uptake was presumed be at the steady state), fH was calculated using the following equation: where Ccell(−) and Cmedium(−) are the total bosentan concentrations in the cell and medium measured on ice at 60 minutes, respectively; and Cu,cell(−) and Cu,medium(−) are the unbound bosentan concentrations in the cell and medium, respectively.
Kinetic Parameters for Bosentan Metabolism (Human Liver Microsomes).
The kinetic parameters for bosentan metabolism were assessed by monitoring the generation of both hydroxyl bosentan and desmethyl bosentan. The reaction mixture was prepared with pooled human liver microsomes (final concentration, 2 mg/ml) and 100 mM phosphate buffer containing bosentan (final concentrations, 2, 4, 10, 25, 60, or 150 μM). After preincubation at 37°C for 5 minutes, the reaction was initiated by the addition of a NADPH-generating system (final concentrations: 0.5 mM β-NADPH, 5 mM glucose 6-phosphate, 1 U/ml glucose-6-phosphate dehydrogenase, and 3 mM MgCl2). The reaction was terminated by the addition of two equivalent volumes of ice-cold, acetonitrile containing an internal standard, followed by brief vortexing. After centrifugation at 13,000g for 10 minutes, the resulting supernatant was diluted with 0.1% formic acid and subjected to LC-MS/MS analysis.
The Michaelis constant of metabolism [Km,met (micromolar)], the maximum velocity of metabolism [Vmax,met (in picomoles per minute per milligram protein)], and nonsaturable metabolic clearance [CLmet, nonsaturation (microliters per minute per 106 cells)] were calculated using the following equation (fitting was performed using the nonlinear least-squares method): where v is the initial velocity (in picomoles per minute per milligram protein) and S is the substrate concentration (micromolars).
LC-MS/MS Analysis.
To quantify bosentan, hydroxyl bosentan, and desmethyl bosentan, the LC-MS/MS analyses were performed using a Nexera X2 separating module (Shimadzu Co., Kyoto, Japan) equipped with an LCMS-8040 Mass Spectrometer (Shimadzu Co.) with an electron ion spray interface. The mass spectrometer was operated in the multiple reaction–monitoring mode using the respective MH+ ions: charge/mass ratio (m/z) 552 → m/z 202 for bosentan, m/z 568 → m/z 202 for hydroxyl bosentan, m/z 538 → m/z 494 for desmethyl bosentan, and m/z 556 → m/z 202 for bosentan-d4. The mobile phase was 55% acetonitrile containing 0.1% formic acid, and the flow rate was 0.2 ml/min with the stationary phase, a C18 column (Kintex C18, 2.1 × 100 mm, 2.6 μm; Phenomenex Inc., Torrance, CA) at 40°C.
Parameter Optimization by Nonlinear Least Squares Fitting.
All fitting and simulation analyses were performed using a multiple-purpose nonlinear least-squares fitting computer program, Napp (version 2.31; available from http://plaza.umin.ac.jp/∼todaiyak/download.php) (Hisaka and Sugiyama, 1998). Differential equations were numerically solved using the Runge-Kutta-Fehlberg method. To evaluate the goodness of the fit, the sum of the weighted squared residuals (WSS) and Akaike information criterion (AIC) were calculated using the following equations: where yi is the ith observed value; and y′i is the ith predicted value.
 where n is the number of observations; and m is the number of estimated parameters in the model.
Structure of the PBPK Models for Bosentan.
Figure 1 shows the structure of the PBPK model for bosentan administered as an intravenous bolus. Similar to the basic model reported previously (Yoshikado et al., 2016), the current model consists of the central compartment connected with the liver. Given that bosentan is a lipophilic drug (octanol/water partition coefficients is 3.4), our PBPK model included three large-volume tissues (i.e., adipose, muscle, and skin) where lipophilic drugs tend to have considerable distribution. Rapid equilibrium distribution in these tissues was also assumed given that bosentan was reported neither for particularly slow tissue distribution nor for its interactions with transporters in nonhepatic organs. The partition coefficient between these tissues and blood was calculated using the method reported by Rodgers and Rowland (2006). The liver compartment was divided into five units of extrahepatic and hepatocellular compartments. Previously, this five-compartment liver model was shown to mimic the realistic hepatic disposition based on the dispersion model, whereas it is mathematically simpler than the dispersion model (Watanabe et al., 2009). Extrahepatic compartments were linked tandemly by blood flow, transporter-mediated active uptake clearance (PSact), passive diffusion influx clearance (PSdif,inf), as well as passive diffusion efflux clearance (PSdif,eff) were incorporated. It was assumed that hepatic uptake intrinsic clearance is determined by the sum of PSact and PSdif,inf, and that hepatic intrinsic efflux clearance from hepatocytes to blood is determined by PSdif,eff. Hepatic intrinsic metabolic clearance (CLint,met) was incorporated in each hepatocellular compartment. Renal clearance (CLr) from the central compartment was also incorporated, although CLr is much lower than nonrenal clearance (fraction excreted unchanged in urine is about 0.008 in human) (Weber et al., 1996). Although bosentan was reported to be a substrate of multidrug resistance–associated protein 2 (Fahrmayr et al., 2013), active efflux from hepatocytes into bile was not included in the PBPK model. This was based on the reports suggesting that multidrug resistance–associated protein 2–mediated efflux may play a minimal role in bosentan PKs in humans: 4% of a bosentan dose was found in feces in an unchanged form after intravenous dosing in healthy volunteers (Weber et al., 1999b), and the absolute bioavailability of bosentan is ∼0.5 (Weber et al., 1996). Differential equations for the constructed PBPK model are provided in the Supplemental Material.
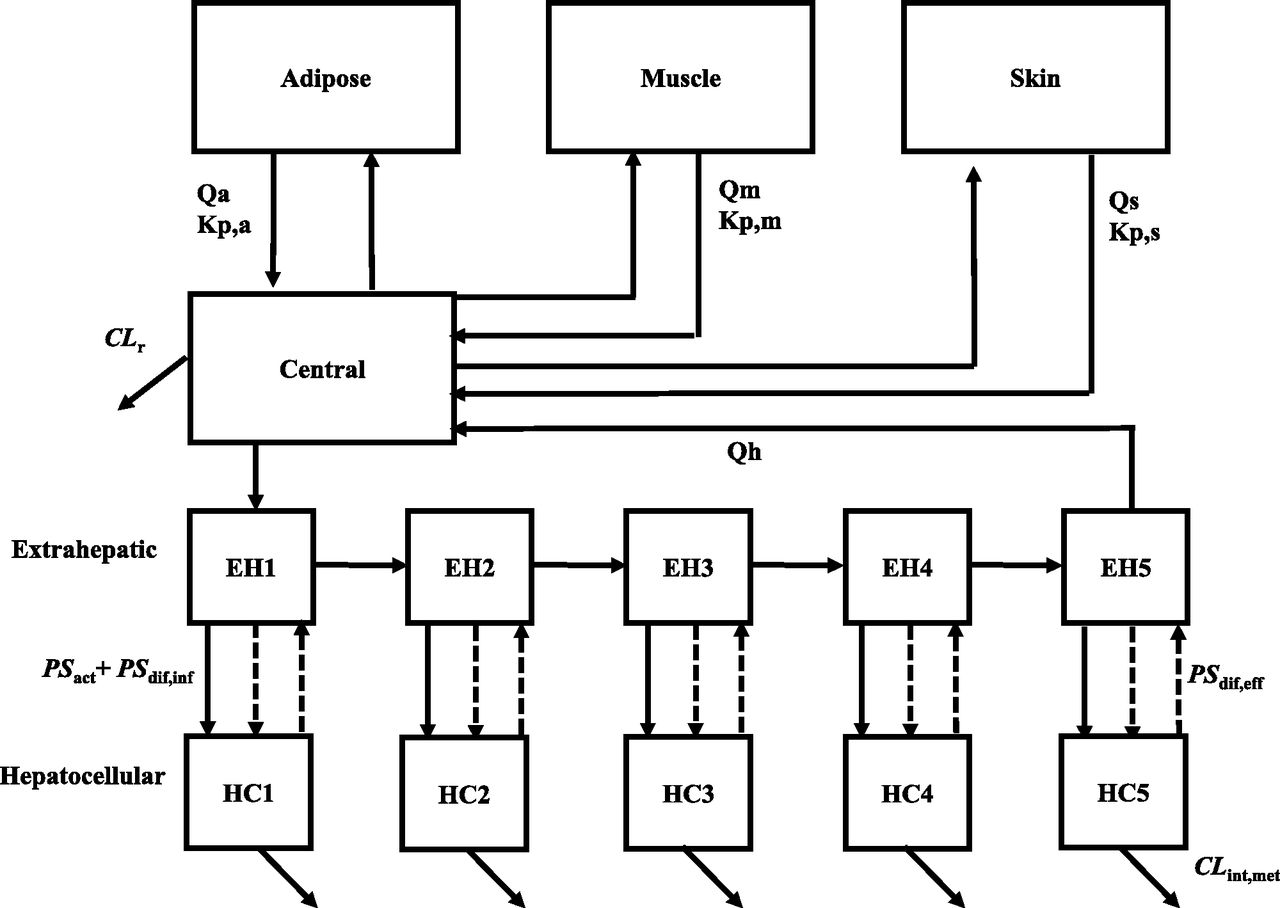
The structure of the constructed PBPK model for bosentan after intravenous bolus dosing in humans. EH, Extrahepatic; HC, hepatocellular; Kp,a, Kp,m, and Kp,s, the partition coefficient between adipose, muscle, and skin; Qa, Qm, and Qs, blood flow rate in adipose, muscle and skin.
All physiologic and kinetic parameters used are listed in Table 1. Tissue volume was converted to tissue weight with the assumption that the tissue density is 1 g/ml. fH is fixed at the value determined by in vitro study on ice, which is shown to be consistent with that estimated at 37°C using human liver homogenates (Yoshikado et al., 2017). In all analyses conducted in this study, PSdif,eff was calculated by the following equation, as described previously (Yoshikado et al., 2016): The γ value was calculated to be 0.243 at 37°C with consideration of the following: 1) the ratio of the membrane permeability by passive diffusion of an ionized form of the drug to that of its unionized form (obtained from in vitro experiments that examine pH-dependent membrane permeability); 2) the concentration ratio of an ionized form of the drug to its unionized form, derived from the Henderson-Hasselbalch equation (intracellular pH 7.2; extracellular pH 7.4); and 3) the membrane potential estimated from the Nernst equation (Yoshikado et al., 2016).
Physiologic and kinetic parameters used for PBPK modeling
The kinetic parameters experimentally obtained from in vitro studies are presented as the mean ± S.D., unless otherwise indicated.
Both bottom-up and top-down approaches were used for the current PBPK modeling analyses (summarized in Table 2). As bottom-up approaches, simulation analyses were performed using the kinetic parameters extrapolated from in vitro to in vivo using biologic scaling factors (model 1) or those obtained by fitting (model 2). Detailed description on the handling of various parameters is included in the Supplemental Material. As top-down approaches (models 3, 4, and 5), we performed simultaneous fitting analyses of the PBPK models that incorporate saturation processes for PSact, CLint,met, or both to blood bosentan concentration-time profiles using the following equations; the PSact saturation model (models 3 and 5): where fB is the unbound fraction in blood, CHEi is the concentration in ith extrahepatic compartment, and CHCi is the concentration in ith hepatocellular compartment CLint,met is the saturation model (models 4 and 5):
 Tables 2 and 3 summarize the characteristics of the PBPK models used and the initial value as well as the lower and upper limits (range) of each parameter for optimizing kinetic parameters, respectively.
Comparison of the PBPK models used in the current study
Parameter values used for PBPK modeling
Each parameter is presented as the mean ± S.D., unless otherwise indicated.
Monte Carlo Simulation of Bosentan Blood Concentration Profiles.
One set of blood bosentan concentration-time profiles for six virtual subjects (same as those in the previous report Weber et al., 1996) were generated from Monte Carlo simulation based on the constructed PBPK model (model 3), and the same process was repeated 40 times to generate additional sets. The CV values for in vivo Vmax,uptake, in vivo Km,uptake, and in vivo PSdif (those displaying interindividual variability) were set as 25.8%, 25.8%, and 10% as per the previously reported modeling methodologies (Kato et al., 2003; Ito et al., 2017; Toshimoto et al., 2017), and that for in vivo metabolic clearance (CLmet) was set as 33%, as reported previously (Kato et al., 2010). For parameters displaying intraindividual variability, proportional CV values were set as 24.8% (Volz et al., 2017). The in vivo Vmax,uptake, in vivo Km,uptake, in vivo PSdif, and in vivo CLmet parameters were assumed to follow a log-normal distribution.
Results
Kinetic Parameters of Bosentan Uptake and Metabolism from In Vitro Studies.
The uptake of bosentan by human hepatocytes was proportional to time at least up to 3 minutes after the onset of incubation in all bosentan concentrations (data not shown). Thus, the uptake rates were calculated from this linear part of the time-uptake curves using differing bosentan concentrations and used to prepare the Eadie-Hofstee plot (Fig. 2) and to obtain the kinetic parameters (Table 1). PSact (calculated from Vmax/Km under the unsaturated conditions) was 35.6 μl/min per 106 cells, approximately 12 times higher than PSdif,inf. The fH was obtained from the steady-state uptake study under ice-cold conditions and determined to be 0.0696 ± 0.0068 (Table 1). Similarly, the Eadie-Hofstee plots and the kinetic parameters for the production of hydroxyl bosentan and desmethyl bosentan by human liver microsomes were obtained (Fig. 3; Table 1). Under the unsaturated condition, the in vitro intrinsic metabolic clearance for the production of hydroxyl bosentan and desmethyl bosentan (calculated from Vmax/Km) were 2.56 and 1.57 μl/min per milligram microsomal protein, respectively.

Eadie-Hofstee plot of bosentan uptake by cryopreserved human hepatocytes. v and v/s represent the initial uptake velocity of bosentan and uptake clearance of bosentan, respectively. The initial uptake velocity of bosentan was calculated using the uptake volume obtained between 0.5 and 3 minutes. The solid line represents the fitted curve via nonlinear least-squares methods. Each point represents the mean ± S.D. The inset panel shows the “v vs. c” curve of bosentan uptake by cryopreserved human hepatocytes.

Eadie-Hofstee plots of bosentan metabolism using human microsomes: the production of hydroxyl bosentan (A) and desmethyl bosentan (B). v and v/s represent the initial velocity of bosentan metabolism and metabolic clearance of bosentan, respectively. The initial velocity of these metabolites was calculated using the production volume obtained after 3-minute incubation. The solid line represents the fitted curve by nonlinear least-squares methods. Each point represents the mean ± S.D. The inset panel shows the “v vs. c” curve of bosentan metabolism using human microsomes.
PBPK Modeling Via Bottom-Up Approaches (Models 1 and 2).
For model 1, the blood concentration-time profiles of bosentan were simulated using the kinetic parameters of hepatic uptake and metabolism obtained from in vitro studies and extrapolated using biologic scaling factors. The predicted blood concentrations of bosentan were consistently higher than the reported values at nearly all time points for every dose level (Fig. 4A), resulting in the underprediction of the total body clearances compared with the observed in vivo values.
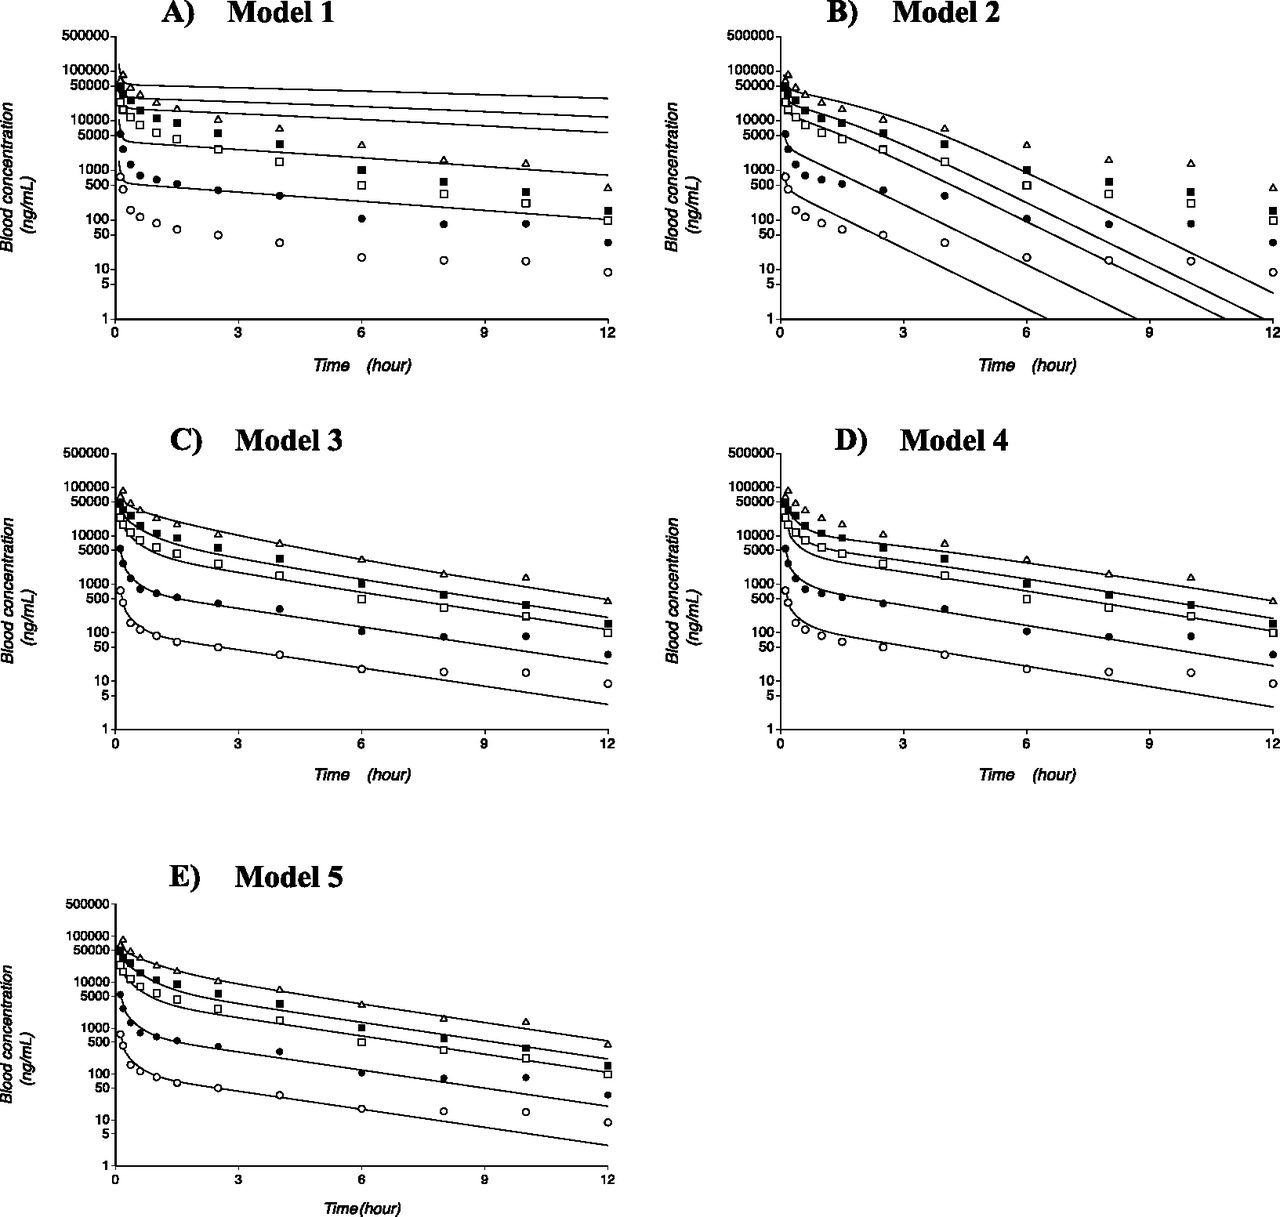
Simulation results from the PBPK models (models 1, 2, 3, 4, and 5) of bosentan. Panels A, B, C, D, and E are the analysis results of Model 1, 2, 3, 4 and 5, respectively. Solid lines represent the simulation results. The open and closed circles, open and closed squares, and open triangles indicate the reported bosentan blood concentration-time profiles with intravenous doses of 10, 50, 250, 500, and 750 mg, respectively.
Instead of biologic scaling factors, model 2 used scaling factors that were optimized by fitting. With this modification, the predicted values of dose-normalized AUCs became closer to the reported values. However, the blood bosentan concentration-time profiles simulated by model 2 were not in good agreement with the clinically observed data (Fig. 4B).
PBPK Modeling Via Top-Down Approaches (Models 3, 4, and 5).
The next three PBPK models incorporated the saturable processes for hepatic uptake only (model 3), metabolism only (model 4), or both (models 5). Model 3 yielded the predicted profiles that were in good agreement with the observed values as well as the smallest AIC values among the tested models (Fig. 4C; Table 3). Model 4, which incorporated the saturable process for hepatic metabolism only, yielded the profiles that substantially deviated from the clinically observed data, especially at early times at high doses of bosentan (Fig. 4D). In model 5, which incorporated the saturable process for both hepatic uptake and metabolism, the simulated blood concentration-time profiles of bosentan were in much better agreement with the observed data than those predicted from model 4 (Fig. 4E). The AIC value also substantially improved from 125 (model 4) to 86.8 (model 5).
Monte Carlo Simulation of PBPK Modeling.
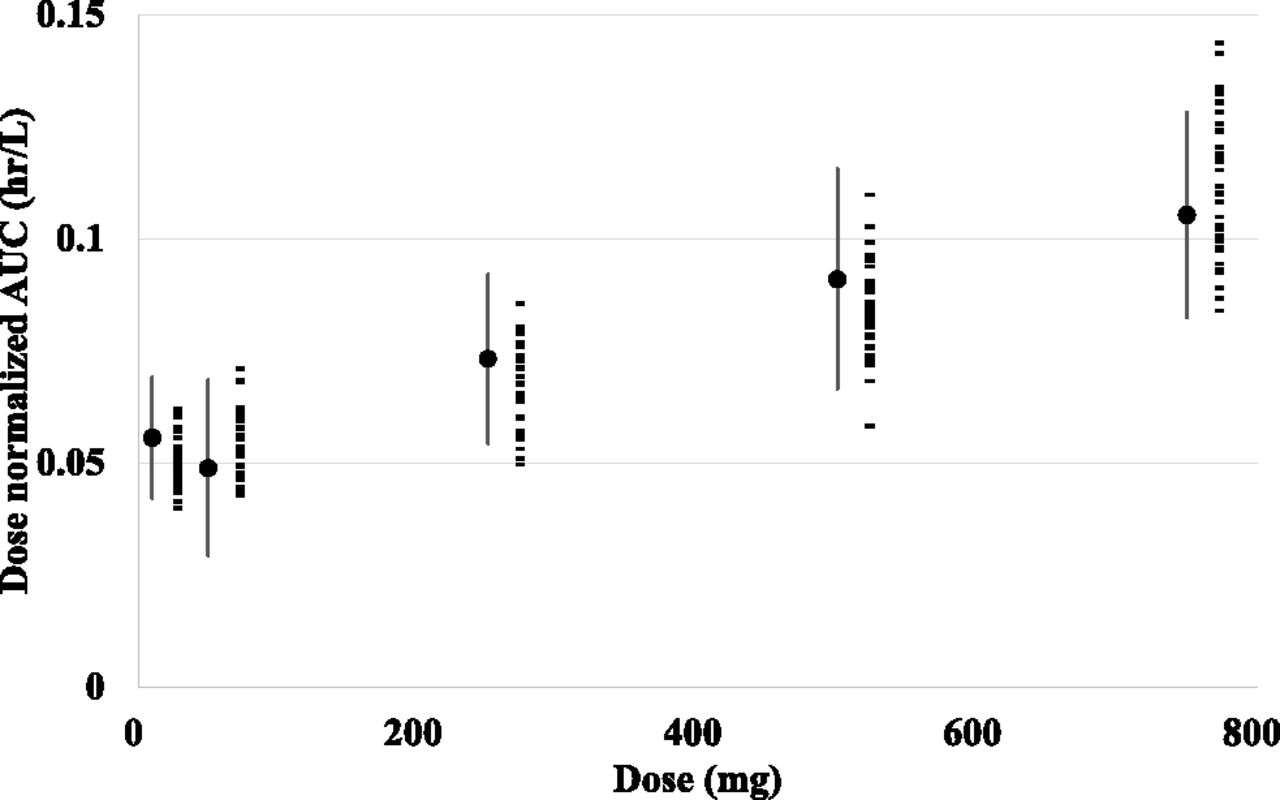
Taking interindividual and intraindividual variability of the parameters of model 3 into consideration, Monte Carlo simulations were carried out. The simulated dose-normalized AUCs of every dose level were similar to the reported values, in terms of the average and S.E. (Fig. 5). These results suggest that the variation in AUCs after intravenous bosentan dosing may be explained mostly by the variation in the kinetic processes of hepatic uptake and metabolism.

Monte Carlo simulation of bosentan blood concentration profiles. The results of the Monte Carlo simulations that considered interindividual variability in Vmax,uptake, Km,uptake, PSdif, and CLmet and intraindividual variability in model 3. Observed mean and S.E. values of each dose are shown as closed circles and lines, and mean values of dose-normalized AUCs of each virtual study estimated from Monte Carlo simulation using model 3 are indicated as closed rectangles.
Discussion
In our current study, the PBPK models for bosentan were developed to enhance our kinetic and mechanistic understanding of nonlinear PKs associated with bosentan therapy. Based on the results comparing different PBPK models (models 1–5), the saturable hepatic uptake of bosentan is a most likely contributor to the nonlinear PKs of intravenously administered bosentan.
To obtain the kinetic parameters necessary for our PBPK modeling analyses, we assessed the processes of both hepatic uptake and metabolism of bosentan in the current study. The in vitro Km,uptake value for bosentan was determined to be 1.33 μM using suspended human cryopreserved hepatocytes and was considered to be in a comparable range with the previously reported values using OATP1B1-expressing cells or sandwich-cultured hepatocytes (4.27–44 µM) (Jones et al., 2012; Ménochet et al., 2012; Izumi et al., 2015). And the in vitro Km,met values for the production of hydroxyl bosentan and desmethyl bosentan were determined to be 6.40 and 4.80 μM, respectively, using pooled human liver microsomes. The Km values for bosentan metabolism were 12.3–232 µM using recombinant CYP2C9 microsomes (Chen et al., 2014) or 13 µM using human liver microsome (Ubeaud et al., 1995). The Km values in our experiment appear comparable with those of previous reports. By using the method reported previously (Hallifax and Houston, 2006), the lipophilicity of bosentan and the experimental conditions used in our in vitro study, the unbound fraction of bosentan was predicted to be 0.867 in the presence of microsomal protein 2 mg/ml. This prediction result suggested that the microsomal protein binding of bosentan may not be so extensive in our experimental conditions.
These Km values for bosentan metabolism and uptake were comparable with the estimated unbound maximum bosentan blood concentration (over 5 μM) in healthy volunteers after receiving the 750-mg intravenous bosentan dose. The in vitro Vmax/Km value for bosentan uptake (using pooled human cryopreserved hepatocytes) was 35.6 μl/min per 106 cells, approximately 12 times higher than the in vivo PSdif value (2.89 μl/min per 106 cells) (Table 1). These results indicate that bosentan is actively taken up into the liver from the blood in humans and the unbound bosentan concentrations are likely to be higher in the hepatocytes than in human blood. These considerations provide justifications for further interrogating the saturation of hepatic uptake and/or metabolism of bosentan as possible underlying mechanisms for nonlinear bosentan PKs.
For model 1 (a bottom-up approach with the use of biologic scaling factors), simulated bosentan blood concentration-time profiles and dose-normalized AUCs of bosentan substantially differed from the clinically observed data (Fig. 4A). When the kinetic parameters were scaled up to fit the clinically observed data (model 2), the prediction accuracy improved for dose-normalized AUC values, yet there were substantial deviations in terms of bosentan blood concentration-time profiles (Fig. 4B). These findings may suggest that the scaling factors for in vitro Vmax,uptake/Km,uptake and in vitro PSdif need to be individually optimized instead of using a single scaling factor for both parameters. These findings are in line with previous reports, which proposed that the scaling factor for OATP-mediated uptake clearance should be greater than 1 and be determined independently from in vitro PSdif (Kusuhara and Sugiyama, 2009; Jones et al., 2012; Varma et al., 2014).
Among the PBPK models of top-down approaches, model 3 was deemed to yield the best fit to the clinically observed data based on the AIC values. The scaling factors for bosentan uptake were calculated by calculating the ratio of the in vivo Vmax,uptake/Km,uptake value to the biologically scaled in vitro Vmax,uptake/Km,uptake value (483 l/h per 78 kg), yielding 6.24, 4.89, and 5.43 for models 3, 4, and 5, respectively. The reported scaling factors of OATP substrates, calculated using the same method, displayed considerable variability: 12–161 (Jones et al., 2012) or 1.0–101.8 (Varma et al., 2014). The scaling factors in our models appear to be less variable than those reported in the literature.
When the in vivo Km,uptake value of 0.534 or 0.667 μM was obtained by fitting in model 3 or 5, respectively, which were similar to the experimentally obtained in vitro Km,uptake value of 1.33 μM, simulated bosentan blood concentration-time profiles were in good agreement with the clinically observed data (Fig. 4). The similarity between in vivo and in vitro Km,uptake values may further support the saturation of hepatic uptake as the most likely contributor to the nonlinear PKs of bosentan after intravenous dosing.
PBPK modeling analyses incorporating saturable hepatic metabolism yielded the Km,met values of 108 and 163 μM for models 4 and 5, respectively. The maximum unbound concentrations of bosentan in the liver were predicted to be approximately 65 and 45 μM based on the simulation results using models 4 and 5, respectively (Supplemental Fig. 1), and on the unbound fraction in hepatocytes (0.0696) obtained by our in vitro study. Therefore, we reasoned that the saturation of bosentan metabolism in the liver is unlikely to occur at clinically relevant concentrations.
The Km,met values derived from models 4 (108 μM) and 5 (163 μM) differed from our in vitro experiment results using human liver microsomes [Km value for the production of hydroxyl bosentan (Km,met,OH), 6.40 ± 1.20 μM; Km value for the production of desmethyl bosentan (Km,met,DES) was 4.80 ± 2.61 μM]. These discrepancies may be related to the effects of CYP2C9 polymorphism on bosentan metabolism. Chen et al. (2014) reported that the Km,met,OH values mediated by CYP2C9 vary widely from 12.3 to 232 μM depending on the CYP2C9 polymorphism. We were not able to further investigate this possibility due to the limited information on CYP2C9 polymorphisms in the study participants.
The results of the Monte Carlo simulation also demonstrated that the variation in the systemic exposure (AUCs) after bosentan intravenous dosing can be explained mostly by the variations in Vmax,uptake, Km,uptake, PSdif, and CLint,met (Fig. 5).
We initially attempted the PBPK analyses of the nonlinear PKs of bosentan after intravenous and oral dosing at the same time. Different from the intravenous data, the dose-normalized AUC values (AUC/dose) decreased with escalating oral doses of bosentan (Weber et al., 1996). To describe nonlinear PKs after oral administration, PBPK models included the components for solubility-limited absorption and saturable intestinal absorption mediated by OATP2B1 (detailed information is provided in Supplemental Figs. 2–7; Supplemental Material; and Supplemental Tables). Currently, we have limited confidence in our PBPK models for oral bosentan data, mainly due to the lack of information on excipients used for making bosentan suspensions. Further investigations are warranted to establish reliable PBPK models for PO bosentan data. Very recently, PBPK models, which described intravenous and oral data of bosentan, have been reported (Li et al., 2018). The results from our current study provide new information that saturation of hepatic uptake, but not of hepatic metabolism, likely contributes to nonlinear PKs after bosentan intravenous dosing.
Nonlinear bosentan PKs was recently described by a two-compartment, target-mediated drug disposition (TMDD) model (Volz et al., 2017). This model showed that bosentan binds to ET receptors with high affinity (dissociation constant, ∼1.9 nM), comparable to the measured binding constant (0.79–1.1 nM). In addition, the study reported that the receptor binding of bosentan is saturated with escalating doses (>50 mg, i.v.). However, such findings differ from the reported clinical data where the systemic plasma clearance of bosentan decreased with escalating intravenous doses (11.5, 7.9, 6.4, and 4.8 l/h for intravenous bosentan doses of 50, 250, 500, and 750 mg, respectively) (Weber et al., 1996). Currently, the reasons for these apparent discrepancies are unknown. We are not aware of solid experimental evidence showing the internalization of the bosentan-ET receptor complex. For other ET receptor antagonists such as ambrisentan and macitentan, there is no report that they undergo TMDD. We thus believe that further efforts may be needed to determine the necessity of including TMDD in the bosentan PBPK model.
On the other hand, the Km value (0.534 μM) for hepatic uptake derived from our current PBPK model was comparable to that (1.33 μM) obtained from in vitro experiments. After 250-mg bosentan intravenous dosing, a maximum unbound bosentan concentration in blood was calculated as ∼1.4 μM. Thus, it is reasonable to interpret that hepatic uptake of bosentan may be saturated with intravenous doses greater than 250 mg, affecting bosentan PKs. Further investigation is warranted to examine the contribution of TMDD to nonlinear PKs of bosentan, but saturation of hepatic uptake appears to be a plausible mechanism for nonlinear PKs of bosentan with high intravenous bosentan doses.
In conclusion, we established a PBPK model that can account for the nonlinear PKs of intravenously administered bosentan by incorporating the saturable process of transporter-mediated hepatic uptake. The PBPK model established in this study may prove useful in explaining and predicting complex PK behaviors of bosentan and drug-drug interactions.
Acknowledgments
We thank Dr. Sibylle Neuhoff, Dr. Shriram Pathak, and Dr. Matthew Harwood of Certara, the maker of Simcyp Simulator, and Dr. Amin Rostami of the University of Manchester for providing advice about performing analyses of oral administration data using the Simcyp Simulator.
Authorship Contributions
Participated in research design: Sato, Toshimoto, Tanaka, Hisaka, and Sugiyama.
Conducted experiments: Tomaru.
Performed data analysis: Sato, Tomaru, and Tanaka.
Wrote or contributed to the writing of the manuscript: Sato, Toshimoto, Tomaru, Yoshikado, Lee, and Sugiyama.
Footnotes
- Received October 16, 2017.
- Accepted February 21, 2018.
Although M.S. is an officer for Pharmaceuticals and Medical Devices Agency (PMDA), the content of this article does not reflect the views or policies of the PMDA or its staff. No other potential conflicts of interest relevant to this article were reported.
↵
 This article has supplemental material available at dmd.aspetjournals.org.

Abbreviations
- AIC
- Akaike information criterion
- AUC
- area under the plasma concentration-time curve
- CLint,met
- hepatic intrinsic metabolic clearance
- CLmet
- metabolic clearance
- CLr
- renal clearance
- ET
- endothelin
- fB
- unbound fraction in blood
- fH
- hepatic intracellular unbound fraction
- Km
- Michaelis constant
- Km,met
- Michaelis constant of metabolism
- Km,met,DES
- Km value for the production of desmethyl bosentan
- Km,met,OH
- Km value for the production of hydroxyl bosentan
- Km,uptake
- Michaelis constant of uptake
- LC-MS/MS
- liquid chromatography-tandem mass spectrometry
- m/z
- charge/mass ratio
- OATP
- organic anion–transporting polypeptide
- P450
- cytochrome P450
- PBPK
- physiologically based pharmacokinetic
- PK
- pharmacokinetic
- PSact
- transporter-mediated active uptake clearance
- PSdif
- passive diffusion clearance
- PSdif,eff
- passive diffusion efflux clearance
- PSdif,inf
- passive diffusion influx clearance
- TMDD
- target-mediated drug disposition
- v
- initial uptake rate
- Vmax,met
- maximum metabolic rate
- Vmax,uptake
- maximum uptake rate
- WSS
- weighted squared residuals
- Copyright © 2018 by The American Society for Pharmacology and Experimental Therapeutics


