


Abstract
The candidate vitamin ergothioneine (ET) is a unique antioxidant. Expression of the ET transporter (ETT) (gene symbol SLC22A4) in distinct cells is thought to signal intracellular ET activity, since we have previously shown that the ETT is highly selective for ET. Unfortunately, some continue to hold the ETT as a relevant drug transporter, using the misleading functional name OCTN1, novel organic cation transporter. The present study was provoked by two recent reports in which new ETT substrates were declared. Astonishingly, the transport efficiencies (TEs) of ETT for saracatinib and some nucleoside drugs were as high as the TE for ET. Here we examined, based on regulated expression of ETT from human and rat in 293 cells and liquid chromatography-mass spectrometry quantification, the transport of several drugs. With the nucleosides cytarabine, gemcitabine, 2′-deoxycytidine, and 2′-deoxyadenosine, and the drugs saracatinib, ipratropium, metformin, and oxaliplatin, the uptake into cells expressing ETT was not increased over control cells. ETT-mediated uptake of gabapentin was detectable, but the TE was approximately 100-fold lower than the TE for ergothioneine (50–200 µl/min per milligram of protein). In conclusion, the ETT remains highly specific for its physiologic substrate ergothioneine. Our results contradict several reports on additional substrates. The ETT does not provide multiple substrate specificities, and it is not a transporter of cationic drugs. Only compounds that are related to ET in substructure—for example, gabapentin, carnitine, and TEA—can be transported, but with very low efficiency. Thus, ETT persists as a specific molecular indicator of ET activity.
Introduction
Ergothioneine (ET) is a natural compound that humans and other vertebrates cannot synthesize; it must be absorbed from food. Most of our contemporary food contains very little ET, but several mushrooms (Melville, 1959; Kalaras et al., 2017) and cyanobacteria (Pfeiffer et al., 2011) contain around 1 mg/g dried material. After ingestion, ET is rapidly cleared from the circulation and then retained in the body with minimal metabolism. The content of ET varies greatly among human tissues (Hartman, 1990). High ET levels have been found in erythrocytes and the eye.
In the biosynthesis of ET, l-histidine is converted to a betaine and a sulfur atom is attached to position 2 of the imidazole ring (Fig. 1) (Melville, 1959; Seebeck, 2010). The linkage between sulfur and carbon is better represented by a double bond (thione, as in thiourea) than by a single bond (thiol) (Hartman, 1990; Peckelsen et al., 2017). Because of the prevailing thione tautomer, ET has several properties that are markedly different from common thiols like the ubiquitous glutathione (GSH). In general, ET is considered an intracellular antioxidant (Hartman, 1990; Cheah and Halliwell, 2012). However, its precise physiologic purpose is still unresolved. The key questions that guide our research are: why do we accumulate ET in particular cells despite a 10-fold excess of GSH, the general antioxidant? Is there a unique benefit from ET?

Compound structures.
Previously, we have discovered an ET transporter (ETT; human gene symbol SLC22A4) (Gründemann et al., 2005). ETT is a high-affinity uptake transporter of the plasma membrane, driven by the sodium gradient (Nakamura et al., 2008; Paul and Snyder, 2010). Cells lacking ETT cannot accumulate ET since phospholipid bilayers are virtually impermeable to this hydrophilic zwitterion. In the human body, ETT is strongly expressed in particular sites only: erythrocyte progenitor cells in the bone marrow, small intestine (ileum), trachea, kidney, cerebellum, lung, and monocytes. Knockout mice (Kato et al., 2010) and zebrafish (Pfeiffer et al., 2015) have confirmed that ETT is responsible for the absorption, distribution, and retention of ET. The mere existence of ETT and its evolutionary conservation across all vertebrates implies that ET has a beneficial function, like a vitamin. Indeed, case-control studies suggest that polymorphisms in the SLC22A4 gene are associated with susceptibility to chronic inflammatory diseases, such as Crohn’s disease, ulcerative colitis, and type I diabetes (Cheah and Halliwell, 2012; Gründemann, 2012), but it is unknown whether these mutations promote disease.
Recently, we have reported that in the skin of unstressed ETT knockout zebrafish, the content of 8-oxoguanine was increased 4-fold versus wild type (Pfeiffer et al., 2015). This led to the hypothesis that the specific purpose of ET, universal across all species, could be to eradicate noxious singlet oxygen. In a subsequent in vitro study, we have shown that ET is much more reactive toward singlet oxygen than GSH (Stoffels et al., 2017). The universal value and uniqueness of ET may reside exactly here—much less reactive in general than GSH, but much more reactive with the fitting molecule.
Our experimental evidence strongly suggests that ETT is highly selective for the uptake of ET into cells (Grigat et al., 2007; Bacher et al., 2009; Nikodemus et al., 2011). Expression of ETT in specific cells would then signal intracellular ET activity (Gründemann, 2012). Our basic assumption is that relevant substrates—due to evolutionary optimization—are transported with high efficiency. On this basis, we have previously disqualified TEA, carnitine, quinidine, verapamil, and pyrilamine as ETT substrates (Grigat et al., 2007); we therefore consider the designation novel organic cation transporter (OCTN1) or carnitine transporter as misleading. The present study was provoked by two recent reports in which new substrates for the ETT were presented. Astonishingly, the transport efficiency (TE) for some nucleoside drugs (Drenberg et al., 2017) and saracatinib (Harrach et al., 2017) was reported to be as high as the TE for ET. If the transport of these drugs was valid, then the designation and the purpose of the ETT would have to be revised; it could no longer be used then as a marker for ET. The aim of our study was therefore to scrutinize experimentally all previous reports on new ETT substrates.
To distinguish between good and poor substrates (Schömig et al., 2006), one would ideally measure the TE, which is defined, equivalent to catalytic efficiency for enzymes, strictly by kcat/Km; this ratio takes into account the turnover number (kcat) and the affinity (Km) of a carrier for a substrate. Unfortunately, it is very difficult to determine kcat. Therefore, often a pseudo-TE is calculated from Vmax/Km, a measure directly proportional to kcat/Km (since Vmax = kcat × Etotal, where Etotal represents the number of active carriers in the plasma membrane). Alternatively, TE can be calculated as v/S (where v represents the initial rate of transporter-mediated uptake and S is the substrate concentration), since the Michaelis-Menten equation v = Vmax × S/(Km + S) can be converted to v/S = Vmax/Km provided that S is much smaller than Km (Gründemann et al., 1999). The TE can also be extracted from a time course of uptake (as the kin kinetic constant, corrected for uptake into control cells). This pseudo-TE is also known as clearance, since it denotes the virtual volume of incubation buffer, which is cleared completely from the substrate by the transport activity per unit time.
Materials and Methods
Plasmids.
The construction of pEBTetD/ETTh has been described previously (Bach et al., 2007). The ETTh cDNA codes for the wild-type carrier, with Leu at position 503. The sequence of the open reading frame of the ETT from rat (ETTr) cDNA corresponds to GenBank accession number AF169831. The 5′-interface between vector pEBTetD and cDNA is AAACTT AAGCTT gccacc ATGAGGGAC (polylinker in bold, Kozak motif in lowercase, start codon underlined), and the 3′-interface is CGTGGCAAACTG A25 GCGGCCGCGGGGCAG (cDNA underlined, polylinker in bold).
Cell Culture.
293 cells (CRL-1573, American Type Culture Collection, Manassas, VA; also known as HEK-293 cells), a transformed cell line derived from human embryonic kidney, were grown in plastic culture flasks (Falcon 353112; Becton Dickinson, Heidelberg, Germany) at 37°C in a humidified 5% CO2 atmosphere. The growth medium was Dulbecco’s modified Eagle medium (31885-023; Thermo Fisher Scientific, Karlsruhe, Germany) supplemented with 10% fetal bovine serum (Biochrom, Berlin, Germany), 100 U/ml penicillin, and 0.1 mg/ml streptomycin (P4458; Sigma-Aldrich, Munich, Germany). Medium was changed every 2–3 days, and the culture was split every 5 days.
Stably transfected cell lines were generated as reported previously (Bach et al., 2007). Since pEBTet-derived vectors (Bach et al., 2007; Skwara et al., 2017) are propagated episomally, we use cell pools rather than single cell clones. Cell culture medium always contained 3 µg/ml puromycin (P-600; Gold Biotechnology, St. Louis, MO) to maintain plasmids. To turn on protein expression, cells were cultivated for at least 20 hours with 1 µg/ml doxycycline (195044; MP Biomedicals, Eschwege, Germany) in growth medium.
Transport Assays.
To measure solute uptake, cells were seeded in 60-mm-diameter polystyrol dishes (83.3901; Sarstedt, Nümbrecht, Germany; precoated with 0.1 g/l poly-l-ornithine in 0.15 M boric acid-NaOH, pH 8.4) and grown to a confluence of at least 70%. Uptake buffer contains 125 mM NaCl; 25 mM HEPES-NaOH, pH 7.4; 5.6 mM (+)glucose; 4.8 mM KCl; 1.2 mM KH2PO4; 1.2 mM CaCl2; and 1.2 mM MgSO4. After preincubation of the cells at 37°C for at least 20 minutes in 4 ml of uptake buffer, the buffer was replaced with 2 ml of substrate in uptake buffer. Cells were incubated for 1 minute at 37°C, washed four times each with 4 ml of ice-cold uptake buffer, lysed with 1 ml of methanol, and then stored at −20°C. The protein content of mass spectrometry samples was estimated from three paired dishes; here, 0.1% v/v Triton X-100 in 5 mM Tris-HCl, pH 7.4, was used as a lysis buffer. Protein was measured by the BCA protein assay (23225 Pierce; Thermo Fisher Scientific, Darmstadt, Germany) with bovine serum albumin as standard.
Liquid Chromatography-Tandem Mass Spectrometry.
After centrifugation of thawed cell lysates (16,000g, for 2 minutes, at 20°C), 20 µl (for the Atlantis HILIC column; Waters, Wexford, Ireland) or 10 µl were analyzed by HPLC coupled to a triple-quadrupole mass spectrometer (4000 Q TRAP; AB Sciex, Darmstadt, Germany). The following LC conditions were used (SLC-20AD Prominence HPLC; Shimadzu, Duisburg, Germany): flow rate of 0.4 ml/min (Atlantis HILIC column; Waters) or 0.2 ml/min: cytarabine, gemcitabine, and deoxycytidine, ZIC-HILIC column (5 μm, 2.1 × 100 mm; Dichrom, Marl, Germany), A 0.1% formic acid, B 0.1% formic acid in acetonitrile; gradient flow, 85% B at 0 minute, 85% B at 0.5 minute, 30% B at 6 minutes, 30% B at 7 minutes, 85% B at 14 minutes, 85% B at 15 minutes; deoxyadenosine and oxaliplatin, ZIC-HILIC column (5 μm, 2.1 × 100 mm; Dichrom), A 0.1% formic acid, B 0.1% formic acid in acetonitrile; gradient flow: 70% B at 0 minute, 70% B at 0.5 minute, 30% B at 3 minutes, 30% B at 5 minutes, 70% B at 6 minutes, 70% B at 8 minutes; saracatinib, XBridge Shield RP18 column (5 μm, 3.0 × 100 mm; Waters, Wexford, Ireland), A 10 mM ammonium acetate pH 8.9, B methanol; gradient flow, 20% B at 0 minute, 20% B at 0.5 minute, 80% B at 6 minutes, 80% B at 7 minutes, 20% B at 14 minutes, 20% B at 15 minutes; gabapentin, ipratropium, ZIC-HILIC column (5 μm, 2.1 × 100 mm; Dichrom), A 0.1% formic acid, B 0.1% formic acid in acetonitrile; isocratic flow, 70% B 8 minutes, ET, Atlantis HILIC silica column (5 µm, 3.0 × 50 mm; Waters), A 0.1% formic acid, B 0.1% formic acid in acetonitrile; gradient flow, 90% B at 0 minute, 90% B at 0.25 minute, 10% B at 2 minutes, 10% B at 4 minutes, 90% B at 5 minutes, 90% B at 6 minutes; and metformin, Atlantis HILIC silica column (5 µm, 3.0 × 50 mm; Waters), A 10 mM ammonium formate pH 3.75, B acetonitrile; gradient flow, 80% B at 0 minute, 80% B at 0.1 minute, 20% B at 2 minutes, 20% B at 4 minutes, and 80% B at 6 minutes, 80% B at 8 minutes.
Atmospheric pressure ionization with positive electrospray and positive ion detection was used. For quantification, the optimal collision energy for nitrogen-induced fragmentation in the second quadrupole was determined for each analyte. From the product ion spectra, the following fragmentations were chosen for selected reaction monitoring [reported as charge/mass ratio parent, charge/mass ratio fragment, collision energy (in volts)]: cytarabine: 244, 112, 17; deoxyadenosine: 252, 136, 25; deoxycytidine: 228, 112, 11; ET: 230, 127, 27; gabapentin: 172, 137, 23; gemcitabine: 264, 112, 25; ipratropium: 332, 166, 37; metformin: 130, 60, 19; oxaliplatin: 252, 136, 21; and saracatinib: 542, 127, 39.
For each analyte, the area of the intensity versus time peak was integrated. Linear calibration curves were constructed (weighting 1/y2) from at least six standards, which were prepared using control cell lysates as solvent. Sample analyte content was calculated from the analyte peak area and the slope of the calibration curve.
Calculations and Statistics.
Results are presented, if not indicated otherwise, as the arithmetic mean ± S.E.M. with at least n = 3. All assays were performed at least three times, on separate days. The unpaired t test was used to test for significance; two-tailed P values are given.
The graphs shown in time courses were estimated by nonlinear regression using the function y = kin/kout × cout × [1 − exp(−kout × x)], where cout is the extracellular substrate concentration and kin and kout are rate constants. Gaussian error propagation was used to estimate the S.D. of kin differences.
Materials.
The following unlabeled compounds were used (from Sigma-Aldrich, if not noted otherwise): cytarabine (AB249843; abcr, Karlsruhe, Germany), 2′-deoxyadenosine monohydrate (catalog number D7400), 2′-deoxycytidine (D3897), l-(+)-ergothioneine (THD-201; Tetrahedron, Vincennes, France), gabapentin (G154), gemcitabine (AB436344; abcr), ipratropium bromide monohydrate (I1637), metformin hydrochloride (PHR1084), oxaliplatin (O9512), and saracatinib (S1006; Selleckchem, Munich, Germany). All other chemicals were at least of analytical grade.
Results
ET Transporter Assay Setup.
The transport function of ETTh and ETTr was assayed with 293 cells that had been stably transfected with pEBTetD/ETTh or pEBTetD/ETTr. pEBTetD is an Epstein-Barr replication plasmid for doxycycline-inducible protein expression in human cell lines based on the simple tetracycline repressor (Bach et al., 2007). Expression is turned on by the addition of 1 µg/ml doxycycline to the culture medium for about 20 hours. This system provides a high rate of ETTh-mediated transport in the on-state (100%) and a low rate (2%–4%) in the off-state (Bach et al., 2007). To measure initial rates of solute uptake, nearly confluent cell monolayers in paired dishes with and without expression of ETT were incubated for 1 minute at 37°C with 0.1, 1, or 10 µM unlabeled solute in physiologic buffer. After washing and methanol lysis of cells, the solute content was determined by LC-MS.
ET was used as reference substrate. The ET content was much higher (P < 0.0001; n = 3) in on-state compared with off-state cell lysates (Fig. 2, left). In both states, ET content increased linearly with substrate concentration. The TE for ET (equal to the difference of the slopes) was typically in the range of 50–200 µl/min per milligram of protein for both transporters. The scatter plot panels on the right illustrate—with the same data normalized relative to the expression off controls—an excellent signal-to-noise quality that improves with increasing substrate concentration. This is due to nonzero vertical (ordinate) intercepts. These correspond to ET already present in the cells at the beginning of the uptake period because of uptake from the cell culture medium (serum provides some ET).

Uptake of ET into 293 cells with or without the expression of ETTh or ETTr. 293 cells stably transfected with pEBTetD/ETTh or pEBTetD/ETTr and grown in dishes were cultured for 20 hours in the presence (to express the transporter) or absence (control) of 1 µg/ml doxycycline in growth medium. Cells were washed, incubated for 1 minute at 37°C with uptake buffer plus ET at the indicated concentration, washed, and lysed with methanol. The ET content of cell lysates was determined by LC-MS/MS. The right-hand plots show the data from the graphs on the left, relative to the respective off-state average. Symbols represent individual dishes.
Note that in the following experiments ET was always assayed (in separate dishes) in parallel to other solutes as a positive control for the robust expression of functional transporter.
ETT is Not a Carrier of Nucleoside Analogs.
The accumulation of the unlabeled nucleoside analogs/nucleosides cytarabine, gemcitabine, 2′-deoxycytidine, and 2′-deoxyadenosine was measured as described above. With all four compounds and both carriers, there was no sign of transport activity (i.e., no increase of analyte in the ETT expression on over the off lysates) (Fig. 3). This can be judged best from the scatter plots. In the left-hand graphs, a clearance of 100 µl/min per milligram of protein at 10 µM substrate concentration would correspond to an increase of 1000 pmol/min per milligram of protein; this would be discernible against all backgrounds with no difficulty. The analytical setup was impeccable since the ETT-independent solute accumulation in the lysates increased linearly with external solute concentration in all cases.

Uptake of nucleosides into 293 cells with or without the expression of ETTh or ETTr. Assays were performed as described in the legend of Fig. 2.
No Transport of Drugs.
Accumulation of the drugs saracatinib, ipratropium, metformin, and oxaliplatin was measured as described above. Again, with all compounds and both carriers, there was no sign of transport activity (Fig. 4). The analytical setup was valid and responsive for saracatinib, ipratropium, and metformin, since solute accumulation was a linear function of solute concentration. At 0.1 and 1 µM oxaliplatin, the tandem mass spectrometry (MS/MS) peaks were insufficiently defined; at 10 µM, the rates of uptake (±S.E.M.) were 3.5 ± 0.7 (expression off) and 3.8 ± 0.4 (expression on) pmol/min per milligram of protein for ETTh and 2.8 ± 0.4 (expression off) and 2.8 ± 0.1 (expression on) pmol/min per milligram of protein for ETTr. At 10 µM substrate concentration, an increase of analyte in the lysates would be obvious—considering the background accumulation—at 100 pmol/min per milligram of protein for saracatinib (TE = 10 µl/min per milligram of protein), at 10 pmol/min per milligram of protein for ipratropium (TE = 1 µl/min per milligram of protein), at 10 pmol/min per milligram of protein for metformin (TE = 1 µl/min per milligram of protein), and at 1 pmol/min per milligram of protein for oxaliplatin (TE = 0.1 µl/min per milligram of protein).

Uptake of drugs into 293 cells with or without the expression of ETTh or ETTr. Assays were performed as described in the legend of Fig. 2.
Gabapentin Is but a Poor Substrate of ETT.
Accumulation of the drug gabapentin was measured as described above. In our standard assay, there was no sign of transport activity (data not shown). However, high endogenous phenylalanine-sensitive uptake by the L-type system amino acid transporter LAT1 was reported previously for 293 cells (Urban et al., 2008). In the presence of 1 mM l-phenylalanine (to largely block the endogenous uptake), the accumulation of gabapentin was higher in the on-state cells than in the off-state cells for both orthologs (data not shown). The addition of 1 mM l-phenylalanine did not affect the uptake of 10 µM ET by ETTh and ETTr (data not shown). The clearance was precisely determined by time courses (Fig. 5); the differences of kin values yielded a TE (±S.D.) of 1.1 ± 0.2 µl/min per milligram of protein for ETTh and of 2.6 ± 0.2 µl/min per milligram of protein for ETTr.
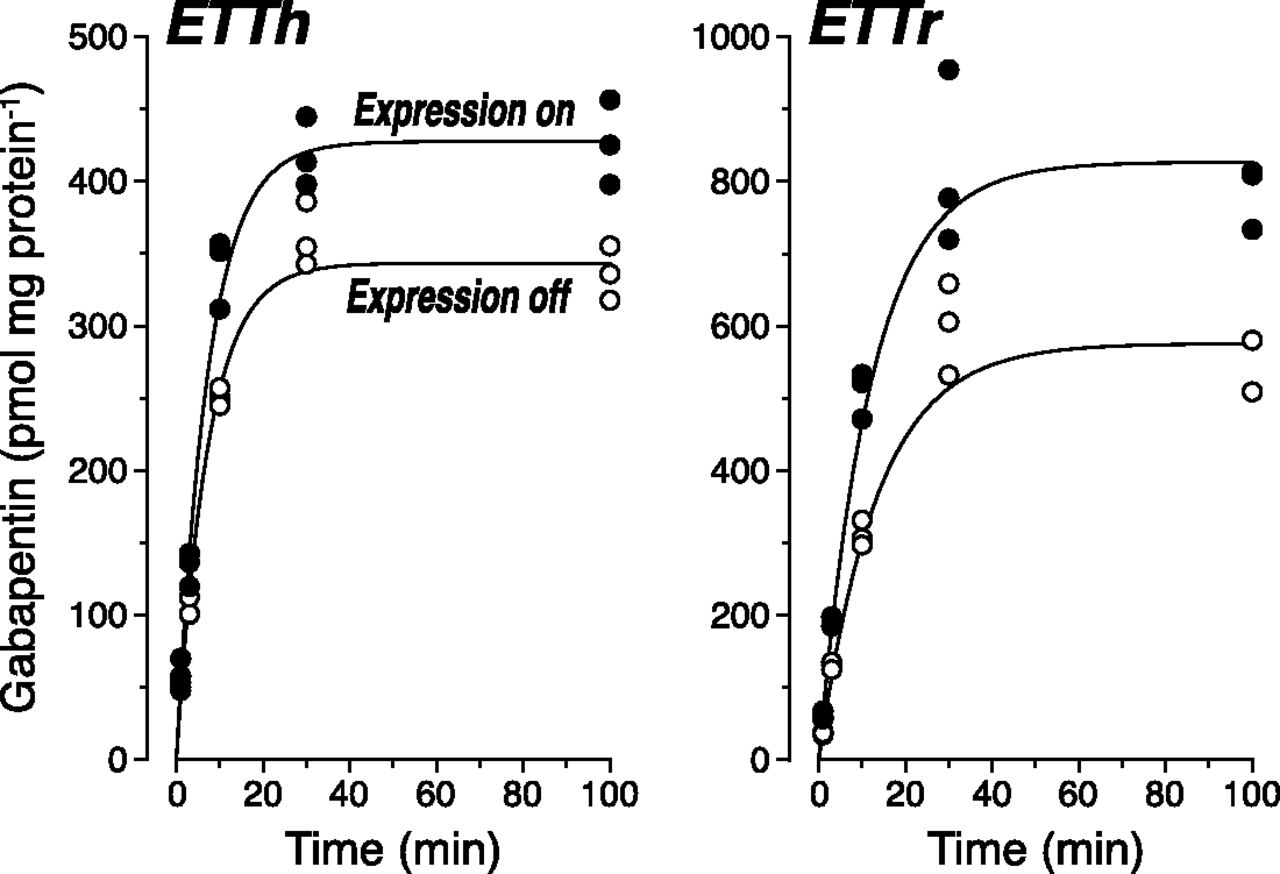
Time courses of uptake of gabapentin into 293 cells with or without the expression of ETTh or ETTr. Cells in dishes prepared as described in the legend of Fig. 2 were washed, incubated at 37°C with 10 µM gabapentin plus 1 mM l-phenylalanine in uptake buffer for the indicated times, washed, and lysed. The gabapentin content of cell lysates was determined by LC-MS/MS.
Discussion
With the exception of gabapentin, we could not detect ETT-catalyzed uptake for any of the compounds tested in this study. Functional expression of ETTh and ETTr was verified in every experiment by robust uptake of ET in paired dishes. In the following, we scrutinize previous results from other groups and try to speculate on experimental shortcomings. Consult Table 1 for an overview of the assay conditions.
Comparison of substrate uptake assays
Saracatinib uptake was determined in 293 cells with exactly our expression system for ETTh (Harrach et al., 2017). The TE for saracatinib—calculated from Vmax/Km—was very high at 7970 pmol/min per milligram of protein/42 µM = 190 µl/min per milligram of protein (Harrach et al., 2017, their Fig. 1D). Saracatinib was determined by HPLC using simply a UV detector set to 259 nm. This detection method lacks specificity; many compounds absorb UV light at 259 nm. Our present results, based on highly selective MS/MS detection, should be much more reliable. Note that an uptake corresponding to a TE of 10 µl/min per milligram of protein would have been detected easily in our assays (Fig. 4).
The uptake of nucleosides was studied with great care by Sparreboom and coworkers (Drenberg et al., 2017). Many controls were included, and results were repeated several times (A. Sparreboom, personal communication). Still, from our own assays we must conclude that an artifact was reported there. We cannot see why we should not observe such a vigorous uptake of nucleosides (130 and 180 µl/min per milligram of protein, respectively, for gemcitabine and cytarabine) (Drenberg et al., 2017, their Fig. 5B) in our assays if it really was a function of ETT. We speculate that the reported activity is due to a separate transport protein that was expressed here accidentally in parallel to ETT.
Sparreboom and coworkers used a complicated expression system, that is the retroviral vector pMIG II (catalog number 52107; Addgene, Cambridge, MA), which contains an internal ribosome entry site element to express green fluorescent protein in tandem with FLAG (Sigma-Aldrich)-tagged ETTh. 293 cells were transduced by virus particles; 7–10 days later, green fluorescent protein–positive cells to be used in the functional assays were harvested by FACS (Becton Dickinson). The pMIG II vector contains two long terminal repeats (LTRs) from the mouse stem cell virus; normally, only the 5′ LTR acts as an RNA pol II promoter. The 3′ LTR has exactly the same sequence arrangement as the 5′ LTR, but usually provides transcription termination and polyadenylation. However, there are circumstances when the 3′ LTR can act as a promoter (Cullen et al., 1984); this is the basis for one form of retroviral oncogenesis. Thus, depending on the genomic integration site and perhaps on the cargo cDNA sequence (since the carnitine transporter cDNA did not stimulate nucleoside transport), the 3′ LTR may drive the expression of a secondary protein.
Since there is permanent expression of the cDNA cargo with this system, an empty vector was used to create a reference cell line. If the empty vector does not trigger secondary protein expression, then the difference between the two cell lines would represent an overlay of functions. To overcome this problem, a regulated expression of ETT, as in our doxycycline-inducible system, might be useful: the function of a secondary protein, expressed stably after transfection and selection, would not show up in the difference between expression off and on states. Moreover, with regulated expression the number of transporters per cell can be modulated; transport function should then increase with transporter number concordantly for two substrates.
Ipratropium was reported (Nakamura et al., 2010) as a substrate for ETTh expressed in 293 cells at very low TEs of 0.11 µl/min per milligram of protein (from Vmax/Km = 238 pmol/5 min per milligram of protein/444 μM; see Nakamura et al., 2010, their Fig. 5A) and 0.45 µl/min per milligram of protein (Nakamura et al., 2010, their Fig. 6E; increase of uptake over cells transfected with empty vector, in the presence of sodium). In our assays, an uptake corresponding to a TE of 1 µl/min per milligram of protein would have been detected easily, but we did not get any increase (Fig. 4). Note that Tamai and coworkers (Nakamura et al., 2010) used tritium-labeled chemicals in their study. A conceivable risk of the use of radiotracers in uptake assays is that small radiolabeled fragments generated by chemical decay of the radiotracer are scored by liquid scintillation counting, as for the original compound; thus, the signal in transporter-positive lysates could originate from fragments, but not from the intact radiotracer (Grigat et al., 2009). LC-MS/MS, by contrast, has the advantage of high specificity because in selected reaction-monitoring mode, molecules will be detected only if they pass two separate mass filters.
Uptake of oxaliplatin by ETT expressed in 293 cells was characterized only scantily (Jong et al., 2011); at the shortest reported incubation time of 1 hour, the TEs can be calculated from the increase of uptake over cells transfected with empty vector as 0.02 µl/min per milligram of protein (ETTr) and 0.007 µl/min per milligram of protein (ETTh) (Jong et al., 2011, their Fig. 1, a and b). Because 14C-oxaliplatin was used, the same reservations apply as outlined above for ipratropium.
Unlabeled metformin was measured by HPLC with UV detection at a very high concentration (3 mM) and for very long incubation times (Nakamichi et al., 2013); the TEs, calculated from the signal differences in the figures, were 0.014 (ETT from mouse; Nakamichi et al., 2013, their Fig. 5a, 120 minutes), at most 0.02 (ETT from mouse; Nakamichi et al., 2013, their Fig. 6a, 180 minutes), and 0.016 µl/min per milligram (ETTh; Nakamichi et al., 2013, their Fig. 5d, 80 minutes). Because of these conditions and the tiny TEs, the differences observed probably represent subtle differences between cell lines (untransfected or transfected with empty vector versus vector + ETT cDNA) rather than initial rates of ETT transport activity.
Our gabapentin data, for a change, confirm previous results, where ETTh was expressed in 293 cells and incubated for 10 minutes with 10 µM 3H-gabapentin; the TE was 1.4 µl/min per milligram (calculated as 18.3 − 4.6 = 13.7 pmol/min per milligram of protein divided by 10 µM) (Urban et al., 2008). Yet, this TE is approximately 100-fold lower than the TE for ET (50–200 µl/min per milligram of protein). Therefore, gabapentin must also be classified as a poor substrate of the ETT, only slightly better than TEA (0.8 µl/min per milligram) and carnitine (0.6 µl/min per milligram), but markedly worse than, for example, stachydrine (proline betaine) (Gründemann et al., 2005). In fact, the feeble transport of gabapentin corroborates the exquisite specificity of the ETT, since it is the only compound tested here that is at least remotely similar in structure to ET (Fig. 1; both compounds are zwitterions).
Acetylcholine has been suggested as another substrate of ETT. In the approach by Indiveri and coworkers (Pochini et al., 2011), the protein is expressed in Escherichia coli and then reconstituted into proteoliposomes. However, it is obvious that this system does not yield valid transport data: the uptake of 14C-TEA was 8-fold higher and the uptake of 3H-carnitine was 1.3-fold higher than the uptake of 3H-ergothioneine (Pochini et al., 2011). By contrast, it has been established by heterologous high-fidelity expression of ETT in living eukaryotic cells that the uptake of ET is 100-fold higher than the uptake of TEA and carnitine (see TE data above). Not surprisingly, we could not observe an ETT-mediated increase of acetylcholine accumulation in our assays (10 or 100 µM acetylcholine; incubation time, 1 minute; data not shown).
In conclusion, this study contradicts several previous reports on additional substrates of the ETT. The ETT remains highly specific for its physiologic substrate ET; it does not provide multiple substrate specificities, and it is not a transporter of cationic drugs. Only compounds that are related in substructure to ET—for example, gabapentin, carnitine, and TEA—can be transported, but with very low efficiency. Thus, ETT persists as a specific molecular indicator of ET activity.
Acknowledgments
We thank Samira Boussettaoui, Simone Kalis, and Kathi Krüsemann for skillful technical assistance.
Authorship Contributions
Participated in research design: Gründemann.
Conducted experiments: Tschirka, Kreisor, and Betz.
Performed data analysis: Gründemann.
Wrote or contributed to the writing of the manuscript: Tschirka and Gründemann.
Footnotes
- Received January 9, 2018.
- Accepted March 8, 2018.
This research did not receive any specific grant from funding agencies in the public, commercial, or not-for-profit sectors.
Abbreviations
- ET
- ergothioneine
- ETT
- ergothioneine transporter
- ETTh
- human ergothioneine transporter
- ETTr
- rat ergothioneine transporter
- GSH
- glutathione
- HPLC
- high-performance liquid chromatography
- LC
- liquid chromatography
- LTR
- long terminal repeat
- MS/MS
- tandem mass spectrometry
- TE
- transport efficiency
- Copyright © 2018 by The American Society for Pharmacology and Experimental Therapeutics


