


Abstract
The active enantiomer R-Praziquantel (PZQ) shows a clinically lower relative exposure when administered enantiomerically pure compared with a racemic form. We investigated the hypothesis that enantiomer-enantiomer interactions on cytochrome P450 (P450) enzymes could explain this observation and aimed to further deepen the understanding of PZQ metabolism. First, in an in vitro metabolite profiling study, the formation of multiple metabolites per P450, together with an observed interconversion of cis-4'-OH-PZQ to trans-4'-OH-PZQ in human hepatocytes, pointed out the inadequacy of measuring metabolite formation in kinetic studies. Thus, a substrate depletion approach to study PZQ enantiomeric interactions was applied. Second, an abundant CYP3A4 metabolite found in previous studies was structurally characterized. Third, substrate depletion methodologies were applied to determine P450 enzyme kinetics of PZQ and to further estimate enantiomer-enantiomer inhibitory parameters. A competitive inhibition between PZQ enantiomers for CYP2C9, 2C19, 3A4, and 3A5 was revealed. Analyses considering the clearance of only one or both enantiomers provided comparable enantiomer-enantiomer inhibition estimates. To conclude, this paper provides new insights into PZQ metabolic profile to enable a better understanding of enantioselective pharmacokinetics using substrate depletion-based methods.
SIGNIFICANCE STATEMENT In this study, enantiomer-enantiomer interactions of praziquantel on cytochrome P450 metabolizing enzymes are investigated via substrate depletion measurement using modeling methods. Together with new insights into the praziquantel metabolism, this work provides a novel data set to understand its pharmacokinetics.
Introduction
Racemic praziquantel (PZQ) is the World Health Organization’s drug of choice to treat Schistosomiasis (World Health Organization, 2009), a neglected tropical disease affecting 207 million people worldwide (http://www.who.int/en/news-room/fact-sheets/detail/schistosomiasis). Given the prevalence of this disease in young children (3 months to 6 years) (Stothard et al., 2011), the Pediatric Praziquantel Consortium (http://www.pediatricpraziquantelconsortium.org) aims to develop a pediatric formulation for this population (Bonate et al., 2018). Considering the recommendations from Research and Training in Tropical Diseases on switching to an enantiomerically pure formulation of the active form R-PZQ (WHO, 2007), one goal of the Pediatric Praziquantel Consortium was to clinically compare racemic (rac-PZQ) versus pure R-PZQ formulations (WHO, 2010), with the expectation that an enantiomeric pure formulation will result in a smaller orally disintegrating tablet (ODT) with less bitter taste, as inactive S-PZQ mainly contributes to unpleasant taste (Meyer et al., 2009). One outcome of the subsequent clinical study was that the administration of enantiomerically pure R-PZQ (20 mg/kg) resulted in 40% relative bioavailability when compared with rac-PZQ (40 mg/kg total, containing 20 mg/kg of R-PZQ) (Bagchus et al., 2019). This could be indicative of enantiomer-enantiomer interactions, and thus in vitro investigations were triggered. In this context, because of its complex metabolism, PZQ emerged as a case study to apply substrate depletion approaches to study metabolism-based drug-drug interactions. Particularly, multiple metabolites have already been described in reactions with recombinant human P450 (rhP450) and human liver microsomes (HLM), for which different kinetic values have been obtained for CYP2C9 and 3A4 depending on the metabolite measured (Wang et al., 2014). Moreover, while R,S-cis-4’-PZQ-OH isomers are the main metabolites in HLMs, R,S-trans-4’-PZQ-OH isomers are the most abundant metabolites in humans (Melo et al., 2005), and the mechanism behind this apparent discrepancy remains unclear to date.
Considering this background, the aim of this work was to characterize PZQ metabolism and evaluate if the lower exposure of R-PZQ when administered alone relative to an administration as Rac-PZQ could be explained by drug-drug interaction between the R and S enantiomers at the P450 level. For this purpose, it was studied whether the complexity of its metabolic mechanisms makes metabolite formation measurement inappropriate for kinetic profiling. The kinetic parameters (Km and Vmax) for drug metabolizing enzymes are important to understand in vitro drug clearance and, consequently, in vivo pharmacokinetics (PK) and dose-exposure relationships. Their determination is classically based on the rate of product formation at various substrate concentrations. Alternatively, monitoring of substrate depletion has been proven as an effective approach (Obach and Reed-Hagen, 2002; Nath and Atkins, 2006; Sjögren et al., 2009) when metabolite measurement becomes inappropriate, e.g., instability of metabolites or lack of standards, or for drugs presenting multiple reaction pathways leading to different Km values for a single enzyme. Moreover, this approach has notably been applied to the study of doxazosin enantiomer P450 interactions (Kong et al.; 2015). Complexity of PZQ metabolism led us to use the substrate depletion method instead of metabolite formation.
Materials and Methods
Materials
Ultrapure water was produced from a Milli-Q purification system (EMD Millipore, Billerica) before each assay. Potassium phosphate buffer (500 mM, pH 7.4) was prepared using potassium dihydrogen phosphate and dipotassium hydrogen phosphate. These salts, as well as MgCl2, were obtained from Merck KGaA (Darmstadt, Germany). Praziquantel (PZQ), R- and S-cis-4’-PZQ-OH, and R- and S-trans-4’-PZQ-OH were obtained from Merck KGaA small molecule library. Internal standards racemic PZQ-(cyclohexyl-d11) (PZQ-d11) and trans-PZQ-OH-d5 were purchased from Toronto Research Chemicals (Toronto, Canada). CYP2C19 reference substrate omeprazole was obtained from Calbiochem. Internal standard propranolol and all other reference compounds used as positive controls were obtained from Sigma Aldrich (Schnelldorf, Germany), i.e., 7-ethoxycoumarin (CYP1A1-1A2), efavirenz (CYP2B6), amodiaquine (CYP2C8), diclofenac (CYP2C9), dextromethorphan (CYP2D6), and testosterone and midazolam (CYP3A isoforms) as well as reference substrates for hepatocyte clearance ketoprofen, naloxone, and verapamil. All other reagents, solvent, and chemicals were of appropriate grade and purchased from Sigma Aldrich.
NADPH-generating system was obtained from Promega GmbH (Madison). Bactosomes (human cytochrome P450s coexpressed with human NADPH-cytochrome P450 reductase in bacterial membrane) were purchased from Cypex Ltd (Dundee, UK). InVitroGRO Krebs-Henseleit buffer, thawing HT medium, pooled (mixed gender) (HLM) and human cryopreserved hepatocytes (hHep) were obtained from BioreclamationIVT (Baltimore).
rhP450 Incubations with PZQ
All incubations were performed in 96-well conical bottom plates (0.3 ml) in a Thermomixer (Eppendorf AG, Hamburg, Germany) at 37°C under stirring conditions. Reactions were run in duplicate (intra-assay n = 2), and at least two interassay replicates (N) were performed. NADPH-generating system (final 1.3 mM NADP, 3.3 mM glucose-6-phosphate, 3.3 mM MgCl2, and 0.4 U/ml glucose-6-phosphate dehydrogenase) in potassium phosphate buffer (final 100 mM, pH 7.4) was prewarmed for 5 minutes at 37°C (60 µl/well). DMSO intermediate solutions of substrates (500×) were prepared and diluted 1:250 in 37°C prewarmed water to obtain a 2× working solution, which was added to the to prewarmed NADPH-containing solution (75 µl/well). After 5 minutes of preincubation, prewarmed rhP450s (10×, 15 µl/well) were added to start the incubation, which had a total volume of 150 µl and contained 0.2% (v/v) DMSO. rhCYP1A2, 2B6, 2C8, 2C9, 2C19, 2D6, 3A4, 3A5, and 3A7 were used in PZQ incubations at a concentration of 50 pmol P450/ml. rhCYP1A1 and rhCYP2C19 were used at 17.5 and 20 pmol P450/ml, respectively, because of faster turnover. Reaction monitoring was conducted under initial linear rate conditions (typically 0–30 minutes) by quenching aliquots into an ice-cold solution (100 µl) containing internal standards [65/35 (v/v) acetonitrile (ACN)/water, 300 nM propranolol, 60 nM PZQ-d11]. After centrifugation (4000g, 50 minutes, 4°C), supernatants were diluted prior to analysis by LC-MS/MS, ensuring the same final proportion of 25% (v/v) ACN for all samples. Calibration standard samples were prepared using a matrix consistent with experimental samples and were equally diluted.
R-PZQ, S-PZQ, and rac-PZQ were tested at 1.0 µM for CLint determination (N = 3). Initial tests were performed to determine reaction linearity and protein binding effects. For the determination of the kinetic parameters, 10 concentrations log-scale distributed over a concentration range of 200–0.01 µM were used (N = 2). Based on initial linearity experiments, measured time points were adjusted for rhCYP1A2, 2C9, 2D6, 3A4, and 3A5 to 0, 5, 10, 20, and 30 minutes; for rhCYP1A1 and 2C19 to 0, 4, 8, 16, and 24 minutes; and for rhCYP3A7 to 0, 5, 10, 20, 30, 50, and 75 minutes. A selection of samples (1 and 10 µM, 0 and 30 minutes) were analyzed by LC-qTOF for metabolite profiling. For Ki determination, R-PZQ and S-PZQ were incubated with selected rhP450s in a 7 × 7 matrix ratio (N = 2), at concentrations equivalent to 5, 2, 0.8, 0.32, 0.12, 0.05, and 0 Km values (where 0 Km are incubations with “substrate enantiomer” in the absence of “inhibitory enantiomer”). Parallel incubations with specific reference compounds for each P450 isoform were used as positive controls (1 µM, n = 2), i.e., 7-ethoxycoumarin for CYP1A1/2, efavirenz for CYP2B6, amodiaquine for CYP2C8, diclofenac for CYP2C9, omeprazole for CYP2C19, dextromethorphan for CYP2D6, and testosterone and midazolam for CYP3A4/5/7. Negative control was carried out using membrane protein isolated from Escherichia coli host strain.
Microsomal Incubations for PZQ Metabolite Profiling
R-PZQ, S-PZQ, and rac-PZQ (final 1 and 10 µM) were dissolved in 4.5 ml 100 mM potassium phosphate buffer with 1.0 mM MgCl2 in 15-ml glass tubes and mixed with the addition of the respective HLM (1 mg/ml). Incubations (37°C, 150 rpm) were started by pipetting a 2-ml aliquot of this mixture in a new vial and adding 200 µl 20 mM NADPH solution and were terminated at timepoints 0, 15, 30, and 60 minutes by quenching in ice-cold ACN. Control incubations with buffer were performed in parallel.
Hepatocyte Incubations with PZQ and its Metabolites
For metabolite identification purposes, R-PZQ, S-PZQ, and rac-PZQ were used at a final concentration of 1 and 10 µM. For metabolite interconversion studies, compounds were tested at a final concentration of 5 and 10 µM, except for M6 (estimated concentration 2.5 µM), and at least two interassay replicates were performed (N ≥ 2). Stock solutions of selected compounds were spiked into Krebs-Henseleit buffer to lead to a 2× solution and prewarmed in small 1.5-ml centrifuge tubes with a Thermomixer at 37°C and 450 rpm. hHeps were thawed and plated in a 24-round well plate (final 2 × 10e6 cell/ml, 450 µl/well) according to the manufacturer’s protocol. Reactions were initiated by addition of prewarmed compound (1:1, 450 µl/well) to hHeps (37°C), incubated under stirring conditions (37°C, 5% CO2, 100 rpm). Aliquots were collected over time up to 180 minutes and were terminated by quenching in ice-cold ACN. Control incubations with buffer and reference substrates ketoprofen, naloxone, and verapamil were performed in parallel.
Production of PZQ Metabolite M6
M6 was produced by a scale-up reaction of each PZQ enantiomer (125 nmol) with rhCYP3A4 (1.37 nmol P450) in a total of 25 ml of potassium phosphate buffer (100 mM, pH 7.4) containing NADPH (1.2 mM) and 3.3 mM MgCl2. Reaction was performed as previously described and quenched after 40 minutes by addition into ice-cold ACN (37.5 ml total). After centrifugation to remove pellet, supernatant was concentrated. Semipreparative high-performance LC (HPLC) was carried out on a Hitachi L-6200 pump equipped with a Hitachi L-4200 UV-visible detector (Tokyo, Japan) and with a column Chromolith Performance RP-18e (monolithic, 4.6 × 100 mm) (Merck Millipore), using water (A) and ACN (B) as mobile phases. Purification was performed at room temperature at a flow rate of 1 ml/min, applying a multisegmented gradient from 0% to 25% B in 7 minutes, 25%–30% B in 3 minutes, 30%–55% B in 5 minutes, 55%–80% B in 5 minutes, and 80% B for 5 minutes where M6 was detected and concentrated. Estimated final purity was >95% (HPLC-UV).
Instrumentation and Analysis
Quantitative LC-MS/MS Analysis.
Waters Acquity LC system consisted of a Waters Acquity binary solvent manager, column manager, and autosampler set up at 15°C (Waters, Eschborn, Germany). The mobile phases were ammonium formate (10 mM) with 0.1% formic acid (A) and ACN with 0.1% formic acid (B). Waters Acquity Ethylene Bridged Hybrid (BEH) C18 column (1.7 µm, 2.1 × 50 mm) equipped with a Waters Acquity UPLC BEH C18 precolumn (1.7 μm, 2.1 × 5 mm) was used for nonchiral separations at 40°C, whereas Phenomenex Lux Cellulose-2 column (3 µm, 2 × 150 mm) (Phenomenex, Torrance) equipped with a Phenomenex Lux Cellulose-2 precolumn (3 mm inner diameter) at 22°C was used for chiral separations. Mass spectrometry was performed with a quadrupole ion trap 5500 mass spectrometer (AB Sciex, Darmstadt, Germany). Instrument control, data acquisition, and evaluation were performed using Applied Biosystems/MDS Sciex Analyst software version 1.6.3 (AB Sciex). Analyte concentration was calculated by interpolating relative peak area to internal standard peak area on the corresponding calibration curve set. If needed, concentrations tested per each assay were grouped, and each group was diluted and analyzed using different calibration standard curves equally treated to be within MS/MS linear dynamic range. Nonchiral analysis of (R,S)-PZQ and (R,S)-M6 was performed using BEH C18 column and applying a linear gradient method at a flow of 0.7 ml/min of 0% B isocratic for 0.1 minute, 0%–100% B for 1.14 minutes, 100% B for 0.3 minutes, and 0% B for 0.5 minutes. For chiral analysis of (R,S)-PZQ and (R,S)-M6, Phenomenex Lux column was employed and isocratic conditions at a flow of 0.45 ml/min were used as follows: 85% B for 4.0 minutes, 100% B for 1.8 minutes, and 85% B for 1.2 minutes. Chiral analysis of all 4’-OH-PZQ metabolites was performed with Phenomenex Lux column using water with 0.1% formic acid (A) and ACN with 0.1% formic acid (B) at a flow of 0.36 ml/min and isocratic conditions of 36% B for 6.0 minutes, followed by a wash with 100% B for 3.0 minutes. LC effluent was introduced into the mass spectrometer in positive ion mode, having entrance potential at 10 V and ion spray temperature at 600°C. The multiple reaction monitoring transitions of the precursor ions (M + H)+ to the corresponding product ions were m/z 313.2 to 203.2 for PZQ, 329.16 to 203.25 for (R,S)-(cis,trans)-4’-OH-PZQ metabolites, and 329.16 to 311.08 for (R,S)-M6. The following transitions were used for internal standards: 324.2 to 204.0 for PZQ-d11, 334.307 to 132.053 for trans-4’-OH-PZQ-d5, and 260.2 to 183.1 for propranolol.
Metabolite Profiling by LC-qTOF.
Metabolite separation was performed on a Waters Acquity UPLC system, consisting of a Waters Acquity binary solvent manager, column manager, photodiode array detector, and autosampler set up at 10°C coupled to a Xevo G2-S qTOF mass spectrometer (all from Waters) operated in electrospray ionization positive mode. Metabolite identification was performed on a Waters UPLC HSS T3 column (1.8 µm, 100 × 2.1 mm) using eluent A (water + 0.1% formic acid) and eluent B (ACN + 0.1% formic acid) with a linear gradient at a flow of 0.6 ml/min starting with 2% eluent B until 0.5 minutes and then changing to 25% B at 2.4 minutes, 30% B at 3.3 minutes, 65% B at 6.6 minutes, 95% B at 6.7 minutes, and equilibrating back at 2% B until 14.1 minutes. Metabolite identification was supported by UNIFI version 1.8.2 (Waters) and MassMetasite/WebMetabase version 3.3 (Molecular Discovery, Perugia, Italy).
Structural Elucidation of PZQ Metabolite M6.
NMR of purified M6 was performed at 298 K on a 700 MHz Bruker Avance III equipped with a 5-mm cryocooled triple resonance probe. All samples were dissolved in DMSO-d6. 1H NMR spectra were acquired with 64 k time domain points, a spectral width of 20 ppm, a relaxation delay of 10 seconds, and 256 scans. Water suppression was achieved by presaturation of the water signal at 3.3 ppm using the Bruker zgpr standard pulse sequence. Edited heteronuclear single quantum coherence NMR spectra were acquired with 1024 × 256 time domain data points over a spectral width of 12 ppm in the t2 and 165 ppm in the t1 dimension. Homonuclear correlation spectroscopy (COSY) NMR spectra were acquired with 1024 × 256 time domain data points over a spectral width of 12 ppm in the t2 and t1 dimension.
Data Analysis
A detailed overview of the kinetic parameters analyzed with abbreviations and units is given on Supplemental Table 7.
In Vitro Enzyme Kinetics Based on Substrate Depletion.
Substrate saturation data were analyzed using GraphPad Prism version 6.05 and higher (GraphPad Software, La Jolla, CA). Using substrate concentrations (S, in micromolars) over time (t, in minute), first-order depletion constant (kdep, in minute−1) based on remaining compound (in %) was calculated with eq. 1 and further used to determine the intrinsic clearance (CLint) at 1.0 µM using eq. 2 and considering P450 concentration (CrhCYP): (1)
(1) (2).For intrinsic clearance measurements at a single concentration, P450 concentration was expressed in picomole P450 per microliter to give CLint values in microliters per minute per picomole P450. The threshold of relevance was calculated considering <75% remaining compound after incubation time. Propagated intra-assay and interassay variations (S.D., CV) were calculated.
The enzyme kinetic parameters were determined by the multiple substrate depletion curves method (Obach RS and Reed-Hagen AE, 2002; Sjögren et al., 2009), using as basis the nonlinear regression defined by Nath and Atkins (2006) in eq. 3, where Km (in micromolar, i.e., micromole substrate per liter) is the Michaelis constant, νmax (in micromole substrate per liter per minute) is the maximum depletion rate not normalized to rhP450 concentration, and, thus, νmax/Km (in minute−1) equals the theoretical maximum consumption rate constant at an infinitesimally low substrate concentration, i.e., kdep(S = 0) ∼ kdep(∞). Michaelis-Menten Vmax is obtained by dividing νmax with rhP450 concentration (CrhCYP) (as nanomole P450 per liter), which is further converted to the desired units (picomoles per picomole P450 per minute) by multiplying the result per 1000. (3).kdep were determined for each concentration considering only log-linear time range of disappearance. At least four time points in eight different substrate initial concentrations were selected. This data set was used to plot kdep versus the initial substrate concentration into the sigmoidal-like curve described in eq. 3. Propagated intra-assay and interassay variations (S.D., CV) were considered to flag the data as not converged. S.E.M. (which considers intra- and interassay variability) was used for graphical representations.
Linear Static Modeling for the Determination of Inhibition Constants Based on Substrate Depletion.
Equation 3 was used as basis to define different inhibition models. Competitive inhibition was described by including an observed Km (Km,obs, in micromolar) described in eq. 4, where [I] is the inhibitor concentration (inmicromolar), and Ki is the inhibition constant (inmicromolar). (4),leading to a modified eq. 3 for competitive inhibition as described in eq. 5:
 (5).Noncompetitive inhibition included the concept of an inhibited νmax (νmax,inh) as described in eq. 6:
 (6),leading to a modified eq. 3 for noncompetitive inhibition as described in eq. 7:
 (7).The different nonlinear regression inhibitory equations were fitted to log-linear substrate data, and Akaike’s Information Criteria (AIC) was used to diagnose which inhibition type fitted better. Propagated intra-assay (n = 2) and interassay (N = 2) S.D.s were obtained.
Linear-mixed inhibition was described with a simplified model by introducing apparent νmax and Km concepts described with the alpha constant (dimensionless), which is an indicator of the inhibition mechanism: (8)
(8) (9).
(9).
Nonlinear Dynamic Modeling for the Determination of Inhibition Constants Based on Substrate Depletion.
Dynamic models were developed using the software Phoenix Winnonlin 6.4, NLME 1.3 (Certara, L.P, Princeton, NJ). Competitive and noncompetitive inhibition models were defined. In those models, the concurring kinetics of R-PZQ and S-PZQ were defined by the set of differential equations, eqs. 10 and 11, where the parameters are expressed as previously, i.e., time (t, in minutes, kdep in minute−1) and substrate concentration (i.e., R_PZQ and S_PZQ in micromolars): (10)
(10) (11).In the competitive model, for each enantiomer, an observed Km term (Km,obs) (source eq. 4) was integrated to the expression of kdep as defined respectively in eqs. 4 and 5, with the difference that the inhibitor concentration used for the calculation of the term Km,obs was not the initial concentration of the competing enantiomer but rather its time-dependent concentration.
Similarly for a noncompetitive model, for each enantiomer, a term νmax,inh was integrated to the expression of kdep as defined respectively in eqs. 6 and 7, where the inhibitor concentration used for the calculation of the term νmax was not the initial concentration of the competing enantiomer but rather its time-dependent concentration.
The kinetic parameters were estimated for each P450 by fitting the two differential eqs. 10 and 11 to the R- and S-PZQ concentrations measured in the inhibition experiments, using a quasi-Newton optimization algorithm and minimizing the negative log-likelihood implemented in the modeling software. Complete sets of equations can be found in the Supplemental Material (Supplemental Table 8).
Results
Metabolite Identification of PZQ Enantiomers.
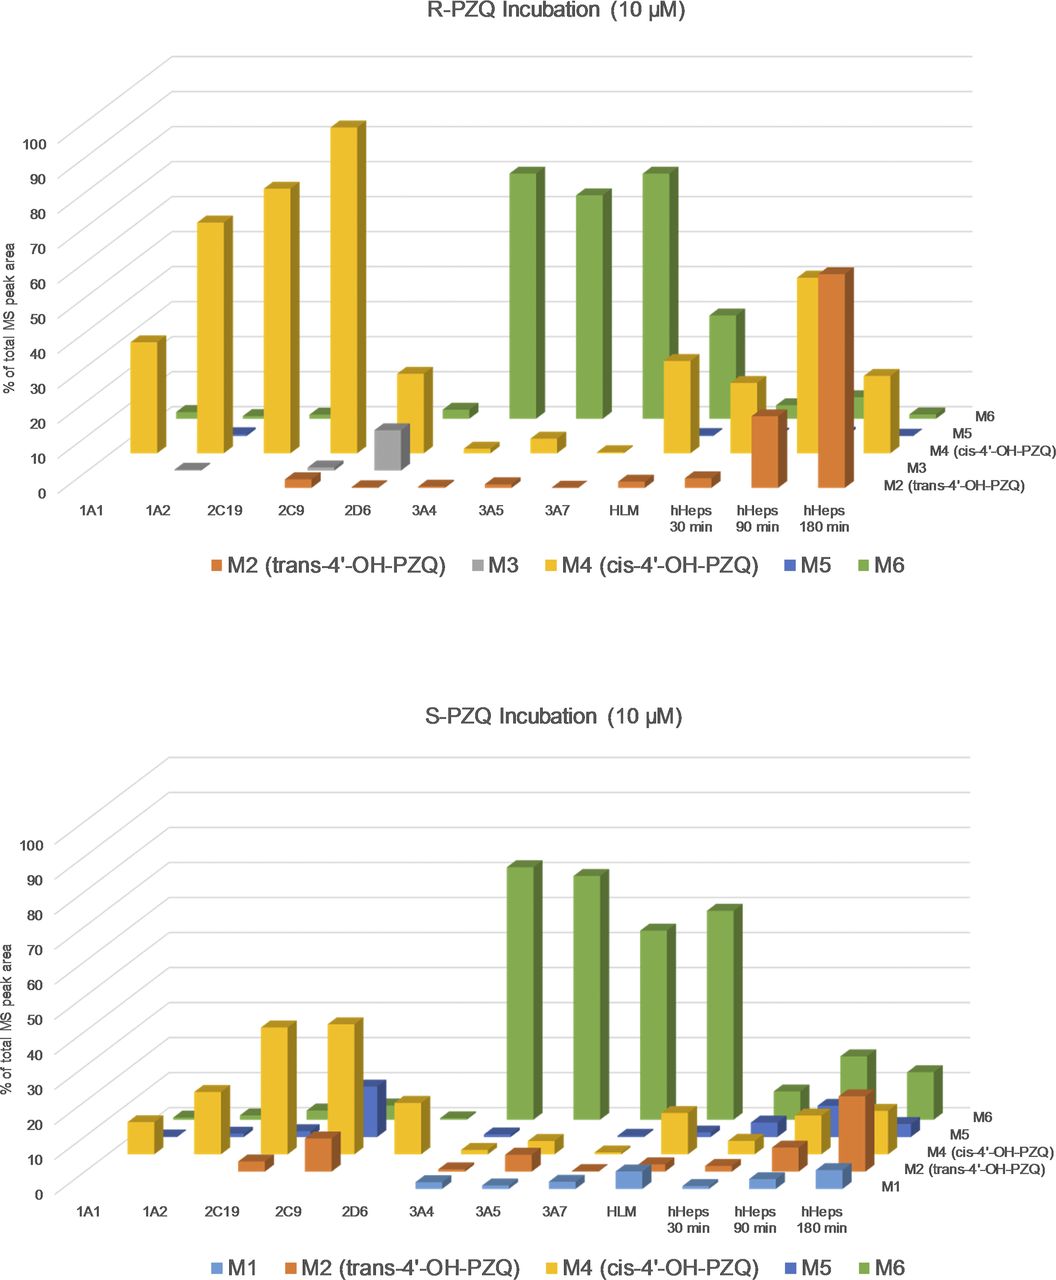
Metabolite profiling and identification of single PZQ enantiomers and PZQ racemate in incubations with recombinant human P450 enzymes (i.e., CYP1A1, 1A2, 2B6, 2C8, 2C9, 2C19, 2D6, 3A4, 3A5, and 3A7), HLMs, and hHeps revealed in total six mono-oxidized metabolites (see Figs. 1 and 2; Supplemental Tables 1 and 2) and several further secondary oxidative metabolites (+32 and +14 Da) (data not shown). This is in line with the already published data (Huang et al., 2010; Wang et al., 2014). From the mass spectrometric elucidation, oxidation to metabolites M1, M5, and M6 could be allocated to the “core moiety” (i.e., hexahydro-pyrazino [2,1-a]isoquinolin-4-one ring system), whereas all other metabolites (M2 = trans-4‘-OH-PZQ, M4 = cis-4‘-OH-PZQ, and M3 = exact structure unknown) could be assigned to an oxidation on the cyclohexane ring (Fig. 1; Supplemental Tables 1 and 2). Comparison of the mono-oxidation metabolites formed in the different test systems (Fig. 2) indicated that hHeps are the biologic system where trans-4‘-OH-PZQ becomes the major isomer instead of cis-4‘-OH-PZQ. Metabolite identification in incubation of racemic-PZQ was performed, which confirmed the findings of the enantiopure PZQ incubations (data not shown). Moreover, given its relative abundance in CYP3A incubations, M6 was further isolated from scaled-up incubation of both R- and S-PZQ with CYP3A4 and characterized by NMR analysis (Supplemental Figs. 1–4), which confirmed to correspond to the structbhure M6 shown in Fig. 1. R- and S-M6 spectra were identical by NMR (Fig. 4). Attempts to distinguish both products via enantioselective HPLC were inconclusive. NMR structural elucidation of M6 resulted on the following signal assignment: 1H NMR (700 MHz, DMSO-d6) δ 7.62 (d, J = 7.6 Hz, 1H), 7.38–7.27 (m, 3H), 7.23 (d, J = 6.7 Hz, 1H), 4.61 (d, J = 18.1 Hz, 1H), 4.58–4.51 (m, 1H), 4.41 (d, J = 13.2 Hz, 1H), 3.62 (d, J = 18.1 Hz, 1H), 3.38 (d, J = 13.6 Hz, 1H), 3.07–2.97 (m, 1H), 2.89–2.81 (m, 1H), 2.81–2.70 (m, 2H), 1.77–1.61 (m, 4H), and 1.47–1.12 (m, 6H).

Transformation pathway of PZQ mono-oxidations in hHeps. If oxidation site is not confirmed, potential oxidation sites are indicated with a gray circle in the metabolite structure. Both R- and S-PZQ are metabolized to cis-4'-OH-PZQ (M4), trans-4'-OH-PZQ (M2), M5, and the herein characterized M6 structure with its oxidation site at carbon-11b. Enantioselective transformations, i.e., M3 for R-PZQ and M1 for S-PZQ, are represented at left and right side, respectively. Moreover, the proposed enzymatic cis to trans conversion occurring in hHeps is illustrated.

Relative abundance of the mono-oxidation metabolites of R- and S-PZQ formed in rhP450s, HLM, and hHeps. Mono-oxidation metabolites are represented in different format and arranged along the z-axis. Relative abundance of metabolite is given by the total MS peak area (%) and scaled over y-axis. Test system (rhP450 isoform, HLM, or hHeps) is indicated on the x-axis. For rhP450s and HLM, values at 30-minute incubation time are represented, whereas for hHeps, three time points are given (30, 90, 180 minutes).
Metabolite Interconversion in Human Hepatocytes.
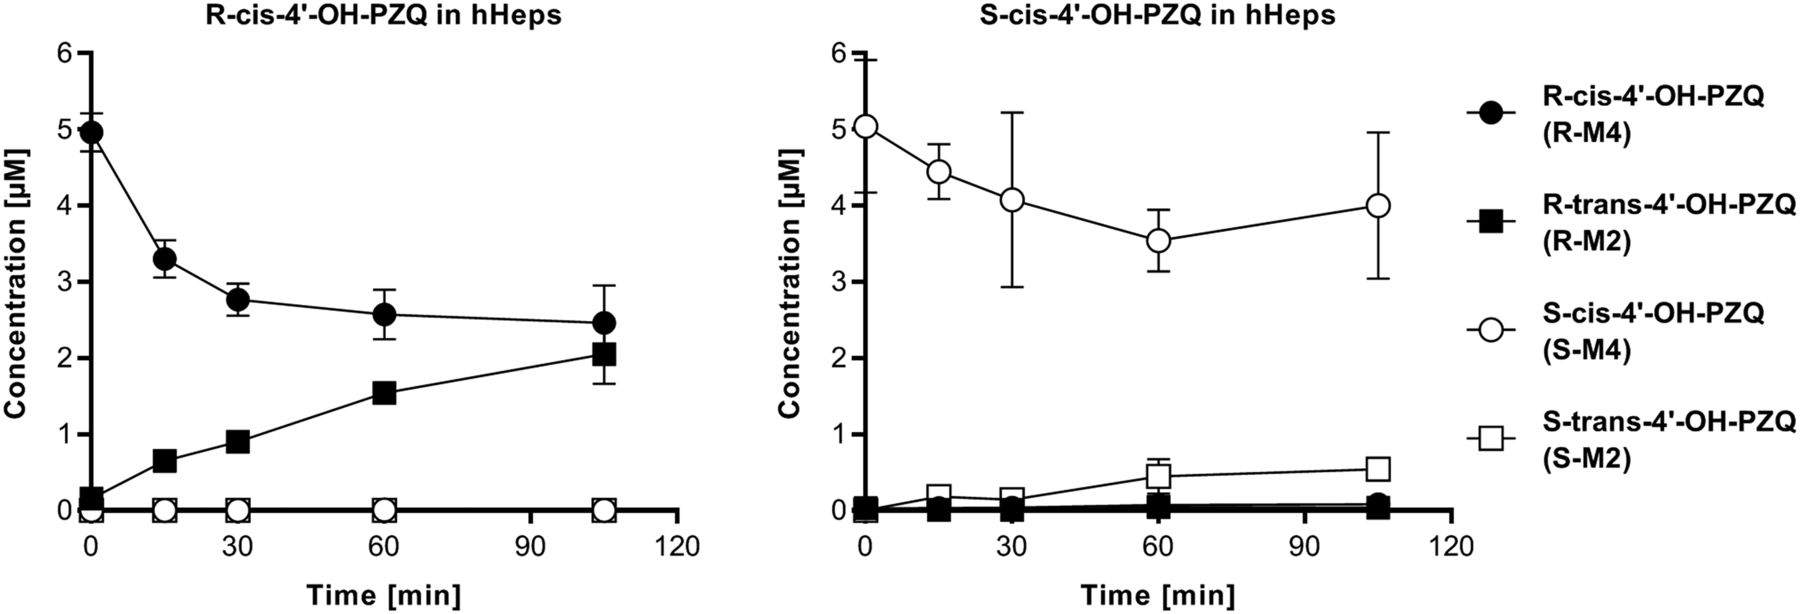
The metabolic stability of PZQ and selected metabolites, i.e., trans-4'-OH-PZQ (M2), cis-4'-OH-PZQ (M4), and M6 metabolites from both R- and S-PZQ, was further studied in hHep incubations. R-PZQ and S-PZQ presented a similar clearance at 5–10 µM (19 and 16 µl/min/10e6 cells, respectively), and no chiral inversion was observed. Incubations of PZQ metabolites with hHeps revealed an interconversion of R-cis-4'-OH-PZQ to R-trans-4'-OH-PZQ and to a lower extent from S-cis-4'-OH-PZQ to S-trans-4'-OH-PZQ (Fig. 3), which was not observed in any control or other test system. Clearance of R-cis-4'-OH-PZQ (8 µl/min per 10e6 cells) was comparable to the clearance of parent R-PZQ, and R-trans-4'-OH-PZQ formation rate from R-cis-4'-OH-PZQ (29 pmol/min per 10e6 cell) was threefold higher in comparison with formation from parent R-PZQ (9 pmol/min per 10e6 cell) (Supplemental Table 3). This finding could be due to the presence of a nonmicrosomal enzyme, which could then partially explain why R-trans-4'-OH-PZQ is a major metabolite in hepatocytes and in vivo but not in HLM or rhP450s. Hepatocyte incubations of S-cis-4'-OH-PZQ result on a lower clearance (3 µl/min per 10e6 cells) in comparison with parent S-PZQ and lead to the formation of S-trans-4'-OH-PZQ (formation rate 6 pmol/min per 10e6 cell), which is similar to S-cis-4'-OH-PZQ formation rate starting from S-PZQ (4 pmol/min per 10e6 cell). Overall, a net increase of S-cis-4'-OH-PZQ from S-PZQ can be observed in hepatocytes at incubation times from 30 via 90 to 180 minutes, whereas R-cis-4'-OH-PZQ level from R-PZQ incubations decreases between the 90- and 180-minute time points, as shown in Fig. 2.

Interconversion of cis-4'-OH-PZQ metabolites in hHeps. Time-course measurement of all 4’-OH-PZQ metabolites in incubations of R- and S- cis-4'-OH-PZQ with hHeps revealed a cis to trans interconversion.
Lack of exact analytical standards for M6 hampered its quantification. Nevertheless, M6 stability in hHeps was qualitatively evaluated, and a concentration decrease over time was found (5 µl/min per 10e6 cells), which could explain its very low abundance in hHep incubations with parent PZQ.
Time-Dependent Turnover of PZQ in rhP450s.
To determine the role of human P450 enzymes involved in the metabolic clearance of PZQ, single enantiomers and racemate were incubated with a panel of rhP450 enzymes, i.e., CYP1A1, 1A2, 2B6, 2C8, 2C9, 2C19, 2D6, 3A4, 3A5, and 3A7. Protein binding effect was negligible as demonstrated by control membrane incubations and time-course experiments at different protein concentrations (data not shown); thus, an adjustment for unbound concentrations and clearance was not needed (Sjögren et al., 2009).
A relevant turnover was observed for all P450s except CYP2B6 and 2C8. Comparison of the clearance values between PZQ enantiomers tested at 1.0 µM as single enantiomer (i.e., 100% e.r.) indicated a similar efficiency in metabolizing both enantiomers for CYP2C19, 3A4, and 3A5. Relevant differences were found for the other P450 isoforms; i.e., R-PZQ is a preferred substrate over S-PZQ for CYP1A1, 1A2, 2C9, and 2D6, whereas S-PZQ is preferred over R-PZQ for CYP3A7 (Fig. 1; Supplemental Table 4). By inspecting the catalytic efficiency of the different P450 isoforms, the highest clearance values were found for CYP2C19 metabolizing both enantiomers as well as for CYP1A1 metabolizing R-PZQ. Clearance values of PZQ enantiomers individually tested at 1.0 µM (i.e., 100% e.r.) and evaluated by reverse-phase LC-MS/MS were similar to the clearance values of each PZQ enantiomer tested in a 1.0-µM racemic mixture (i.e., 50% e.r.) and analyzed by enantioselective LC-MS/MS, i.e., below twofold difference (Fig. 4; Supplemental Fig. 5; Supplemental Table 5). This is considered within normal experimental variability, thus indicating that methodological differences did not result in systematic deviations.

In vitro clearance of PZQ enantiomers in the panel of rhP450s. Comparison of CLint between R-PZQ and S-PZQ, either as isolated enantiomer (100% e.r.) or mixed as racemate (50% e.r.). Mean and S.D. of mean is represented.
Determination of Kinetic Values of PZQ Enantiomers for P450 Enzymes Based on Substrate Depletion.
Kinetic differences between PZQ enantiomers were studied by means of evaluating Km and Vmax parameters of each enantiomer, either tested single or as racemate, for P450 isoforms presenting relevant in vitro contribution to the PZQ metabolism (i.e., CYP1A1, 1A2, 2C9, 2C19, 2D6, 3A4, 3A5, and 3A7). Michaelis-Menten parameters were determined based on substrate depletion (Obach and Reed-Hagen, 2002) to consider overall metabolism conducted by each enzyme if multiple substrate positions are oxidized. Following this approach, relevant differences (>twofold) on kinetic parameters between PZQ enantiomers were found (Supplemental Table 6). Higher affinity for R-PZQ over S-PZQ was observed for CYP1A1/1A2, whereas CYP2C19 presented lower Km value for S-PZQ (Fig. 5). Maximum turnover rate (Vmax) was higher for R-PZQ in CYP2C9 and 2C19, whereas Vmax of S-PZQ was greater when cleared by CYP1A1 (Fig. 6). Of note, the estimation of kinetic parameters for low clearance enzymes were associated with high S.D. and thus are not discussed here (e.g., CYP2D6). For those cases, metabolism rate was low and did not increase at low substrate concentrations, resulting in sigmoidal curves tending to flatness.
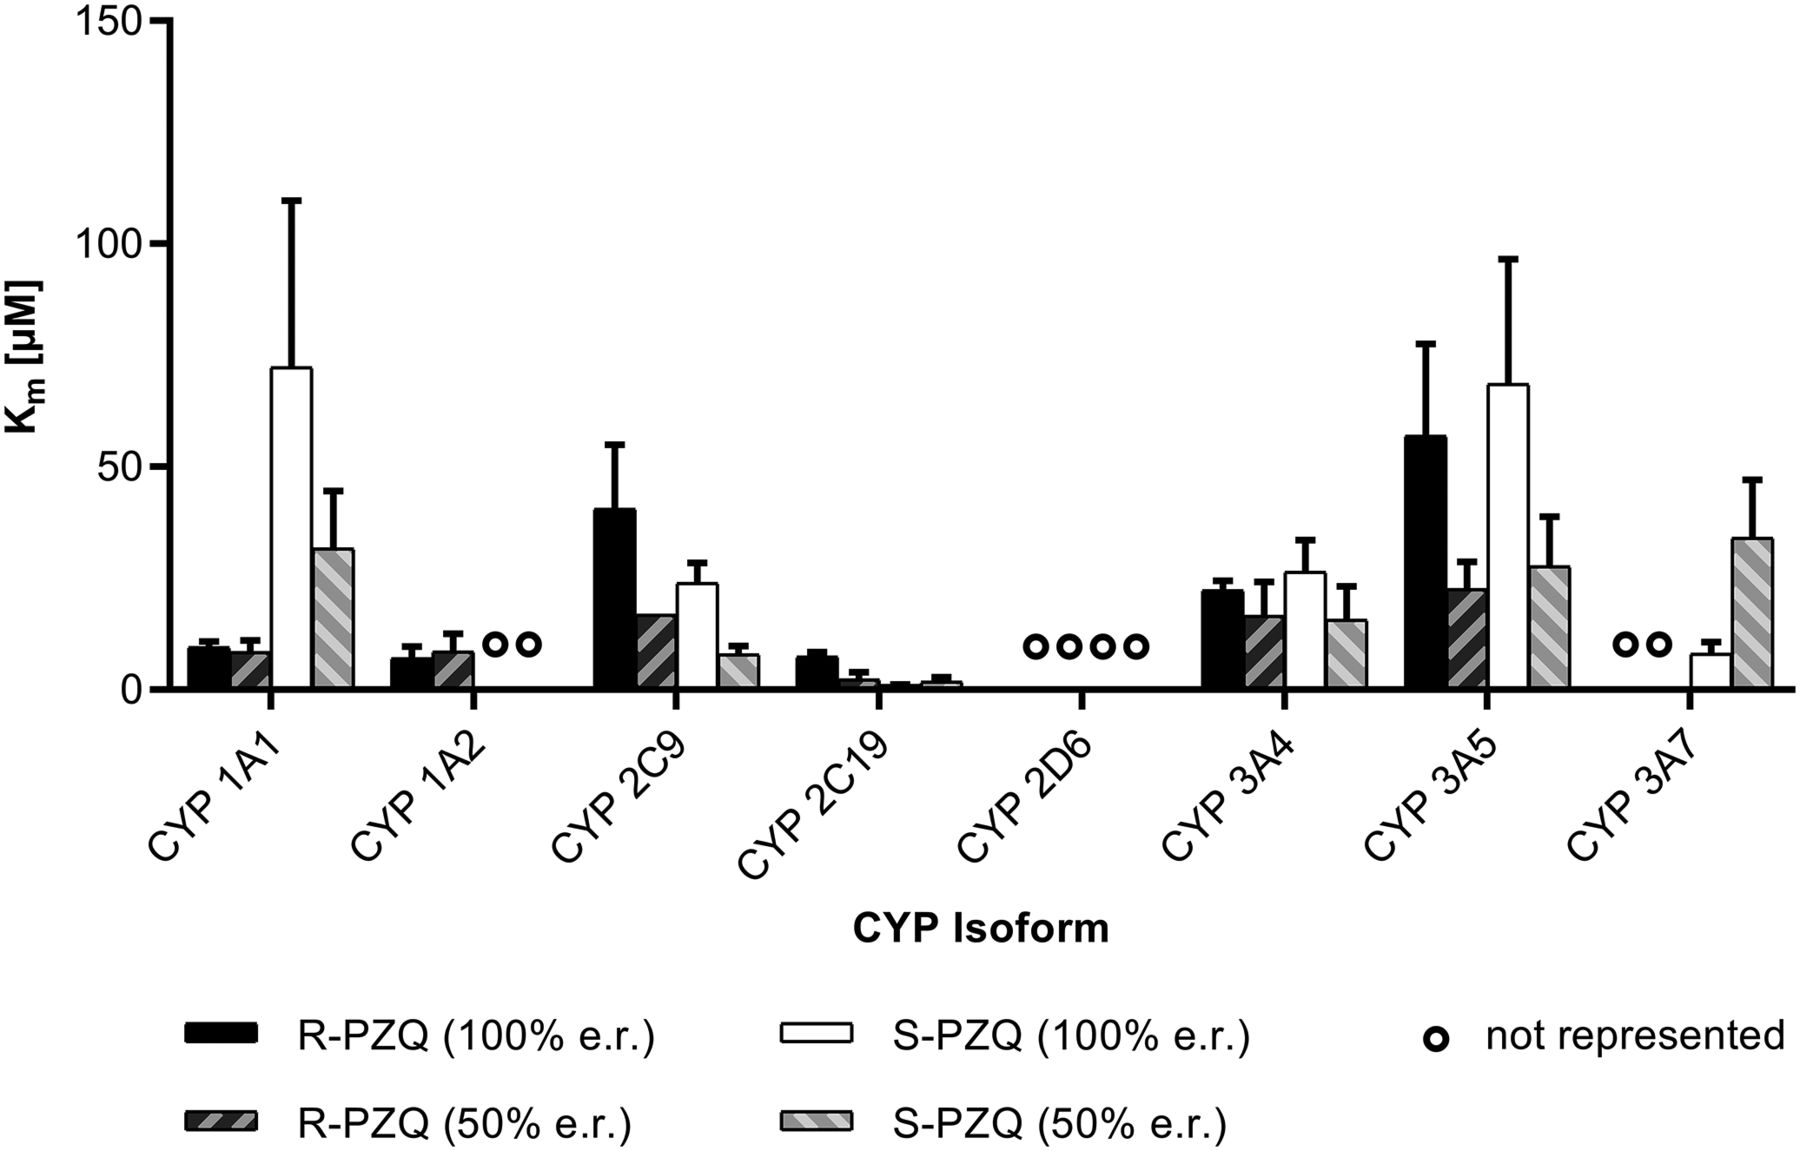
Affinity (as Michaelis-Menten Km value) of PZQ enantiomers for rhP450s. Mean and S.E.M. are represented. Low clearance cases leading to a CV higher than 80% are considered as nonconverged and marked with a “°” sign.

Turnover rate (as Michaelis-Menten Vmax value) of PZQ enantiomers mediated by rhP450s. Mean and S.E.M. are represented. Low clearance cases leading to a CV higher than 80% are considered as nonconverged and marked with a “°” sign.
The kinetic parameters were also determined in the racemic mixture to indicate if enantiomer-enantiomer interactions occurred for any P450, which can be suspected if kinetic parameters of individually tested enantiomers (i.e., 100% e.r.) are different from tested as racemate (i.e., 50% e.r.) (Supplemental Table 6). To visualize the relevance of those differences, a correlation analysis was performed (Supplemental Fig. 6, a and b). A relevant increase in the affinity (>twofold decrease of Km) and decrease in the turnover rate (>twofold decrease of Vmax) of one enantiomer in the presence of the other one was observed for S-PZQ for CYP1A1, R-PZQ for 2C19, and for both enantiomers for CYP2C9. CYP3A5 presented similar behavior, although Vmax fold change (1.9) was just below limits. Contrarily, an apparent affinity decrease (increased Km) and Vmax increase was observed for S-PZQ by CYP3A7 in the presence of R-PZQ. Those differences between enantiomers individually tested (100% e.r.) or in a racemate (50% e.r.) did not result in a net change in the catalytic efficiency (Vmax/Km ratio) and did not differ from the clearance value found at 1.0 µM (< 1.5-fold difference), indicating that those potential interactions were competitive in nature (Supplemental Fig. 6, c and d).
Comparing our substrate depletion-based Km data set (Supplemental Table 6) with metabolite formation-based values using rhP450s by Wang et al. (2014), whereas similar values were found for CYP2C9 (Wang metabolite IV), our CYP3A4 values were sixfold and twofold lower for R-PZQ and S-PZQ, respectively, than following Wang’s metabolite VII formation. Additionally, a mean Km of R- and S-PZQ enantiomers tested as racemate was calculated to compare it with Li’s studies on rac-PZQ in rhP450s following metabolite formation (Li et al., 2003). By means of cis-4'-OH-PZQ formation, our Kms for CYP1A2 and 2C19 were 2.1- and 3.3-fold lower, respectively. By means of Li’s “X-OH-PZQ” formation (potentially our M6), our Km for CYP3A4 was fourfold lower. This could be a consequence of accounting for all reactions occurring with the same P450 instead of just one. As seen in Fig. 1, the relative amount of diverse PZQ metabolites generated for each P450 indicates that these multiple pathways might not be negligible.
Determination of Enantiomer-Enantiomer Interactions.
Generally, if enantiomer-enantiomer inhibition occurs, one enantiomer will play mainly a victim role (namely substrate) and the other one the perpetrator (inhibitor). To determine the inhibition type and estimate the inhibitory constants, two approaches were postulated. The first approach consisted of simplified static modeling in which the metabolism of the inhibitor is not considered, which is based on linear regression calculations, and thus it can be addressed with simple curve fitting software (e.g., Graphpad Prism). The second approach considered the metabolism of all substances involved, thus requiring nonlinear regression analysis tools.
Based on Michaelis-Menten from eq. 3 and the classic inhibition eqs. 4 and 6, formulas were derived for the competitive inhibition (eq. 5), noncompetitive inhibition (eq. 7), and linear-mixed mechanisms by means of substrate depletion rate (eqs. 8 and 9). The linear static approach makes a direct use of these equations, considering that the inhibitor concentration parameter remains constant over time. The nonlinear dynamic approach based on eqs. 10 and 11 considers both substrate and inhibitor concentration as variables over time, coming in eqs. 4 and 5 for the competitive inhibition and eqs. 6 and 7 for the noncompetitive inhibition. Given the relatively moderate fraction unbound of PZQ in plasma (20%, Supplemental Table 10) and the observed linear monoexponential decay of its metabolism, fraction unbound and changes in the enzymatic activity over time (Jones and Houston, 2004; Sjögren et al., 2009) were considered negligible and were not included in the equations.
Generally, it is important to work under initial rate conditions with substrate depletion approaches (Nath and Atkins, 2006). Given the assumptions of the linear static model, this requisite becomes more critical for this model. It is expected that the inhibitory parameters can be determined with more confidence for those cases in which substrate turnover is faster metabolized and inhibitor disappearance over time is negligible. For those cases in which both compounds are metabolized with similar efficiency, the linear static model is expected to result in poor quality estimates.
In this study, enantiomer-enantiomer interaction experiments were conducted by varying both R- and S-PZQ initial concentrations. Concentration ranges were narrowed in comparison with those chosen for the determination of kinetic values because of bioanalytical limitations of simultaneously measuring two analytes at different concentration ranges. Thus, a concentration range was chosen to capture the expected sigmoidal shape at the expense of including limited plateau areas. This is exemplified in Fig. 7 with the interaction study on CYP2C19 metabolism. Assays were performed in selected rhP450s in which an interaction was suspected from previous kinetic comparison of PZQ enantiomers tested individually or in a racemate.

Substrate depletion curve data set based on the linear static model to determine PZQ enantiomer-enantiomer interactions on CYP2C19 metabolism.
First, PZQ enantiomer-enantiomer interactions were investigated by means of linear static models of interaction (Supplemental Table 8; Tables 1 and 2). Km and Vmax values obtained were comparable to those found in kinetic experiments with single PZQ enantiomers (100% e.r.) (< twofold difference), with the exception of S-PZQ metabolized by CYP2C19 (2.4-fold higher Km and 2.6-fold higher Vmax with linear static model) and R,S-PZQ metabolism by CYP3A5 (Km and Vmax values were >2.5-fold lower with linear static model). The good correlation between kinetic values of single PZQ enantiomers and kinetic values using inhibition linear static modeling demonstrated that tightening the concentration range did not impact the calculation of the inhibition parameters. However, lower and upper flat areas of the kinetic curves become critical for low clearance instances, in which it is difficult to distinguish the sigmoidal pattern. As a result, the estimation of CYP1A1 (for S-PZQ) and 3A7 (for R,S-PZQ) interaction parameters resulted in an unreliable fit with both linear static and nonlinear dynamic models. When looking at Ki values, the competitive model fitted data better than noncompetitive and linear-mixed models for 2C9, 2C19, 3A4, and 3A5; i.e., the mean probability that a competitive model was correct in comparison with a noncompetitive model by means of AIC was >75% (Ludden et al., 1994). This can also be concluded from the similarity between Km and Ki values. PZQ enantiomer interaction on CYP1A1 presented some noncompetitive character for R-PZQ as inhibitor (mean probability competitive vs. noncompetitive by AIC below 55%), finding a Ki eightfold higher than its Km value (Supplemental Table 9).
Determination of interaction kinetics based on linear static model and nonlinear dynamic model
Interassay mean and S.E.M. are given (N = 2–4), except for CYP3A7, for which only N = 1 was done. Low clearance cases with an associated CV above 80% are described as not converged (n.c.) and labeled in gray and italic.
Summary PK parameters based on simulated and observed plasma concentrations following the oral administration of R-PZQ ODTs and rac-PZQ ODTs
Geometric mean (Geometric CV, %) values are reported. Simulations were performed using the Vmax and Km in rhP450s generated by the substrate depletion method to describe metabolism. In vitro-in vivo extrapolation (IVIVE) scaling was performed using the reference compound scaling approach.
With this apparent mixed inhibition character, a linear mixed inhibition model was attempted for CYP1A1. The same Km, Vmax, and Ki values as for the competitive model were found with large alpha values (α > 30) associated, which could indicate mostly a competitive interaction (see eqs. 8 and 9). The linear mixed model also gave similar kinetics estimates to the competitive model (< twofold difference) for other P450s and with large α values as well. However, high variability (CVintra > 80%) was associated with α values (data not shown), which makes the linear mixed model overall inconclusive.
Second, nonlinear dynamic models (competitive and noncompetitive) were fitted to the same experimental data (Supplemental Table 9; Table 1). By comparing the nonlinear dynamic inhibition data set with the kinetic values with single PZQ enantiomers, similar discrepancies were found as with the linear static model; i.e., >twofold-higher Km and Vmax values were found for S-PZQ metabolized by CYP2C19 and for R,S-PZQ metabolized by CYP3A5. In addition, Km and Vmax estimates of CYP1A1 for S-PZQ were >twofold lower than the Km and Vmax values of single PZQ enantiomers (i.e., 100% e.r.), approaching values found for each enantiomer in a racemate (i.e., 50% e.r). (Supplemental Table 9). Ki values of PZQ enantiomer interactions on CYP2C9, 2C19, 3A4, and 3A5 mediated metabolism were well-described by a competitive model as well. For CYP1A1, although a noncompetitive model could not satisfactorily be fitted to the experimental data, a noncompetitive character can be suspected, as Ki for R-PZQ was 3.3-fold higher than Km by using this nonlinear approach.
Overall, linear static and nonlinear dynamic modeling yield similar results, but the nonlinear dynamic model provided tighter interassay variability (i.e., S.D. on Km, Vmax, and Ki values were at least 1.5-fold lower in 67% of the cases). This gives an indication that integrating metabolism of both compounds involved in the interaction might help to improve estimates. Ki ratios between PZQ enantiomers were calculated for both static and dynamic approaches, finding similar results as well. From this analysis, it was notable that S-PZQ had a lower Ki value compared with R-PZQ for CYP2C19 (2.3-fold lower for static model and 3.9-fold lower for dynamic model), pointing out that in this case, S-PZQ might act as perpetrator of R-PZQ metabolism.
Discussion
To investigate the PZQ enantioselective pharmacokinetic behavior previously hypothesized (Bagchus et al., 2019), selected aspects of its in vitro metabolism were explored. First, metabolite identification in in vitro systems of increasing biologic complexity was addressed, i.e., rhP450s, HLM, and hHeps. Beyond confirming previous metabolite profiling of PZQ (Huang et al., 2010; Wang et al., 2014), the structure of M6, a major product in rhCYP3A4 and HLM, was finally elucidated, pointing unequivocally to the carbon-11b in the “core moiety” of PZQ as the hydroxylation site (Fig. 1). M6 might correspond to a metabolite postulated in previous studies (Nleya et al., 2019). We have demonstrated that M6 is present at low abundance in hHeps and is being cleared in this in vitro system. However, the drug metabolizing enzyme inhibitor potential of M6 remains to be explored to evaluate whether it may have an impact on overall PZQ pharmacokinetics. Other known mono-oxidation metabolites found in rhP450 incubations correlated quite well with their relative abundance in HLM considering P450 expression, and thus no major contributions from other P450s were expected. However, a clear switch in the metabolite profile occurred when going from HLM to hHeps, in which trans-4'-OH-PZQ became the major metabolite (Fig. 2). In this sense, we have identified that R-cis-4'-OH-PZQ and, to a minor extent, S-cis-4'-OH-PZQ are interconverted to the corresponding trans isomers in hHeps (Fig. 3). We speculate that this reaction might be driven enzymatically via a non-P450 system given that this interconversion only occurs in hHeps. Further studies are warranted to identify its underlying mechanism and reaction kinetics, which will allow us to determine if this cis to trans interconversion is a major cause of the major abundance of trans-4'-OH-PZQ in clinical studies. Overall, caution should be applied when evaluating PZQ pharmacokinetics based on the measurement of trans-4'-OH-PZQ metabolite, as its formation is not only driven by multiple pathways with polymorphic P450s but also through a non-P450 interconversion from cis-4'-OH-PZQ.
In a second step, turnover in selected rhP450s for R-PZQ, S-PZQ, and rac-PZQ was determined (Fig. 4). Comparison of CLint values between individually tested PZQ enantiomers (100% e.r.) pointed out that R-PZQ is a preferred substrate over S-PZQ for CYP1A1, 1A2, 2C9, and 2D6, whereas S-PZQ is preferred over R-PZQ for CYP3A7 (Supplemental Table 4). Abundant P450 isoforms 3A4, 3A5, and 2C19 presented similar efficiency in metabolizing both PZQ enantiomers.
Determination of Michaelis Menten parameters (Km and Vmax) resulted in a better characterization of the differences between PZQ enantiomers (Figs. 5 and 6). Given that some rhP450s can generate several PZQ metabolites with different kinetic parameters (Wang et al., 2014), and that some metabolites are interconverted, kinetic evaluation was pursued following substrate depletion. For CYP2C9, 3A4, and 3A5, an apparent concomitant affinity increase (lower Km) and rate decrease (lower Vmax) was observed for both enantiomers when assayed as racemate. For CYP2C19, this effect was only noted for R-PZQ. As both kinetic values changed in the same direction (increase or decrease), the resulting Vmax/Km ratio of single enantiomers (i.e., 100% e.r.) was similar to Vmax/Km ratio of each enantiomer tested in a racemic mixture (i.e., 50% e.r.) and comparable as well to the CLint of PZQ enantiomers tested at 1.0 µM (Supplemental Fig. 6).
Moreover, by comparing our data with available literature data obtained via metabolite formation (Li et al., 2003; Wang et al., 2014), Km values obtained following substrate depletion approach were >twofold lower for CYP1A2, 2C19, and 3A4 while being similar for 2C9. This could indicate an underestimation of the Km values by measuring metabolite formation when multiple pathways for the same P450 are involved (Fig. 1). Moreover, Km and Vmax values obtained for the same enzyme vary considerably within the same study depending on the product measured (Li et al., 2003).
Comparison of kinetic parameters of PZQ enantiomers, whether tested individually or as racemate, were the basis to select which rhP450s might be subject to enantiomer-enantiomer interactions. Generally, for these substrate depletion-based inhibition experiments, our recommendation is to use a broad range of concentrations in the assay (whenever possible) to cover all parts of the substrate depletion sigmoidal shape. Although in our case it was possible to adjust concentration ranges to the analytical limitations without impacting the quality of the final estimates, our expectation is that the uncertainty (S.D.) can be reduced if both plateaus are included. For subsequent data analysis, two approaches were assessed to calculate Km, Vmax, and Ki values all at once, namely, a linear static and nonlinear dynamic modeling. For both tested modeling approaches, it was concluded that the data from incubations of PZQ enantiomer mixtures with CYP2C9, 2C19, 3A4, and 3A5 were best fitted using models of competitive inhibition between the enantiomers. Comparison of Ki values between PZQ enantiomers generally resulted in differences below twofold, except for CYP2C19, for which Ki was lower for S-PZQ (Supplemental Tables 8 and 9), potentially indicating that S-PZQ is prevalently playing an inhibitor role. S-PZQ seems to also act as perpetrator of CYP1A1-mediated metabolism of R-PZQ; however, further experiments are required to confirm the inhibition mechanism.
Numerical differences were expected between the two modeling approaches because linear static modeling obviates the metabolism of the item defined as inhibitor in the evaluation, and in the PZQ case study, this was not negligible. However, both methods lead to similar numerical values. Even when including substrate depletion of both enantiomers, nonlinear dynamic modeling only resulted in slightly tighter interassay deviations. Thus, the static modeling approach seems to suffice to get a rough estimate of the Ki values for PZQ. However, more case studies are needed to confirm that linear static modeling is sufficient to provide good estimates for concomitant drugs being metabolized to a relevant degree.
Attempts of fitting a linear static mixed model resulted in similar kinetic values as for competitive models but with high variability on α estimates.
To explore the possibility that the kinetic parameters determined above might explain the different PK behavior between R- and S-PZQ, the generation of PBPK models for each enantiomer, including in vitro to in vivo extrapolation of the metabolism data reported in this study, was investigated. Several approaches were applied for the in vitro to in vivo extrapolation of the metabolism data obtained using hHeps and rhP450s, including the standard inter-systems extrapolation factor (ISEF) approach (Proctor et al., 2004) and an approach involving calibration with reference compounds. The simulated oral clearance for R-PZQ was significantly underpredicted in all cases, in both racemic and R-PZQ ODT formulations (data not shown). The inability to recover in vivo clearance from in vitro data, the erratic shapes of the PK profiles (Bonate et al., 2018), multiple peaks, the large PK variability, and the unexplained dose nonlinearity of the observed PK (Bagchus et al., 2019) made PBPK model building and parameterization challenging. In light of these complexities, combined with the absence of published data concerning the absolute bioavailability and mass balance of PZQ enantiomers, it would be difficult to fully verify a PBPK model developed from the available in vitro and clinical data.
In conclusion, competitive inhibition between PZQ enantiomers was determined in vitro based on multiple substrate depletion measurements. An abundant CYP3A4 metabolite found in previous studies was structurally characterized. Moreover, we have shown that, in addition to the multiple metabolic pathways, interconversion between metabolites in hHeps occurs, which could partially explain the human metabolic profile.
Acknowledgments
The authors gratefully acknowledge Ralf-Erwin Licht and Axel-Walter Thomasberger for their excellent experimental contribution on metabolite profiling and purification, respectively, and Dr. Vilmos Posevitz for editorial help. We are also very grateful to Dr. Ulrike Gradhand, Dr. Katrin Georgi, Dr. Wilhelmina Bagchus, Dr. Peter Ballard, and Dr. Sheila Annie-Peters for useful discussions and support of the work described here.
Authorship Contributions
Participated in research design: Vendrell-Navarro, Scheible, Abla, Perrin.
Conducted experiments: Vendrell-Navarro.
Performed data analysis: Vendrell-Navarro, Scheible, Lignet, Burt, Marx.
Wrote or contributed to the writing of the manuscript: Vendrell-Navarro, Scheible, Lignet, Burt, Luepfert, Marx, Abla, Swart, Perrin.
Footnotes
- Received November 6, 2019.
- Accepted March 9, 2020.
↵1 Current affiliation: Nuvisan GmbH, Grafing, Germany.
↵
 This article has supplemental material available at dmd.aspetjournals.org.

Abbreviations
- ACN
- acetonitrile
- AIC
- Akaike Information Criterion
- BEH
- ethylene bridged hybrid
- CLint
- intrinsic clearance
- CV
- coefficient of variation
- e.r.
- enantiomeric ratio
- hHep
- human hepatocyte
- HLM
- human liver microsome
- HPLC
- high-performance liquid chromatography
- Kdep
- first-order depletion constant
- Ki
- inhibition constant
- Km
- Michaelis constant
- LC
- liquid chromatography
- MS/MS
- tandem mass spectrometry
- ODT
- orally disintegrating tablet
- P450
- cytochrome P450
- PBPK
- physiologically based pharmacokinetic (modeling)
- PK
- pharmacokinetics
- PZQ
- praziquantel
- qTOF
- quadrupole time-of-flight mass spectrometry
- rac-PZQ
- racemic praziquantel
- rhP450
- recombinant human CYP450
- Vmax
- maximum velocity of the metabolic reaction
- Copyright © 2020 by The American Society for Pharmacology and Experimental Therapeutics


