


Abstract
Morinidazole [R,S-1-(2-methyl-5-nitro-1H-imidazol-1-yl)-3-morpholinopropan-2-ol] is a new 5-nitroimidazole class antimicrobial agent. The present study aimed to determine the metabolism and pharmacokinetics of morinidazole in humans and to identify the enzymes responsible for the formation of the major metabolites. Plasma and urine samples were collected before and after an intravenous drip infusion of 500 mg of racemic morinidazole. Ultraperformance liquid chromatography/quadrupole time-of-flight mass spectrometry revealed 10 metabolites. Morinidazole glucuronidation, followed by renal excretion, was the major elimination pathway, accounting for 35% of the dose. The metabolic pathway displayed regioselectivities and stereoselectivities. Unexpectedly, the nitrogen atom of the morpholine ring, rather than the aliphatic hydroxyl group at the side chain, was glucuronidated to form S-morinidazole glucuronide (M8-1) and R-enantiomer glucuronide (M8-2). The plasma exposure of M8-2 was 6-fold higher than that of M8-1, accounting for 22.9 and 3.96% of the parent drug exposure, respectively. Investigation of morinidazole glucuronidation using human liver microsomes (HLMs) and 12 recombinant UDP glucuronosyltransferases (UGTs) indicated that this biotransformation was mainly catalyzed by UGT1A9. A kinetic study showed that N+-glucuronidation of racemic morinidazole in both HLMs and in UGT1A9 obeyed a typical Michaelis-Menten plot. The Km values for M8-1 and M8-2 formation by HLMs were similar (11.3 and 15.1 mM), but the Vmax values were significantly different (111 and 1660 pmol · min−1 · mg protein−1). Overall, after an intravenous administration, morinidazole and its metabolites were eliminated in humans primarily via renal excretion. The major metabolites were two diastereoisomeric N+-glucuronides, and UGT1A9 played an important role in N+-glucuronidation.
Introduction
Morinidazole [R,S-1-(2-methyl-5-nitro-1H-imidazol-1-yl)-3-morpholinopropan-2-ol], a third-generation 5-nitroimidazole antimicrobial, is currently in clinical development as a racemic mixture for the treatment of amoebiasis, trichomoniasis, and anaerobic bacterial infections (Lv, 2008). The bactericidal activity of morinidazole, which is similar to that of metronidazole (the prototype nitroimidazole antimicrobial), depends on the formation of a redox intermediate metabolite in the bacterium that causes DNA strand breakage, inhibits repair, and, ultimately leads to cell death (Müller, 1983; Kedderis et al., 1989; Lamp et al., 1999). A previous study showed that morinidazole exhibited greater activity against trichomoniasis and amoebiasis but had less toxicity than metronidazole in mice (Lv, 2008). However, the difference of pharmacological activity of R- and S-morinidazole is not reported.
During the course of clinical development, metabolism investigations play a crucial role in promoting the safe use of a drug, including predicating the potential drug-drug interaction as well as dosing adjustments. However, the metabolism of morinidazole has not been reported previously. In our preliminary clinical pharmacokinetic study, two morinidazole glucuronides were detected as the main metabolites in human urine and plasma after an intravenous drip infusion. Morinidazole contains an aliphatic hydroxyl, an imidazole ring, and a morpholine ring, all of which are potential sites for conjugation with glucuronic acid. Enzymatic hydrolysis experiments demonstrated that both glucuronides were resistant to hydrolysis by β-glucuronidase from Helix pomatia (in pH 5 and pH 7.4 buffers) but were susceptible to hydrolysis by β-glucuronidase from Escherichia coli at pH 7.4, indicating that the glucuronides may be N+-glucuronides and not O-glucuronides (Kowalczyk et al., 2000). Selective glucuronidation at an aliphatic tertiary amine group in the presence of a hydroxyl group would be an unusual metabolic pathway.
The objectives of the current study are 1) to investigate the metabolism of morinidazole in humans after an intravenous drip infusion administration by ultraperformance liquid chromatography/quadrupole time-of-flight mass spectrometry (UPLC/Q-TOF MS), 2) to characterize pharmacokinetics and excretion profiles of morinidazole and its major metabolites in humans, and 3) to identify the UGT(s) responsible for morinidazole glucuronidation using HLMs and UGTs. This study also attempts to address the stereoselectivity in the sulfation of morinidazole by using cryopreserved human hepatocytes.
Materials and Methods
Chemicals.
Reference standards of morinidazole (99.8% purity), R-morinidazole (99.1% purity), S-morinidazole (98.9% purity), and morinidazole N-oxide (M4-1, 99.9% purity) were synthesized at Jiangsu Hansoh Pharmaceutical Co., Ltd. (Lianyungang, China). Morinidazole and sodium chloride injection (500 mg/100 ml, lot number 20100902) was supplied by Jiangsu Hansoh Pharmaceutical Co., Ltd. Metronidazole (internal standard, 100% purity) was purchased from the National Institute for Food and Drug Control (Beijing, China). Recombinant human UGT enzymes (UGT1A1, UGT1A3, UGT1A4, UGT1A6, UGT1A7, UGT1A8, UGT1A9, UGT1A10, UGT2B4, UGT2B7, UGT2B15, and UGT2B17) and pooled HLMs were obtained from BD Gentest (Woburn, MA). Cryopreserved human hepatocytes were purchased from the Research Institute for Liver Diseases Co., Ltd. (Shanghai, China). Niflumic acid, alamethicin, uridine 5′-diphosphoglucuronic acid (UDPGA), and β-glucuronidase (from E. coli, Type IX-A; from H. pomatia, Type H-2, 100,000 U/ml at pH 5.0) were purchased from Sigma-Aldrich (St. Louis, MO). All solvents used for UPLC/Q-TOF MS were of HPLC grade (Merck, Darmstadt, Germany). All solvents used for gel chromatography were of analytical grade (Shanghai Chemical Plant, Shanghai, China). Purified water was generated using a Milli-Q Gradient Water Purification System (Molsheim, France). Sephadex LH-20 gel (GE Healthcare, Chalfont St. Giles, Buckinghamshire, UK) was used for column chromatography.
Study Design, Dosing, and Sample Collection.
This was an open-label, nonrandomized, single-dose study. Twelve healthy Chinese subjects (six females/six males) with a mean age of 24 years (range, 21–26) and a mean body mass index of 21 kg/m2 (range, 19–23) participated in the study. The study was approved by the Ethics Committee of Tongji Hospital (Wuhan, China), conducted in accordance with the Declaration of Helsinki and the principles of Good Clinical Practice. Written informed consent was obtained from all subjects before enrollment. All subjects were given 500 mg of morinidazole by continuous intravenous infusion for a 40-min duration. The blood samples were collected and placed in heparinized tubes before dose; at 0.167, 0.333, and 0.667 h after the start of the infusion; and at 0.25, 0.50, 0.75, 1.0, 1.5, 2.0, 3.0, 4.0, 6.0, 8.0, 12, 24, and 36 h after the end of the infusion. Plasma samples were separated and stored at −20°C until analysis. Urine samples were collected at predose (−2 to 0 h), 0 to 4, 4 to 8, 8 to 12, 12 to 24, and 24 to 36 h intervals after the start of the infusion. Urine samples were stored at −20°C until analysis.
Metabolite Profiling and Identification.
Sample Preparation.
Representative pooled plasma and urine samples were prepared for metabolite profiling and identification experiments. Plasma samples were segregated by sampling time (0.5, 1, 2, and 8 h), and equal volumes (100 μl) from all subjects were combined. Urine samples (0–24 h) were pooled across all subjects by combining volumes proportional to the total volume excreted from each subject for each collection interval. Acetonitrile (200 μl) was added to a 100-μl aliquot of pooled plasma or urine sample. The mixture was vortex mixed and centrifuged at 11,000g for 5 min. The supernatant was transferred into a clean plastic tube and evaporated to dryness in a Turbo Vap evaporator (Zymark Corp., Hopkinton, MA) under a nitrogen stream at 40°C. The residue was reconstituted in 100 μl of the mixture of 10 mM ammonium formate and methanol containing 10 mM ammonium formate (10:90, v/v). A 10-μl aliquot of the reconstituted extract was injected into the UPLC-UV/Q-TOF MS system.
For enzymatic incubation, 100 μl of β-glucuronidase (2000 units, at both pH 7.4 and 5) from E. coli and H. pomatia were added to a 100-μl aliquot of the urine sample, respectively. The incubation was performed at 37°C for 24 h. The enzymatic efficiency was evaluated by comparing the LC-UV peak intensities of the glucuronide conjugates and the parent drug before and after the enzymatic incubation.
UPLC-UV/Q-TOF MS Analysis for Metabolite Profiling.
Chromatographic separation was performed on a Capcell PAK MG C18 column (4.6 × 100 mm, 5 μm; Shiseido Co., Ltd., Tokyo, Japan) thermostated at 40°C using a Waters Acquity UPLC system (Waters, Milford, MA) equipped with a binary solvent delivery pump, column oven, UV detector, and autosampler. The mobile phase was a mixture of 10 mM ammonium formate in water (A) and 10 mM ammonium formate in methanol (B). The gradient elution started from 2% B, linearly increased to 32% B in 22 min, linearly increased to 90% B in 3 min, and finally decreased to 2% B to equilibrate the column. The flow rate was 0.6 ml/min, and the elute was monitored by UV detection at 319 nm.
MS detection was conducted using a Synapt Q-TOF MS (Waters) operated in the positive mode via an electrospray ionization interface. Nitrogen and argon were used as desolvation and collision gas, respectively. The capillary and cone voltages were set at 3000 and 40 V, respectively. The desolvation gas was set to 800 l/h at a temperature of 350°C, and the source temperature was 100°C. Data from 80 to 1000 Da were acquired and corrected during acquisition using an external reference (LockSpray) comprising 400 ng/ml leucine encephalin (m/z 556.2771) infused at 5 μl/min. An MSE scan function was programmed with two independent collision energies (CEs). At low collision energy, the transfer and trap CEs were 2 and 3 eV, respectively. At high-collision energy, the transfer was 10 eV, and trap CE ramped from 10 to 20 eV. Data acquired in this manner allowed the collection of intact precursor ion and fragment ion information in a single run.
The actual samples were compared with the blank samples using a MetaboLynx subroutine of the MassLynx software (Waters). Mass defect filtering (MDF) was used to screen the metabolites using a 40-mDa filter between the filter template and the target metabolites (Zhang et al., 2008). Fragmentations were proposed based on plausible deprotonation sites, subsequent isomerization, electron species, and bond saturation using the Mass Frontier 7.0 software (Thermo Fisher Scientific, Waltham, MA). The corresponding precursor and fragmentation data for each detected metabolite were available from the mass spectra at low and high-collision energies, respectively. The elemental composition of each metabolite and its structure were determined using the MetaboLynx software.
Preparation of the Major Metabolites from Human Urine.
Urine samples (0–24 h after dose, approximately 6000 ml) were precipitated with methanol and concentrated to dryness in vacuo at 40°C. To remove potential endogenous small molecules, such as salts, the residue was dissolved in a 3-ml methanol-water solution (90:10, v/v) and subjected to Sephadex LH-20 column chromatography eluted with the methanol-water (90:10, v/v) solvent system. The fractions containing the metabolites were collected and further purified using a Shimadzu LC-6AD semipreparative HPLC apparatus equipped with a SPD-20A UV detector. Chromatographic separation was achieved in a YMC-Pack ODS-AQ column (10 × 250 mm i.d.; YMC, Inc., Wilmington, NC). The detection wavelength was set at 319 nm. Elution was performed using methanol-water-formic acid (10:90:0.2, v/v/v) at a flow rate of 3 ml/min. Peaks eluted at 8.0, 11.0, and 14.5 min were collected to obtain compounds M8-2 (63 mg, 98.5% purity), M8-1 (24 mg, 99.6% purity), and M7 (35 mg, 95.4% purity), respectively.
Quantification of Morinidazole and its Four Metabolites in Human Plasma and Urine.
The concentrations of morinidazole and its major metabolites M4-1, M7, M8-1, and M8-2 in individual human plasma and urine samples were simultaneously determined by a sensitive and rapid LC-MS/MS method, which was validated according to the U.S. Food and Drug Administration guideline and the Crystal City III white paper (Viswanathan et al., 2007), including selectivity, linearity, precision and accuracy, matrix effect, recovery, stability, and incurred sample reanalysis. In brief, after acetonitrile-induced protein precipitation of each plasma or urine sample, the analytes and internal standard (metronidazole) were separated on a Synergi 4 μm Hydro-RP C18 column using a gradient elution program. The HPLC system consisted of two LC-20AD pumps and a SILHTA autosampler (Shimadzu, Kyoto, Japan), which was interfaced to an API 4000 triple quadrupole mass spectrometer (Applied Biosystems, Foster City, CA). Positive electrospray ionization was used as the ionization source. The analytes and the internal standard were monitored by multiple-reaction monitoring with transitions that were specific for each analyte. Calibration curves for morinidazole and its major metabolites were fitted via linear-weighted (1/x2) regression. The standard curve ranges were 10.0 to 12,000 ng/ml for morinidazole, 1.00 to 200 ng/ml for M4-1, 2.50 to 500 ng/ml for M7, 3.00 to 600 ng/ml for M8-1, and 10.0 to 3000 ng/ml for M8-2 in plasma. The standard curve ranges were 400 to 200,000 ng/ml for morinidazole, 40.0 to 20,000 ng/ml for M4-1, 100 to 50,000 ng/ml for M7, 240 to 120,000 ng/ml for M8-1, and 400 to 200,000 ng/ml for M8-2 in urine.
Pharmacokinetic Analysis.
The pharmacokinetic parameters were determined by noncompartmental methods using WinNonlin (version 5.3; Pharsight, Mountain View, CA). The peak concentration (Cmax) and the time to reach it (Tmax) were taken directly from the data. The terminal elimination rate constant (ke) was estimated by log-linear regression of plasma concentrations observed during the terminal phase of elimination. The corresponding elimination half-life (t1/2) was then calculated as 0.693/ke. The area under the plasma concentration-time curve (AUC) was calculated according to the linear trapezoidal method to the last measurable point (AUC0–t) or to infinity (AUC0–∞) by AUC0–t + Ct/ke, where Ct was the last measurable drug concentration. The renal clearance was estimated from amount excreted in urine (0-t)/AUC0-t.
Morinidazole N+-Glucuronidation by Pooled HLMs and Recombinant UGTs.
The optimal conditions for human liver microsomal incubation were determined within the linear range for the formation of the glucuronide conjugates of morinidazole. In the experiments, racemic morinidazole, R-morinidazole, and S-morinidazole were dissolved in dimethyl sulfoxide (DMSO) and serially diluted with Tris-HCl buffer, pH 7.5, to the required concentrations. The final organic solvent concentration did not exceed 0.5% in the incubation mixtures. A typical incubation system (200-μl total volume) contained 50 mM Tris-HCl buffer, pH 7.5, 8 mM MgCl2, 25 μg/ml alamethicin, and 50 μM morinidazole with 1 mg/ml HLMs. After preincubation at 37°C for 5 min, the reactions were initiated by the addition of UDP-glucuronic acid. Reactions were allowed to proceed for 1 h at 37°C and were terminated with an equal volume of ice-cold acetonitrile. Incubations in the presence of morinidazole at 0 min served as the negative controls. Each incubation was performed in duplicate.
To determine the UGT enzyme(s) involved in the N+-glucuronidation of morinidazole, the assay conditions described above were used with 12 commercially available recombinant UGT enzymes, namely UGT1A1, UGT1A3, UGT1A4, UGT1A6, UGT1A7, UGT1A8, UGT1A9, UGT1A10, UGT2B4, UGT2B7, UGT2B15, and UGT2B17, at 0.5 mg of protein/ml in the incubation. The samples were precipitated with acetonitrile and analyzed by UPLC/Q-TOF MS and LC-MS/MS.
Niflumic acid is reportedly an inhibitor of UGT1A9 (Vietri et al., 2002; Miners et al., 2011). In the present study, niflumic acid was dissolved in DMSO, and its concentrations in the reaction mixture were adjusted to 2.50 and 10.0 μM. The morinidazole concentration was set at 50 μM. The other assay conditions were similar to those described above. One group without inhibitor but containing the same volume of solvent, and in which the activity of N+-glucuronidation of morinidazole was normalized to 100%, was used as the control. The N+-glucuronidation of morinidazole in the inhibited samples was compared with those of the control group to determine the remaining enzyme activity.
Kinetic Analysis of N+-Glucuronidation in HLMs and Recombinant UGT 1A9.
The incubations for the kinetic analyses of HLMs and UGT1A9 were performed essentially as described (see Morinidazole N+-Glucuronidation by Pooled HLMs and Recombinant UGTs), typically using nine concentrations (range, 0.250–40.0 mM) of racemic morinidazole. The kinetic parameters for morinidazole N+-glucuronidation were calculated according to the following Michaelis-Menten equation by nonlinear least-squares regression analysis using Prism 5.0 (GraphPad Software Inc., San Diego, CA): v = Vmax × S/(Km + S), where v is the reaction velocity, Vmax is the maximum velocity, Km is the Michaelis constant (substrate concentration at 0.5 Vmax), and S is the substrate concentration.
Investigation of Stereoselectivity in the Sulfation of Morinidazole in Human Hepatocytes.
R- and S-Morinidazole (at 50 and 500 μM) were incubated with human hepatocytes (0.8 million cells per milliliter) in Williams' E medium at 37°C for 2 h. Incubations in the presence of substrates at 0 min served as the negative controls. Reactions were quenched with an equal volume of ice-cold acetonitrile. Each incubation was performed in triplicate. The samples were precipitated with acetonitrile and analyzed by UPLC/Q-TOF MS and LC-MS/MS.
Investigation of the Formation of M1 and M6 In Vitro.
In a total incubation volume of 0.2 ml, morinidazole (50 μM) was mixed with 50 mM Tris-HCl buffer (pH 7.5), 2 mM MgCl2, and 1.0 mg/ml HLMs. The mixture was preincubated for 3 min at 37°C before the addition of 1 mM NADPH. After a 1-h incubation, the reactions were terminated with equal volumes of ice-cold acetonitrile. Incubations with human liver S9 fraction were performed by following a protocol similar to that described above, except that HLMs were substituted by human liver S9 fractions. Control samples containing no NADPH or substrates were included. Each incubation was performed in duplicate.
To investigate the formation of cysteine conjugate M6, morinidazole (50 μM) was incubated with 1.0 mg/ml HLMs, 10 mM l-cysteine, and 1 mM NADPH in 0.2 ml of potassium phosphate buffer (100 mM, pH 7.4). Incubations were initiated by the addition of 1 mM NADPH and incubated at 37°C for 1 h. The reactions were terminated with equal volumes of ice-cold acetonitrile. Control samples containing no NADPH or HLMs were included. Each incubation was performed in duplicate. The samples were precipitated with acetonitrile and analyzed by UPLC/Q-TOF MS.
Results
Metabolite Characterization in Human Plasma and Urine.
To identify morinidazole metabolites, the chromatographic and MS fragmentation behaviors of the parent compound were first investigated. Under the present chromatographic conditions, morinidazole was eluted at 20.6 min and formed a protonated molecule, [M + H]+, at m/z 271.139. The mass spectrum of morinidazole under the high-collision energy scan is shown in Fig. 1A. The fragment ions of m/z 271.139 were observed at m/z 224.139, 144.098, 126.093, and 100.074 (100% abundance). The elemental composition of these fragment ions was elucidated using the measured accurate mass. The major fragment ion at m/z 144.098 was formed through the cleavage of the C-N bond at the N1 position of the imidazole ring. The m/z 126.093 and 100.074 fragment ions were formed by the neutral losses of water and acetaldehyde from m/z 144.098, respectively. A minor fragment ion at m/z 224.139, corresponding to a neutral loss of 47 Da from the protonated morinidazole, was attributed to extrusion of nitrous acid (HNO2). The structure of morinidazole was divided into parts A and B according to this fragmentation pattern. The proposed MS fragmentation pattern of morinidazole is shown in Fig. 1B. The high-energy mass spectral and chromatographic behaviors of the metabolites were compared with those of the parent compound and available standard compounds to determine the sites of modification.
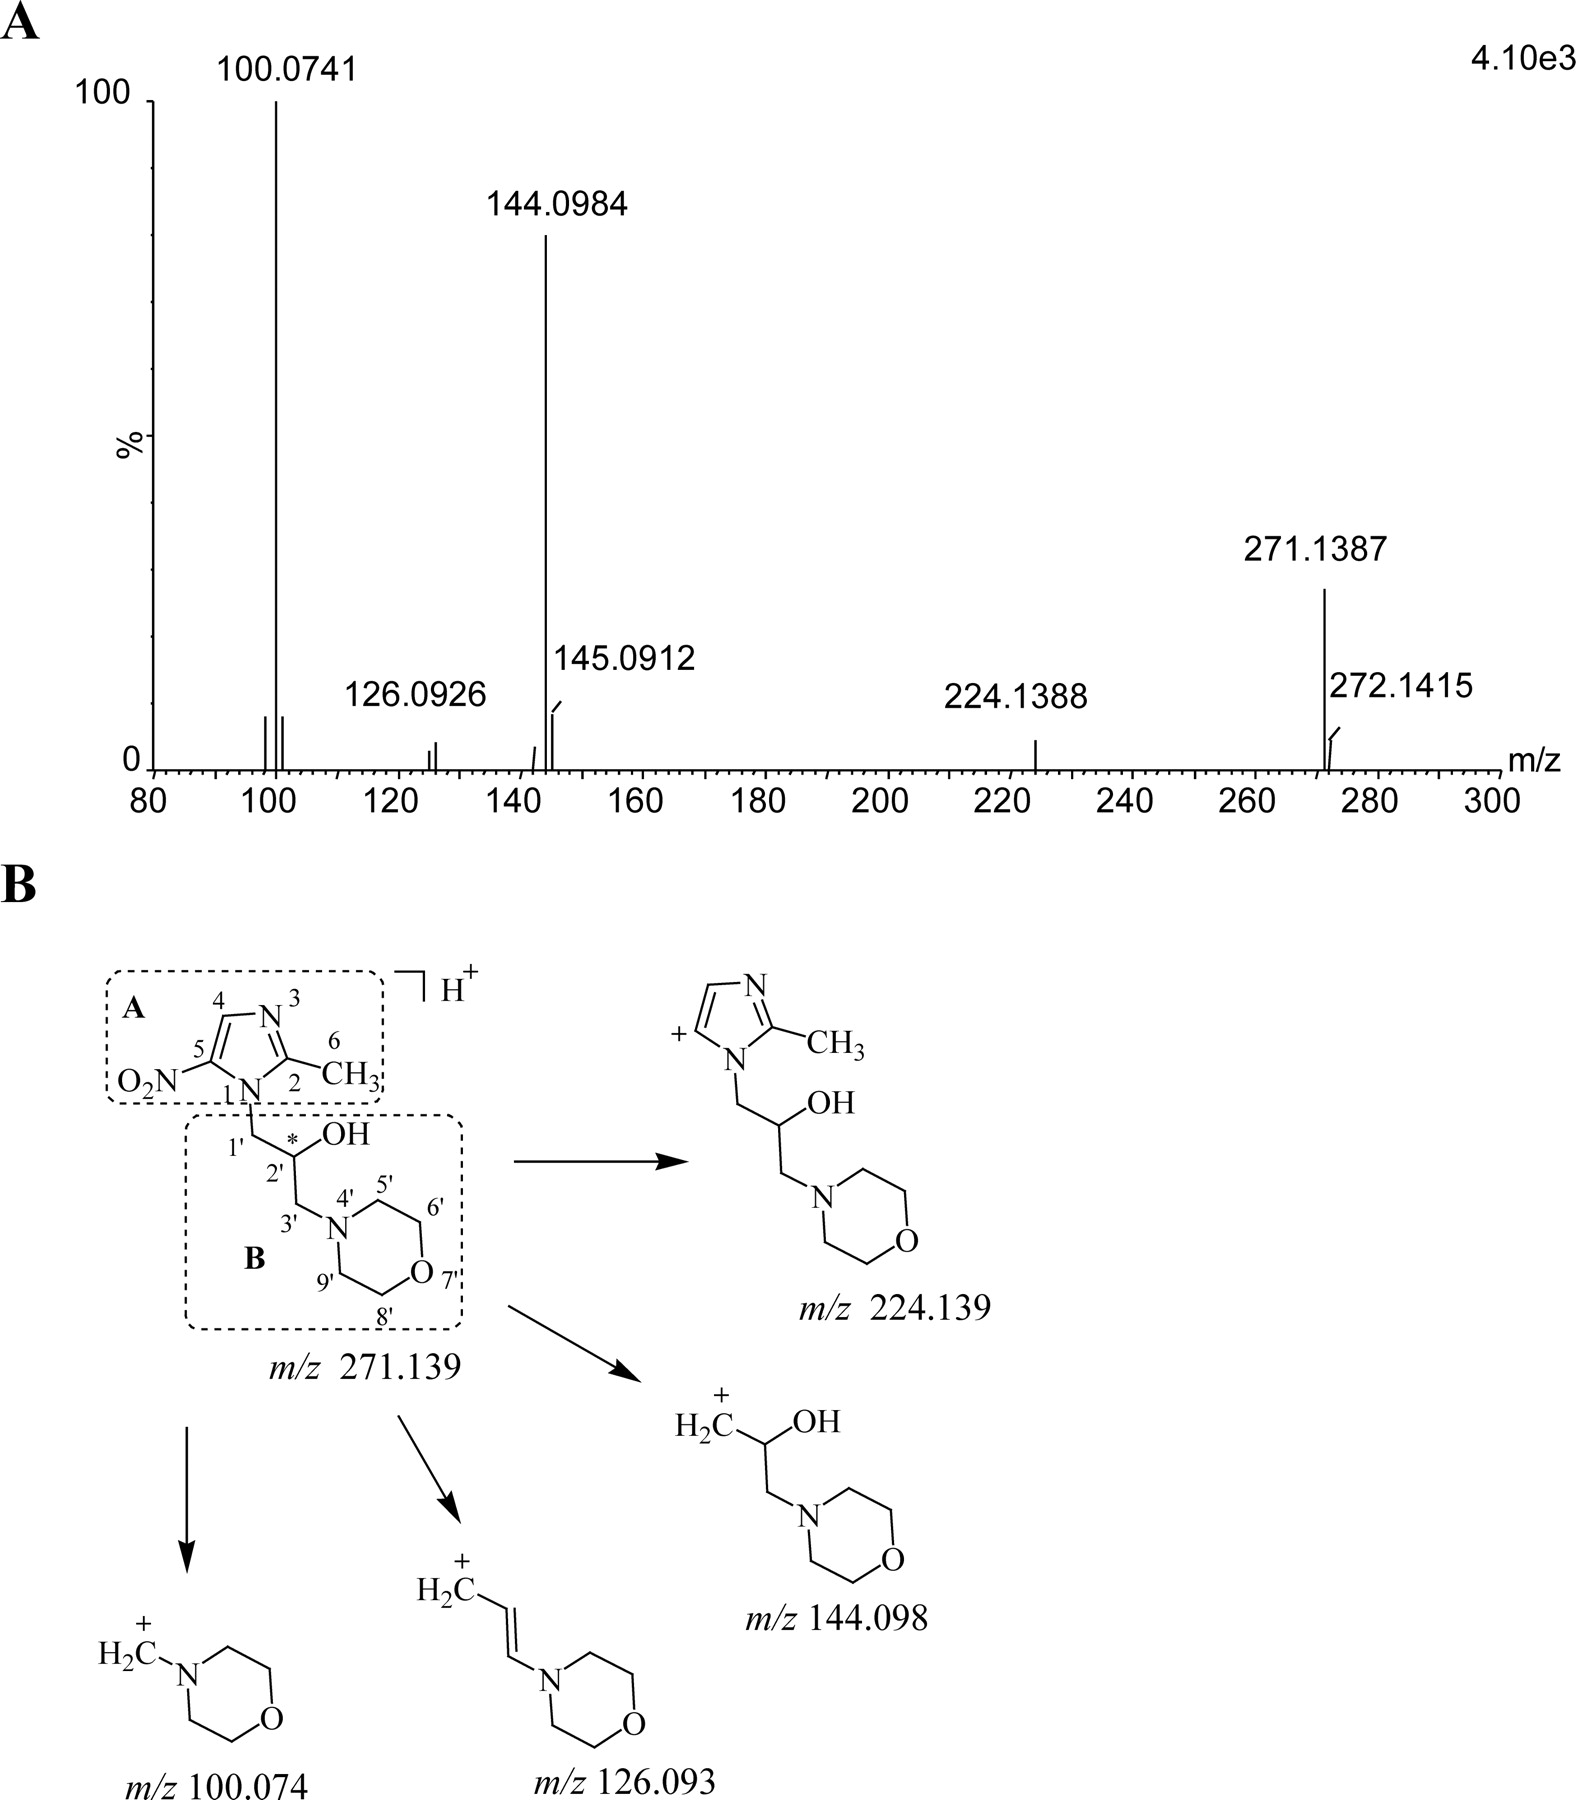
A, mass spectrum of morinidazole at high-collision energy. B, tentative structures of the most informative fragment ions for morinidazole. The structure of morinidazole could be divided into two parts based on the fragmentation pattern: part A (the imidazole ring) and part B (the side chain).
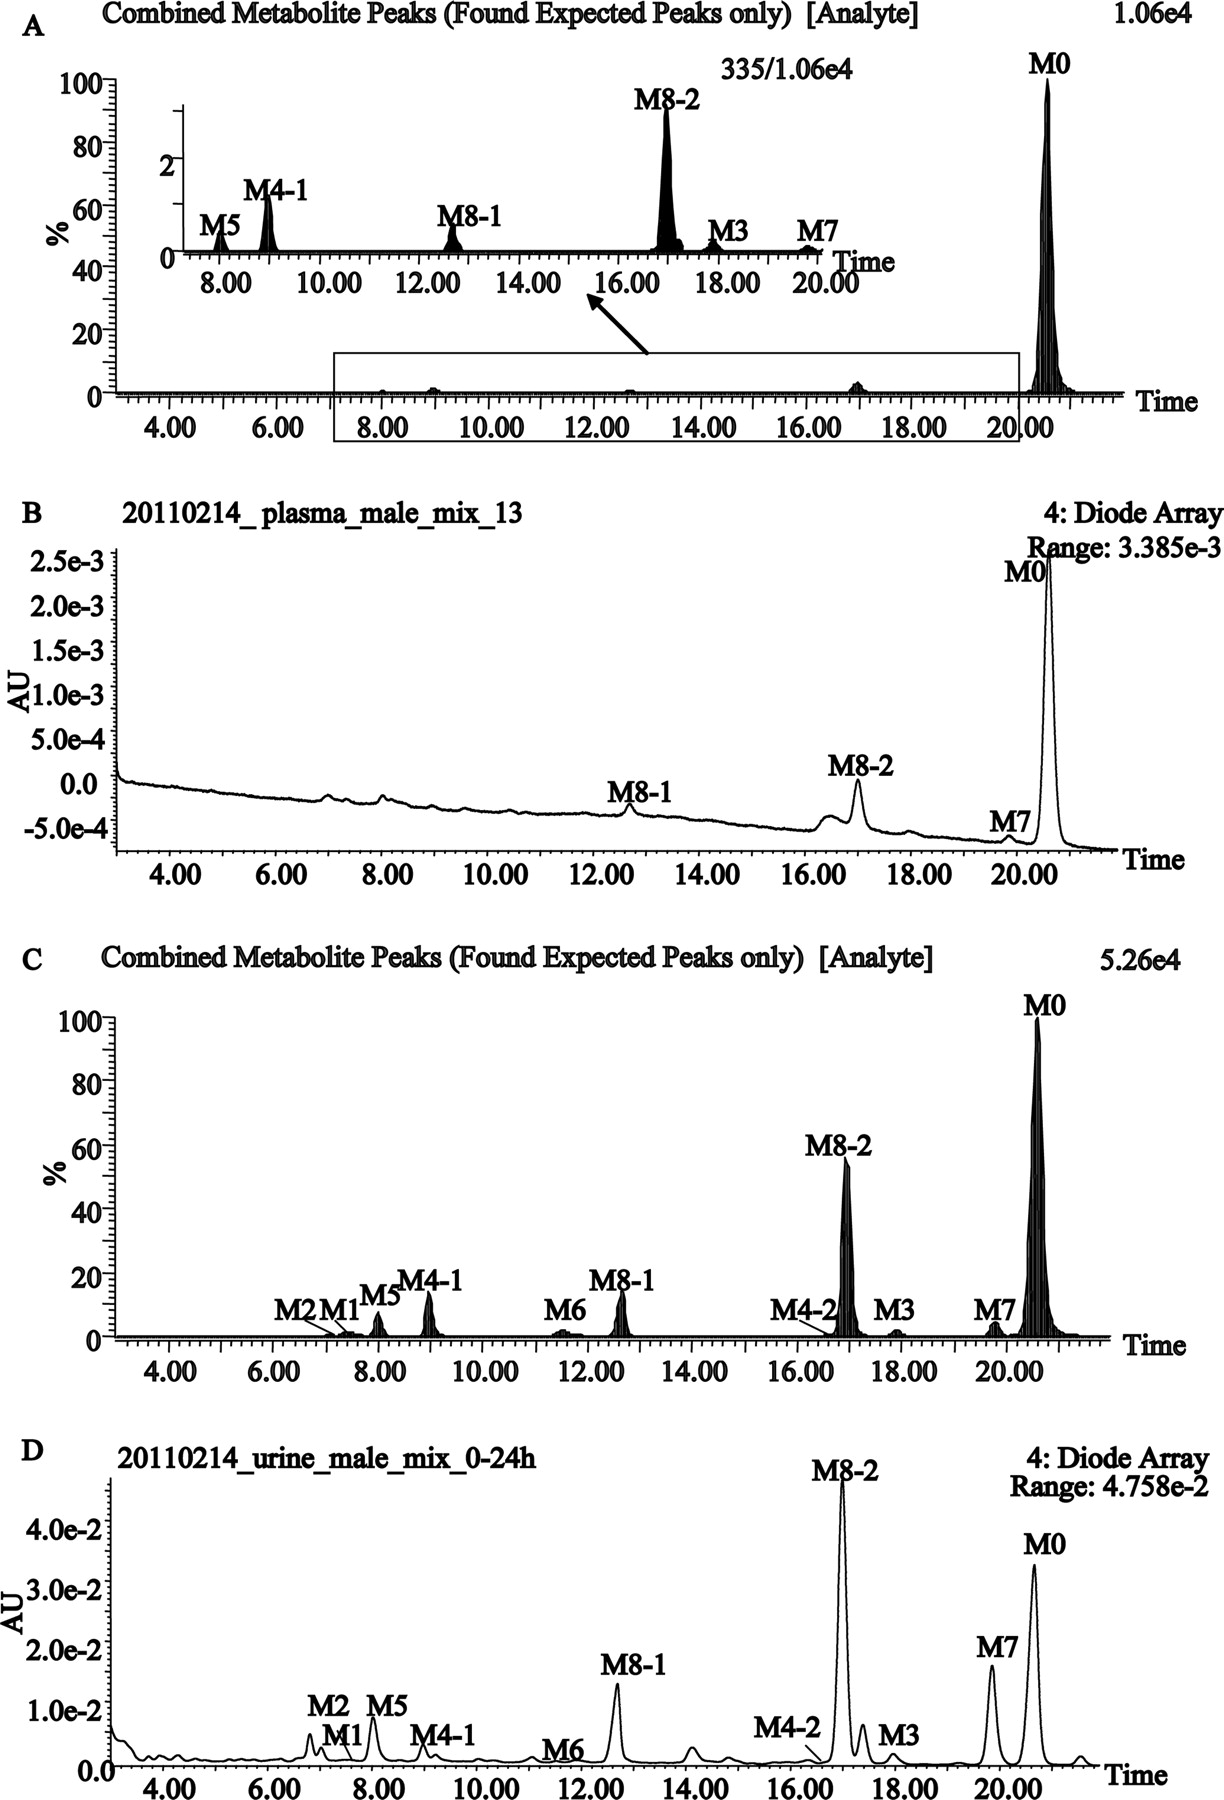
The LC-MS data were processed via the MDF method to remove interferences and facilitate the detection of metabolites in biological matrices. Compared with the blank samples, 10 metabolites of morinidazole were detected in human urine and 6 metabolites were observed in plasma. The expected metabolite chromatograms for the plasma and urine samples are shown in Fig. 2, A and C, respectively, and the corresponding UV chromatograms are shown in Fig. 2, B and D, respectively. The mass spectra of metabolites M1–M8 at high-collision energy are shown in Fig. 3. The proposed metabolic pathways of morinidazole in humans are shown in Fig. 4.

Metabolic profiles of morinidazole after an intravenous infusion administration of 500 mg of morinidazole to healthy subjects. A, MDF metabolic profile of pooled plasma samples collected at 8 h. B, UPLC-UV chromatogram of pooled plasma samples collected at 8 h. C, MDF metabolic profile of 0- to 24-h pooled urine samples. D, UPLC-UV chromatogram of pooled 0- to 24-h urine samples. AU, arbitrary units.


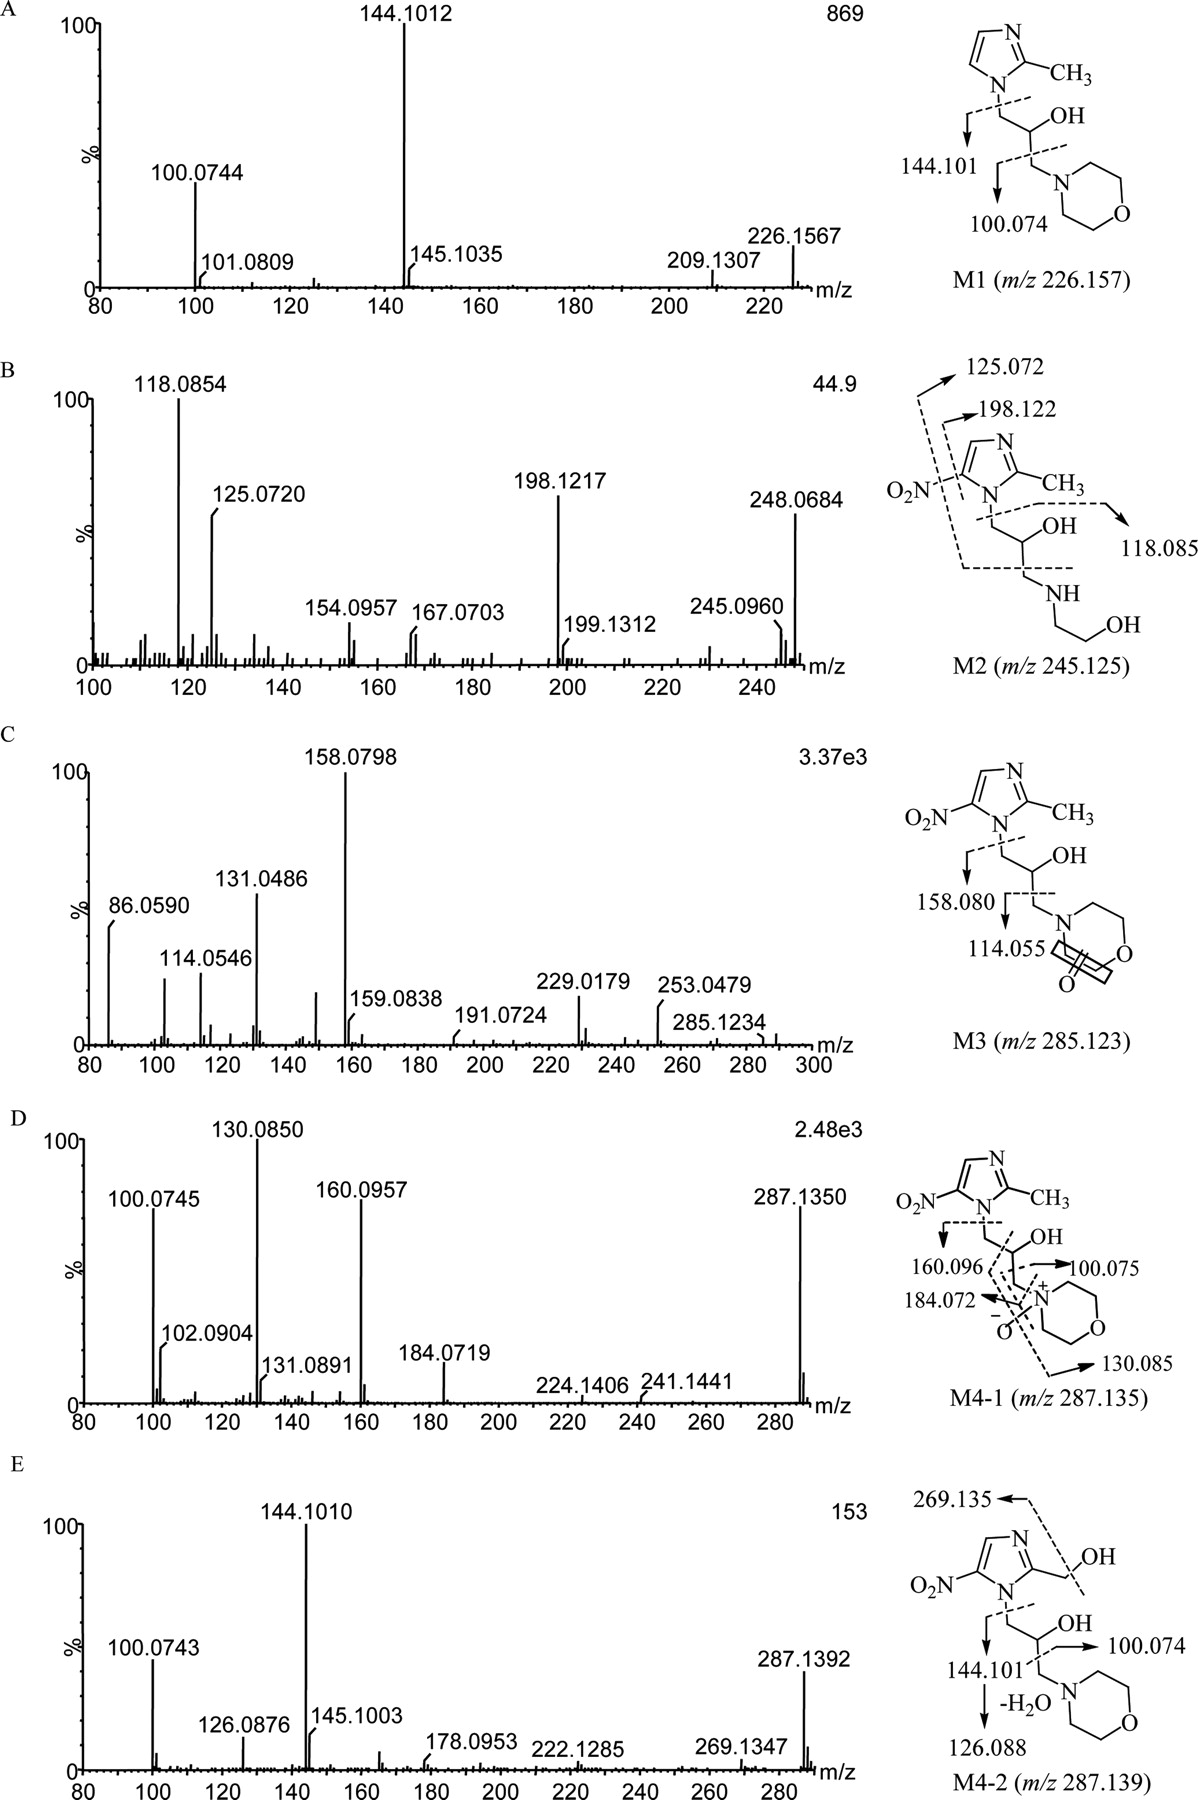
Q-TOF mass spectra of metabolites M1–M8 in 0- to 24-h pooled urine samples at high-collision energy. A, M1; B, M2; C, M3; D, M4-1; E, M4-2; F, M5; G, M6; H, M7; I, M8-1; J, M8-2.
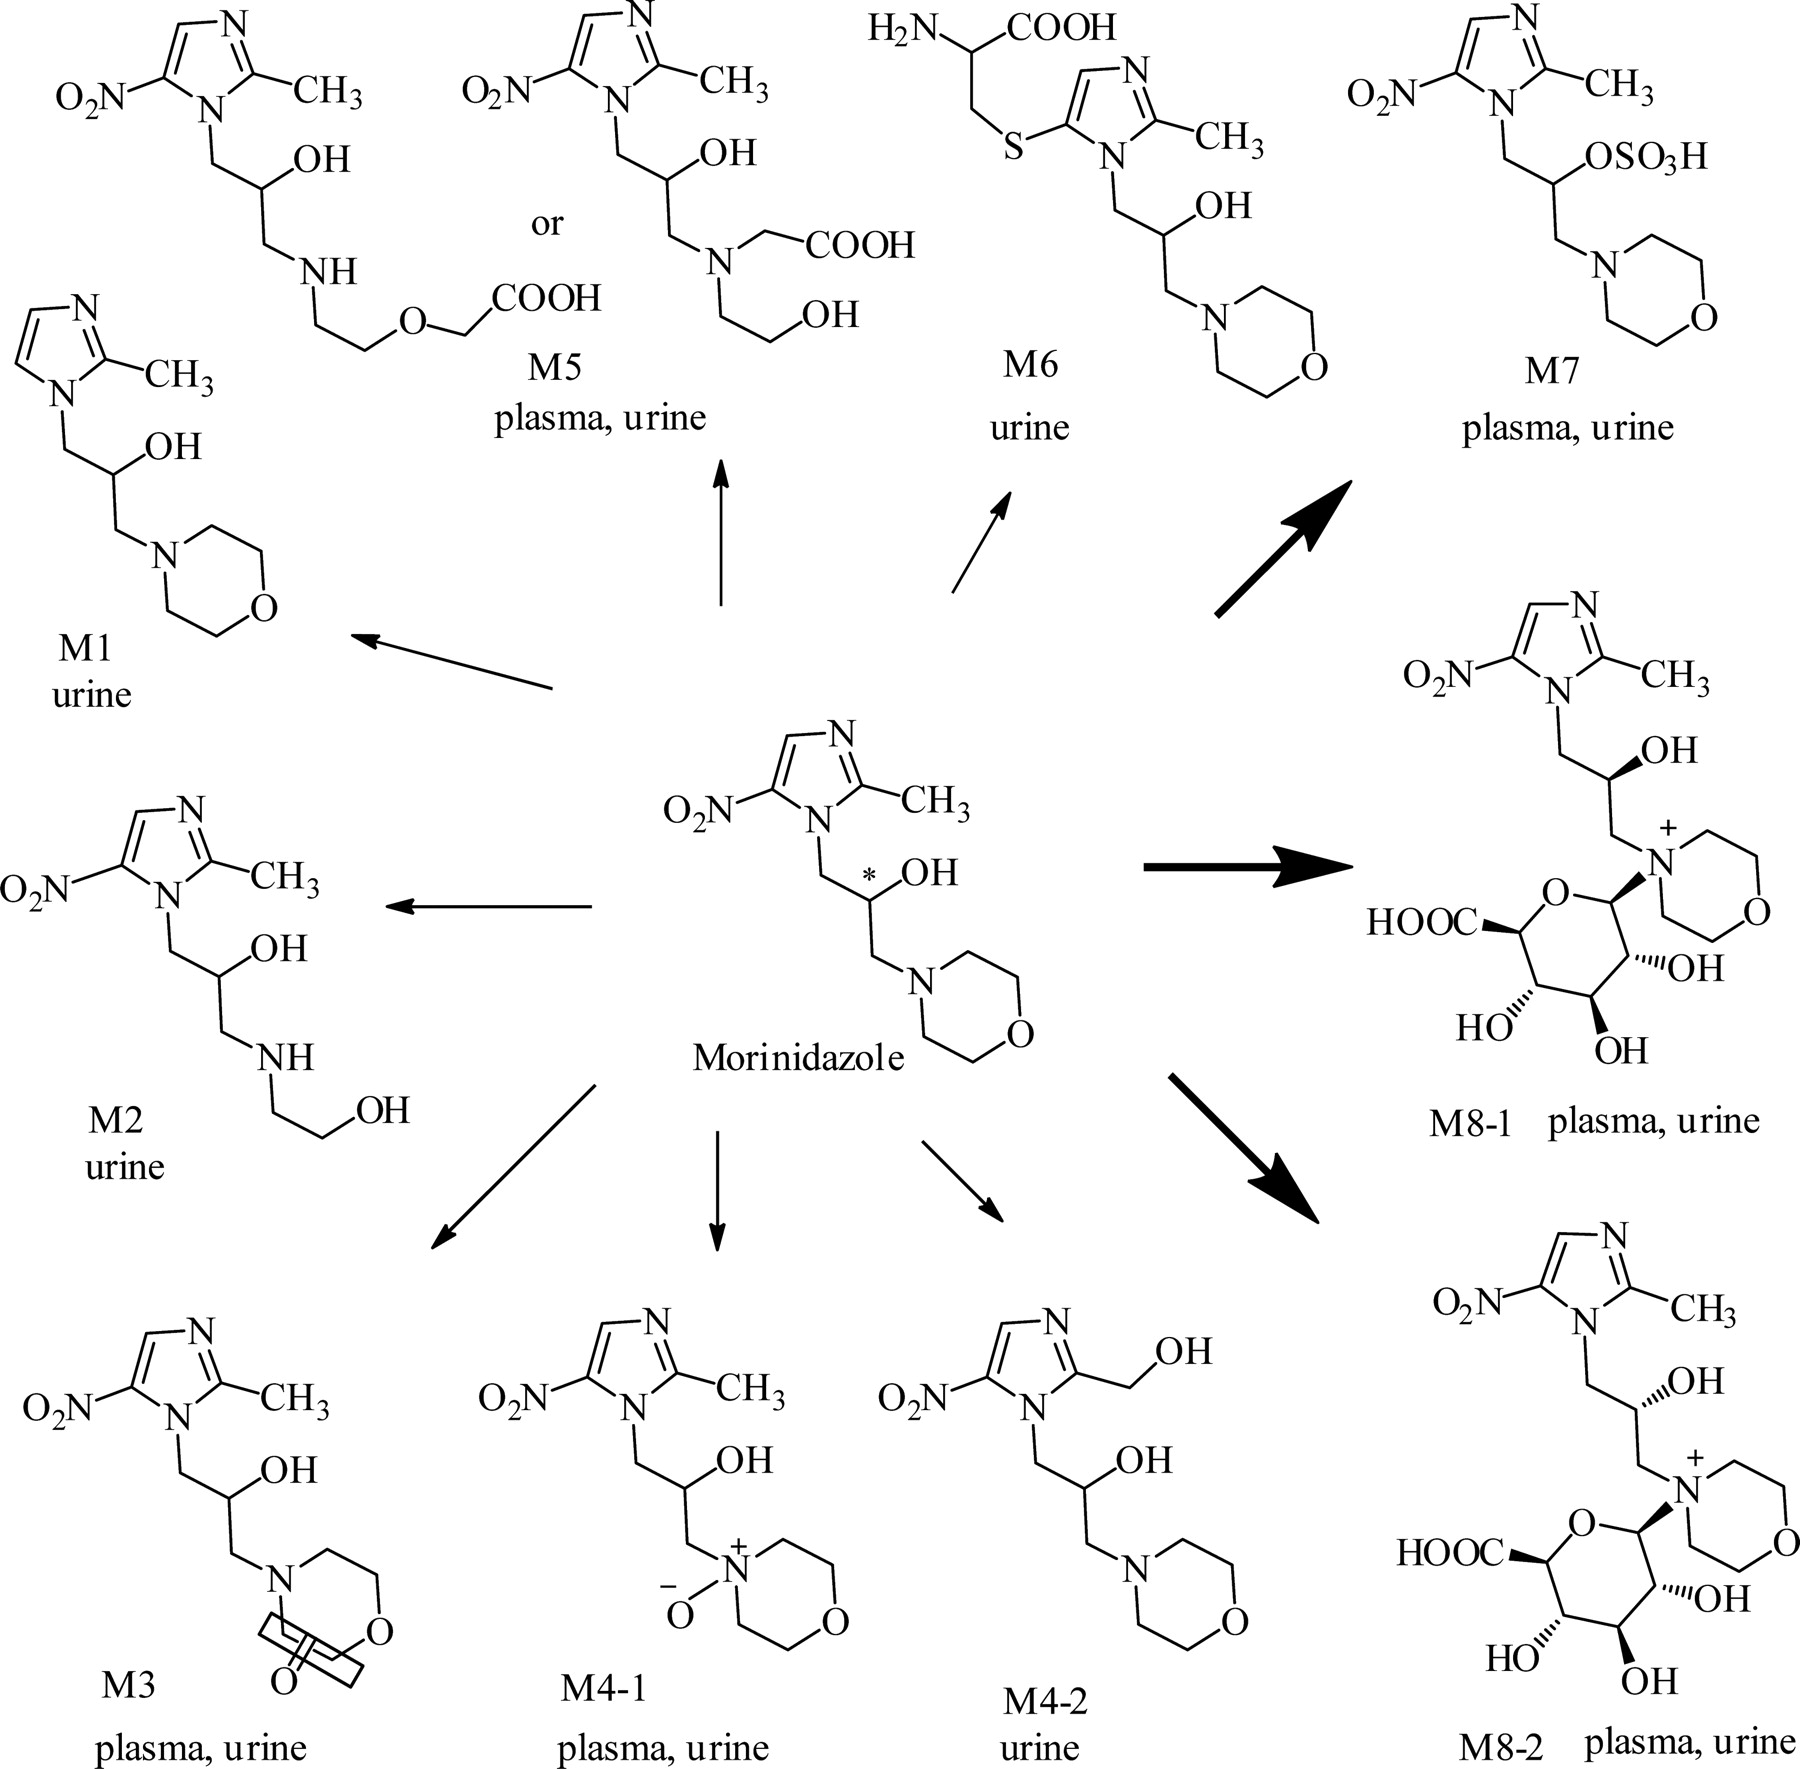
Proposed metabolic pathways of morinidazole in humans.
Parent Drug M0.
A chromatographic peak at 20.6 min was detected in human plasma and urine, with an elemental composition of C11H18N4O4 and a protonated molecular weight of 271.141. The retention time and mass spectral fragmentation patterns were identical to those of the parent drug morinidazole, indicating that this component was unchanged morinidazole. It was designated as M0 and was the most abundant component in human plasma.
Metabolite M1.
Metabolite M1, found in urine, was eluted at 7.4 min. Its protonated molecular weight was 226.157, and its elemental composition was C11H19N3O2, indicating a loss of NO2 from morinidazole. High-collision energy analysis revealed product ions at m/z 144.101 and 100.074, indicating that part B of the parent drug was intact. Therefore, metabolite M1 was identified as the denitrated metabolite of the parent drug.
Metabolite M2.
Metabolite M2, detected in plasma and urine with a retention time of 7.0 min, exhibited a [M + H]+ peak at m/z 245.125 corresponding to C9H16N4O4, which indicated the loss of C2H2 from morinidazole. In the high-collision energy mass spectrum of M2, the major fragment ions were observed at m/z 198.122 and 118.085, revealing a 26-Da decrease compared with the fragment ions at m/z 224.139 and 144.098 of the parent drug, respectively. Therefore, M2 was identified as the morpholine ring-opened morinidazole (Fig. 3).
Metabolite M3.
Metabolite M3, found in both plasma and urine samples, was eluted at 17.9 min with a protonated precursor ion at m/z 285.123. Its elemental composition was C11H16N4O5, indicating the introduction of an oxygen atom with dehydrogenation. The major fragment ions were observed at m/z 158.080 and 114.055, with a 14-Da increase compared with the fragment ions of morinidazole at m/z 144.098 and 100.074, respectively. M3 was tentatively identified as a carbonylation metabolite of M0 at the morpholine ring.
Metabolite M4.
Metabolite M4 had a protonated molecular weight of 287.134, which was 16 Da higher than that of protonated morinidazole. Its elemental composition was C11H18N4O5, indicating that an oxygen atom was introduced into the parent drug. The extracted ion chromatogram of m/z 287.134 showed two chromatographic peaks at 9.0 min (M4-1) and 16.6 min (M4-2) in urine; only M4-1 was observed in plasma.
In the high-collision energy mass spectrum of M4-1, four major fragment ions at m/z 184.072, 160.096, 130.085, and 100.075 were observed. The ion at m/z 160.096 was 16 Da higher than the fragment ion at m/z 144.097 of M0, suggesting that the oxygen was introduced into part B. The ion at m/z 184.072 resulted from the loss of the morpholine ring and the oxygen. By comparing the chromatographic behaviors and mass spectrometric characteristics with those of the synthetic authentic standard (1H and 13C NMR spectra are shown in Supplemental Figs. S1 and S2), M4-1 was confirmed as the N-oxidation product of morinidazole.
M4-2 was eluted at 16.6 min. Its mass spectrum showed three major fragment ions at m/z 144.101, 126.088, and 100.074, which were also present in the parent drug, indicating that part B was intact. The fragment ion at m/z 269.135 was derived from a neutral loss of H2O, indicating the formation of an aliphatic hydroxyl group in part A of the parent drug. The site of hydroxylation was proposed as the methyl group of the imidazole ring.
Metabolite M5.
Metabolite M5, found in plasma and urine, was eluted at 8.0 min and had a protonated molecular weight of 303.127. Its elemental composition was C11H18N4O6, indicating the addition of two oxygen atoms to the parent drug. The major fragment ions at m/z 176.091 and 132.063 were 32 Da higher compared with the fragment ions at m/z 144.098 and 100.074 for morinidazole, respectively, which suggested that the site of biotransformation was located on morpholine N-methylene moiety. In the product ion spectrum of M5, the fragment ion at m/z 100.074 was also observed. Its element composition was C5H10NO+, which is the same as that of the fragment ion at m/z 100.074 from the parent drug. But the structural formulas of the two fragment ions were different, because it was difficult to lose, simultaneously, two oxygen atoms from the structure by LC-MS analysis. As a result, the fragment ion was proposed to be derived from the opening of the morpholine ring (Fig. 3F). According to the high-resolution MS data, the structure of M5 was proposed as carboxylic acid metabolite formed by oxidative opening of the morpholine ring (Fig. 3F). The exact structure of M5 needs to be further characterized.
Metabolite M6.
Metabolite M6, found in urine, had a retention time of 11.5 min, exhibited a protonated molecule at m/z 345.159, and had a derived formula of C14H24N4O4S, indicating a cysteine conjugation (+C3H5NO2S) of M1. The mass spectrum of M6 showed three major fragment ions at m/z 258.131, 144.101, and 100.074. Because the m/z 258.131 ion was 34 Da higher than the fragment ion at m/z 224.139 of the parent drug and the m/z 144.101 and 100.074 ions were the same as those of M0, M6 was suggested as the cysteine S-conjugate of M1 derived from the replacement of the nitro group by cysteine.
Metabolite M7.
Metabolite M7, detected in plasma and urine, was eluted at 19.8 min with a precursor ion at m/z 351.096 and an elemental composition of C11H18N4O7S. M7 had a major fragment ion at m/z 271.141, indicating a neutral loss of the sulfate group. The other major fragment ions at m/z 144.099 and 100.075 were the same as those of the parent drug. M7 was assumed as a sulfate conjugate of morinidazole. M7 was isolated from human urine and characterized as follows: 1H NMR (DMSO-d6, 400 MHz) δ: 7.96 (s, 1H), 4.64 (m, 1H), 4.25 (m, 1H), 3.90 to 4.20 (m, 2H), 3.63 (s, 4H), 3.20 to 3.40 (m, 5H), 2.60 to 2.90 (m, 5H), 2.05 (s, 3H); 13C NMR (DMSO-d6, 100 MHz) δ: 152.44 (s), 138.71 (s), 133.20 (d), 79.21 (d), 69.71 (t), 65.10 (t), 53.42 (t), 49.63 (t), 14.12 (q).
Metabolite M8.
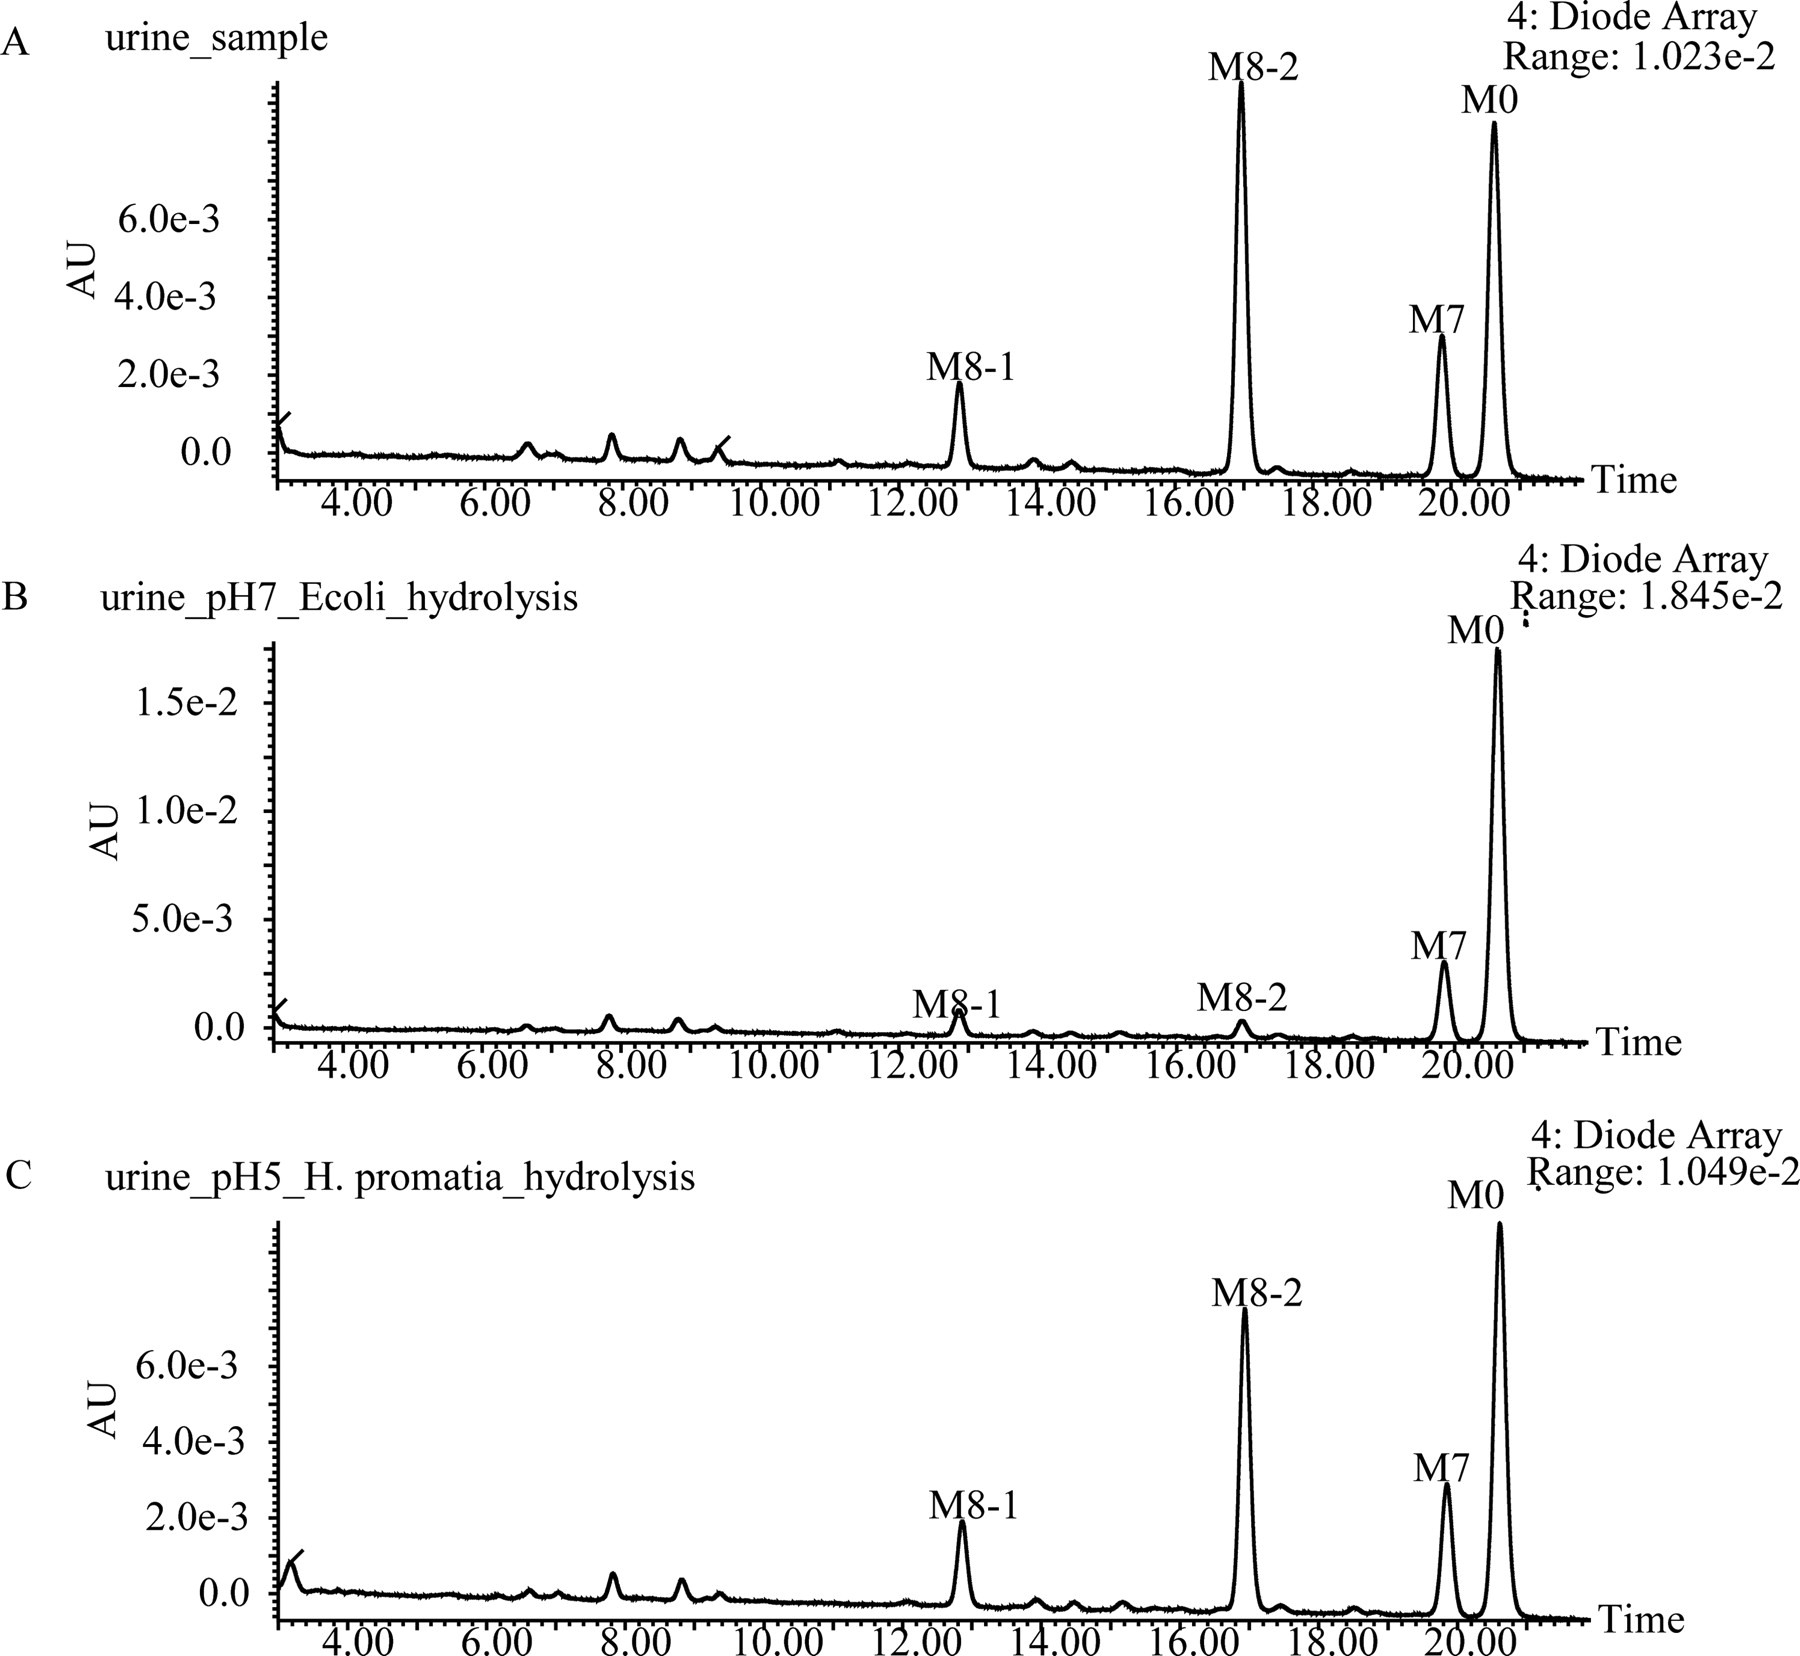
Metabolites M8-1 and M8-2 were eluted at 12.7 and 16.9 min, respectively, and had a precursor ion at m/z 447.171, which was 176 Da higher than that of the parent drug. Their elemental composition was C17H26N4O10. Their mass spectra were identical, and the other fragment ion was at m/z 271.139, indicating that two glucuronide conjugates of the parent drug were produced. The major fragment ions of M8-1 and M8-2 were at m/z 320.131, 271.140, 144.099, and 100.077. The fragment ion at m/z 320.131 was 176 Da larger than m/z 144.098, suggesting that the conjugation site was on part B. Glucuronic acid could be conjugated either on the hydroxyl group or on the nitrogen atom of the morpholine ring. The definitive structure of M8 could not be determined on the basis of MS data. The two glucuronides were resistant to hydrolysis by β-glucuronidase from H. pomatia but were susceptible to hydrolysis by β-glucuronidase from E. coli (Fig. 5). The M8 compounds were assumed as N-glucuronides based on a previous report (Kowalczyk et al., 2000) focusing on the enzymatic hydrolysis of N+-glucuronide metabolites of drugs with an aliphatic tertiary amine.

The UPLC-UV chromatograms of 0- to 24-h pooled urine samples before (A) and after hydrolysis by β-glucuronidase from E. coli (B; pH 7.4) and from H. pomatia (C; pH 5). AU, arbitrary units.
The unequivocal identification of the metabolite is facilitated by the availability of an authentic synthetic sample. The authentic standards of the major metabolites M8-1 and M8-2 were prepared from the postdose human urine samples. NMR spectral data (including 1H and 13C) confirmed the proposed structures and provided the regional information on glucuronidation. Comparison of the 1H NMR data of M8-1 and M8-2 with that of the parent compound revealed that methylene proton signals vicinal to the nitrogen atom of the morpholine ring dramatically shifted downfield for M8-1 and M8-2, whereas the proton signals of the imidazole ring were fixed (Supplemental Figs. S3–S5). These results were in accordance with those reported for N+-glucuronide metabolites (Seaton et al., 1993; Hawes, 1998), suggesting that glucuronic acid was introduced into the nitrogen atom of the morpholine ring to generate two N+-glucuronide metabolites of morinidazole. Considering that the parent drug used in the present study was a racemic mixture, M8-1 and M8-2 were, therefore, proposed as C-2′ epimers; the stereochemistry at C-2′ should be discussed. Therefore, nuclear Overhauser effect spectroscopy (NOESY) experiments were performed for M8-1 and M8-2 in D2O to obtain the relative configuration of M8-1 and M8-2 at the C-2′ position (Supplemental Figs. S6 and S7). The cross peaks between H-2′ (δ 4.47) and Me-6 (δ 2.56) observed in the NOESY spectrum of M8-1, as well as the absence of an NOE correlation between H-2′ (δ 4.49) and Me-6 (δ 2.54) in the NOESY spectrum of M8-2, implied that the H-2′ were oriented on the α and β sides of the molecule, respectively. As a result, M8-1 was assigned as the N+-glucuronide of S-morinidazole and M8-2 was assigned as the N+-glucuronide of R-morinidazole.
The purified metabolite M8-1 was characterized as follows: 1H NMR (CD3OD, 400 MHz) δ: 8.08 (s, 1H), 4.64 (m, 2H), 4.47 (m, 1H), 3.90 to 4.10 (m, 6H), 3.61 (d, J = 9.6 Hz, 1H), 3.50 (m, 2H), 3.20 to 3.40 (m, 6H), 2.56 (s, 3H); 13C NMR (CD3OD, 100 MHz) δ: 166.52 (s), 156.45 (s), 139.83 (s), 134.35 (d), 103.81 (d), 77.05 (d), 74.58 (d), 74.12 (d), 73.19 (d), 64.75 (t), 64.73 (d), 61.12 (t), 15.20 (q) (Supplemental Fig. S8).
The purified M8-2 was characterized as follows: 1H NMR (CD3OD, 400 MHz) δ: 8.04 (s, 1H), 4.64 (m, 3H), 4.49 (d, J = 7.7 Hz, 1H), 3.96 (s, 4H), 3.20 to 3.76 (m, 10H), 2.54 (s, 3H); 13C NMR (CD3OD, 100 MHz) δ: 164.09 (s), 154.51 (s), 139.83 (s), 134.44 (d), 104.38 (d), 77.22 (d), 75.34 (d), 74.69 (d), 73.11 (d), 65.72 (t), 65.67 (d), 60.65 (t), 54.52 (t), 15.17 (q) (Supplemental Fig. S9).
Pharmacokinetics and Renal Elimination of Morinidazole.
After an intravenous drip infusion of 500 mg of morinidazole to 12 healthy subjects, the concentrations of the parent drug and the four metabolites (M4-1, M7, M8-1, and M8-2) in human plasma and urine were quantified by a validated LC-MS/MS method. The mean plasma concentration versus time profiles for morinidazole, M4-1, M7, M8-1, and M8-2 are shown in Fig. 6, and the main pharmacokinetic parameters are presented in Table 1. The AUC0–t values of morinidazole, M4-1, M7, M8-1 and M8-2 were 74,866; 612; 1702; 2965; and 17,164 ng · h · ml−1, respectively. The primary metabolites were glucuronides M8-1 and M8-2, whose plasma exposures were approximately 3.96 and 22.9% of the parent drug exposure, respectively. The t1/2 values of the parent drug and M4-1, M7, and M8-1 were similar (approximately 6–7 h), whereas that of M8-2 was shorter (4.2 h).

Mean plasma concentration-time profiles of morinidazole, M4-1, M8-1, M8-2, and M7 after an intravenous infusion administration of 500 mg of morinidazole to 12 healthy Chinese subjects.
Pharmacokinetic parameters (mean ± S.D.) of morinidazole and four major metabolites in plasma after an intravenous infusion of 500 mg of morinidazole to 12 healthy Chinese subjects
The amount of morinidazole and identified metabolites accounted for 71% of the dose in 0 to 36 h urine. Unchanged morinidazole represented 21.2% of the dose, whereas the most abundant component in urine was the N+-glucuronide metabolite M8-2, accounting for 28.4% of the dose. Other major metabolites included M7, M8-1, and M4-1, accounting for 13.0, 6.6, and 1.3% of the dose, respectively. These results demonstrated that N+-glucuronidation was the predominant metabolic elimination pathway of morinidazole by intravenous administration in humans.
N+-Glucuronidation of Morinidazole in HLMs and Recombinant Human UGTs.
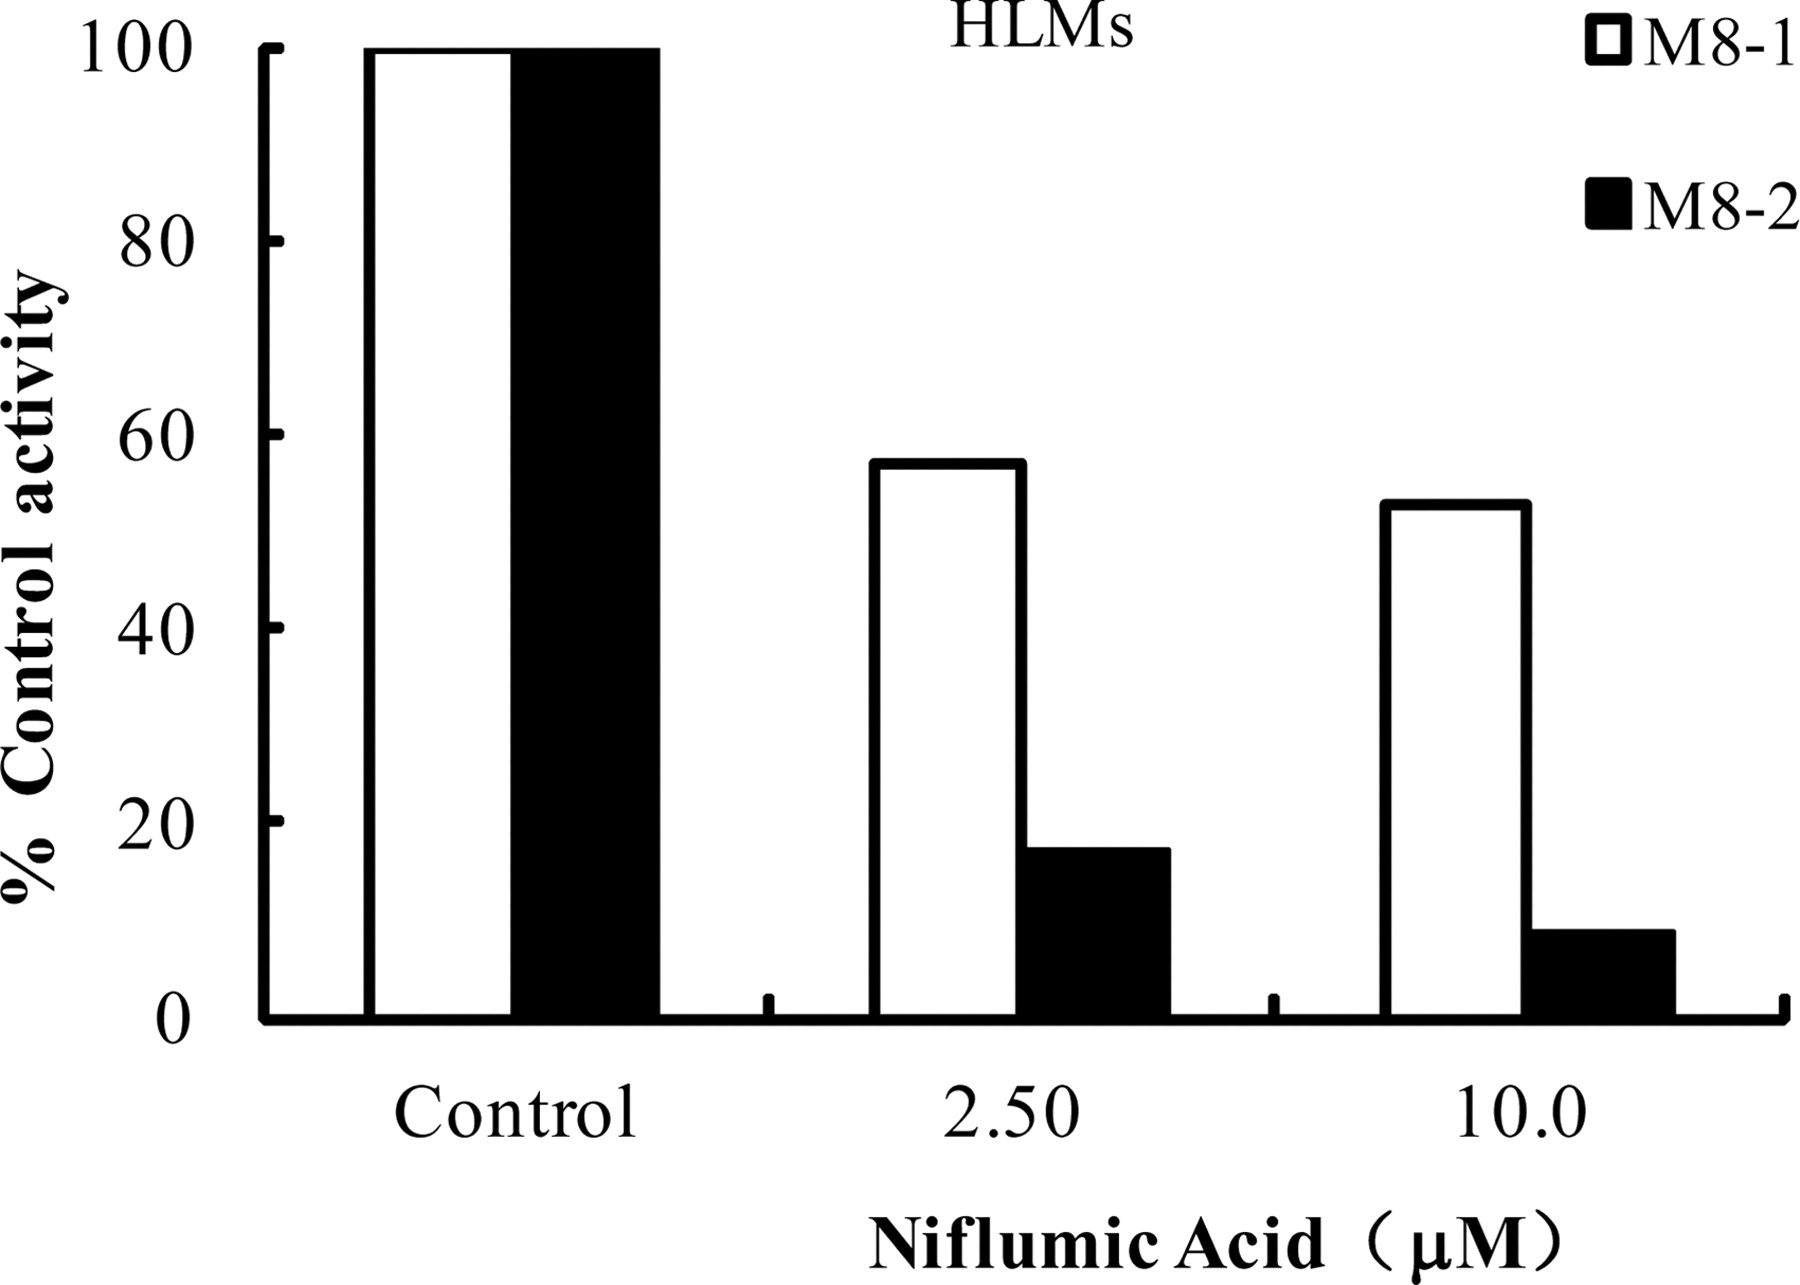
Incubation of racemic morinidazole with HLMs in the presence of UDPGA led to the formation of two glucuronide metabolites of morinidazole, which were identified as M8-1 and M8-2 via comparison with authentic standards. Morinidazole was incubated with 12 individual UGT isoforms to identify the enzyme(s) responsible for morinidazole N+-glucuronidation. The typical bar charts of the screening results are shown in Fig. 7. Inhibition of the glucuronidation reaction of morinidazole in pooled human HLMs by niflumic acid was performed. The N+-glucuronidation inhibition ratios for M8-1 and M8-2 were 43.3 and 83.0% at 2.50 μM and 47.2 and 91.3% at 10.0 μM, respectively (Fig. 8). These results strongly suggested that UGT1A9 was the main enzyme responsible for morinidazole N+-glucuronidation.

N+-Glucuronidation of racemic morinidazole at 50 μM (A) and 500 μM (B) concentrations by 12 human recombinant UGTs. □, M8-1 formation; ■, M8-2 formation. Each column represents the mean of duplicate determinations.

Effects of niflumic acid on the N+-glucuronidation of racemic morinidazole (50 μM) in pooled HLMs. The control activities for formation of M8-1 and M8-2 in the pooled human liver microsomes in the absence of inhibitors were 1.94 and 19.7 pmol · min−1 · mg−1 protein, respectively, and were normalized to 100%. Each column represents the mean of duplicate determinations.
N+-Glucuronidation Kinetics of Morinidazole.
Kinetic analysis of N+-glucuronidation of racemic morinidazole in pooled HLMs and UGT1A9 was conducted. N+-Glucuronidation of S- and R-morinidazole in HLMs and UGT1A9 were both fitted to the Michaelis-Menten kinetics (Table 2; Fig. S10). In HLMs, the apparent Km, Vmax, and Clint values were 11.3 mM, 111 pmol · min−1 · mg protein−1, and 0.010 μl · min−1 · mg protein−1 for M8-1 and 15.1 mM, 1660 pmol · min−1 · mg protein−1, and 0.110 μl · min−1 · mg protein−1 for M8-2, respectively. The Km/Vmax value of M8-2 formation was approximately 11.2-fold higher than that of M8-1.
Kinetic parameters of racemic morinidazole glucuronidation using HLMs and recombinant human UGT1A9
For UGT1A9, the Km values for R- and S-morinidazole glucuronidation were calculated as 3.29 and 2.95 mM, respectively. The Vmax value of R-morinidazole glucuronidation was markedly higher than that of the S-isomer, which was similar to the results in HLMs. All data for N+-glucuronidation showed great similarity to those in HLMs and in the recombinant UGT1A9 incubation systems and supported the conclusion that N+-glucuronidation of morinidazole was mainly catalyzed by UGT1A9. Both HLMs and UGT1A9 showed a preference for M8-2 formation.
Elucidation of the Stereoselectivity in Sulfation of Morinidazole.
To investigate the stereoselectivity in sulfation of morinidazole, R- and S-morinidazole were individually incubated with human hepatocytes. Sulfate conjugate M7 was detected only in the S-morinidazole incubation samples by the UPLC/Q-TOF MS method. To improve the detection sensitivity, the incubation samples were analyzed by the API 4000 LC-MS/MS system in the multiple-reaction monitoring mode. The peak area ratio for S-/R-morinidazole sulfate was approximately 50 (Fig. 9). The results indicated that sulfation of morinidazole showed a large preference for the S-enantiomer.

MRM chromatograms of sulfate conjugate M7 in human liver hepatocyte incubations with R-morinidazole (A) and with S-morinidazole (B). XIC, extracted ion chromatogram; Rel. Int., relative intensity.
In Vitro Metabolism of Morinidazole to Metabolites M1 and M6.
Denitrated metabolite M1 was observed, albeit to a minor extent, after incubation of morinidazole with NADPH-supplemented pooled S9 fractions. M1 was not formed in HLM incubations and in control experiments lacking NADPH in the incubation mixture (Fig. 10). The results indicated that formation of the denitrated metabolite was catalyzed by cytosolic enzymes and was NADPH dependent. Cysteine conjugate M6 was detected in the HLM incubations and control incubations, and the amount of M6 in each incubation was similar. As a result, a conclusion was made that formation of M6 was independent of microsomal enzyme and NADPH. To further investigate whether M6 was a metabolite or whether it was an in vitro artifact, morinidazole (50 μM) was incubated in fresh pooled human urine for 4 h at 37°C or at room temperature. As a result, no M6 was observed, indicating that cysteine conjugate M6 was not produced during sample storage or processing.

Extracted ion chromatograms of m/z 226.156 (M1, denitrated metabolite) in the incubations of S9 fractions with (A) and without (B) NADPH and NADPH− fortified HLMs (C).
Discussion
In the present study, the metabolism, pharmacokinetics and excretion of morinidazole were investigated in humans. A total of 10 metabolites were detected after intravenous drip infusion administration of 500 mg of morinidazole (Figs. 2 and 4). In plasma, the parent compound was the major circulating component. M8-1, M8-2, and M7 were the primary metabolites. Approximately 70% of the intravenous dose was recovered in urine, with 21.2% as the unchanged morinidazole, 6.6% as M8-1, 28.4% as M8-2, and 13.0% as M7.
Compared with metronidazole, morinidazole contains a morpholine ring in the side chain. The biotransformation of morinidazole was compared with that of metronidazole. The main metabolic pathways of metronidazole in humans were hydroxylation, oxidation, O-glucuronidation, and sulfation (Stambaugh et al., 1967; O'Keefe et al., 1982; Thomsen et al., 1995). Morinidazole shared some common metabolic pathways with metronidazole, such as hydroxylation at the 2-methyl group of the imidazole ring and sulfation at the hydroxyl group of the side chain. However, the major metabolic reactions of morinidazole occurred on the morpholine ring, including carbonylation, N-oxidation, and N+-glucuronidation.
The two unusual and minor metabolites, M6 and M1, were detected in human urine. The in vitro studies demonstrated that the formation of M6 was independent on the microsome enzymes or NADPH. Under neutral aqueous conditions, morinidazole could react with cysteine by SN2 reaction and the nitro group was substituted by cysteine. The similar reaction has been reported for ronidazole and dimetridazole (Girard et al., 1993). After incubating morinidazole with HLMs and S9 fractions, M1 was detected only in NADPH-fortified S9 incubations, indicating that cytosolic enzyme was involved in this metabolic pathway.
Unlike O-glucuronidation of metronidazole, morinidazole glucuronidation occurred at the aliphatic tertiary amine of the morpholine ring. The appearance of the main fragment ion at m/z 320.136, which was 176 Da higher than m/z 144.098 (representing the 3-morpholinopropan-2-ol moiety), suggested that the conjugation site of morinidazole glucuronides was at the N atom of the morpholine ring. Enzymatic hydrolysis experiments offered further evidence for this hypothesis. The structural elucidation of M8-1 and M8-2 was also conducted by isolating and purifying the reference standards from postdose urine samples. M8-1 and M8-2 were identified as the N+-glucuronides of S- and R-morinidazole, respectively. Moreover, the incubation results of S- and R-morinidazole with UDPGA-supplemented HLMs also confirmed the exact structures of M8-1 and M8-2.
In general, O-glucuronidation was considered to be preferentially formed over N-glucuronidation (Franklin, 1998; Sorich et al., 2006). However, for drugs possessing a hydroxyl group as well as an aliphatic tertiary amine, the observed sites of glucuronidation were difficult to rationalize. Some drugs (such as morphine) in which glucuronidation occurred only at the hydroxyl group have been reported (Brunk and Delle, 1974; Coffman et al., 1997), and some, such as 10-hydroxylated amitriptyline and trans-4-hydroxytamoxifen, exhibited glucuronidation at both groups (Breyer-Pfaff et al., 1990; Ogura et al., 2006). In the present study, glucuronidation of morinidazole exhibited high regioselectivity, and no O-glucuronide metabolite was observed in vivo and in vitro. To the best of our knowledge, this phenomenon has not been reported previously. In further investigations, we found that another drug, henatinib, contains the same 3-morpholinopropan-2-ol moiety in its structure, but only O-glucuronide conjugate, not N+-glucuronide, was found in the in vivo and in vitro metabolism study (data not shown). As a result, we speculated that steric hindrance of the 2-methyl-5-nitro-imidazole ring hindered the enzymes necessary for the SN2 glucuronidation reactions. However, molecular modeling studies with Tripos Force Field in the Sybyl software 6.8 (Tripos, St. Louis, MO) did not support the hypothesis. We suggested that the association of UGT selectivity should be investigated in additional studies.
After an intravenous drip infusion administration of 500 mg of morinidazole, the plasma exposure of M8-2 was 6-fold higher than that of M8-1, and the cumulative amount of M8-2 excreted in human urine was much higher than that of M8-1, with a ratio of 4.3:1. These results suggested that the formation of M8-2 is preferred over M8-1. To test this, in vitro studies using HLMs were conducted. In the HLM incubation system, diastereoisomeric glucuronides of morinidazole M8-1 and M8-2 were observed. Kinetic analysis of the glucuronidation of racemic morinidazole was performed in HLMs fortified with UDPGA, and formation of M8-1 and M8-2 yielded Michaelis-Menten kinetics with similar affinity for HLMs and Km values of 11.3 and 15.1 mM, respectively. Their respective Vmax values were 111 and 1660 pmol · min−1 · mg protein−1 (Table 2), indicating a preference for M8-2 formation. Collectively, the results of the in vivo and in vitro studies demonstrated that N+-glucuronidation of morinidazole was stereoselective in humans, showing a large preference for the R-enantiomer. The in vitro metabolism study revealed that the sulfation favored the S-enantiomer.
To identify the human UGT isoform(s) involved in morinidazole glucuronidation, a panel of 12 commercially available recombinant human UGT isoforms was screened. When the substrate concentration was set at 50 μM, the glucuronides M8-1 and M8-2 were detected only in the UGT1A9 incubation system by LC-MS/MS, with glucuronidation activities of 0.979 and 15.9 pmol · min−1 · mg protein−1, respectively. At a higher substrate concentration (500 μM), UGT2B17 was found to contribute to morinidazole N+-glucuronidation but with a much lower reaction rate compared with that of UGT1A9. Niflumic acid (10.0 μΜ), a UGT1A9 inhibitor, inhibited the productions of M8-1 and M8-2 in HLMs to 52.8 and 8.7%, respectively (Fig. 8). Considering that UGT1A9 was mainly expressed in the liver and kidney and that 2B17 was mainly found in the gastrointestinal tract (Kaivosaari et al., 2011), the results indicated that the N+-glucuronidation of both S- and R-morinidazole in humans was mainly catalyzed by UGT1A9. The Km values of M8-1 and M8-2 formation by UGT1A9 were 3.3 and 3.0 mM, respectively, which were lower than those by HLMs (11.3 and 15.1 mM). Differences in the glucuronidation Km values between recombinant UGT1A9 and HLMs had been previously observed and were probably due to protein-protein interaction (Fujiwara et al., 2007; Omura et al., 2007).
In general, UGT1A4 was considered as an enzyme that specialized in N-glucuronidation, particularly catalyzing the conjugation of tertiary amines to quaternary N-glucuronides (Green et al., 1995; Green and Tephly, 1996, 1998). Later, UGT1A3 and UGT2B10 were also found to play important roles in the N+-glucuronidation reactions of some aliphatic tertiary amines (Hawes, 1998; Zhou et al., 2010; Kaivosaari et al., 2011). In the present study, among the 12 commercially available UGTs, only UGT1A9 was responsible for the N+-glucuronidation of the aliphatic tertiary amine of morinidazole. These results indicated that UGT1A9 was a newly identified UGT isoform involved in the N+-glucuronidation of drugs containing tertiary aliphatic amine.
In summary, the metabolism, pharmacokinetics, and excretion of morinidazole in humans were investigated after an intravenous drip infusion administration. Morinidazole undergoes extensive metabolism, including N-oxidation, hydroxylation, opening of the morpholine ring, denitration, cysteine conjugation, glucuronidation, and sulfation. N+-Glucuronidation of morinidazole was the major metabolic pathway, showing markedly regioselectivity and stereoselectivity both in vivo and in vitro. Morinidazole N+-glucuronidation appeared the first reported case of N+-glucuronidation occurring at the morpholine ring. UGT1A9 was found to be the major UGT isoform catalyzing the N+-glucuronidation of morinidazole. These results highlight the potential importance of UGT1A9 in the N+-glucuronidation of other drugs containing tertiary aliphatic amines.
Authorship Contributions
Participated in research design: Gao, Li, Zhong, and Chen.
Conducted experiments: Gao, Li, Xie, and Diao.
Contributed new reagents or analytic tools: Gao, Zhong, and Chen.
Performed data analysis: Gao, Zhong, and Chen.
Wrote or contributed to the writing of the manuscript: Gao, Zhong, and Chen.
Other: Zhong and Chen.
Acknowledgments
We thank Dr. Dong Liu and the nursing staff of Tongji Hospital (Wuhan, China) for their contribution to the clinical studies.
Footnotes
This work was supported in part by the National Natural Science Foundation of China [Grant 81173117].
Article, publication date, and citation information can be found at http://dmd.aspetjournals.org.
↵
 The online version of this article (available at http://dmd.aspetjournals.org) contains supplemental material.
-
ABBREVIATIONS:
- N+-glucuronide
- quaternary ammonium-linked glucuronide
- UPLC
- ultraperformance liquid chromatography
- Q-TOF MS
- quadrupole time-of-flight mass spectrometer
- MDF
- mass defect filter
- UGT
- UDP glucuronosyltransferase
- UDPGA
- uridine 5′-diphosphoglucuronic acid
- DMSO
- dimethyl sulfoxide
- HLMs
- human liver microsomes
- NOESY
- nuclear Overhauser enhancement spectroscopy
- LC-MS/MS
- liquid chromatography-tandem mass spectrometry
- AUC
- area under the plasma concentration-time curve
- CE
- collision energy.

- Received September 6, 2011.
- Accepted December 19, 2011.
- Copyright © 2012 by The American Society for Pharmacology and Experimental Therapeutics


