


Abstract
The disposition of ertugliflozin (PF-04971729), an orally active selective inhibitor of the sodium-dependent glucose cotransporter 2, was studied after a single 25-mg oral dose of [14C]-ertugliflozin to healthy human subjects. Mass balance was achieved with approximately 91% of the administered dose recovered in urine and feces. The total administered radioactivity excreted in feces and urine was 40.9% and 50.2%, respectively. The absorption of ertugliflozin in humans was rapid with a Tmax at ∼1.0 hour. Of the total radioactivity excreted in feces and urine, unchanged ertugliflozin collectively accounted for ∼35.3% of the dose, suggestive of moderate metabolic elimination in humans. The principal biotransformation pathway involved glucuronidation of the glycoside hydroxyl groups to yield three regioisomeric metabolites, M4a, M4b, and M4c (∼39.3% of the dose in urine), of which M4c was the major regioisomer (∼31.7% of the dose). The structure of M4a and M4c were confirmed to be ertugliflozin -4-O-β- and -3-O-β-glucuronide, respectively, via comparison of the HPLC retention time and mass spectra with authentic standards. A minor metabolic fate involved oxidation by cytochrome P450 to yield monohydroxylated metabolites M1 and M3 and des-ethyl ertugliflozin (M2), which accounted for ∼5.2% of the dose in excreta. In plasma, unchanged ertugliflozin and the corresponding 4-O-β- (M4a) and 3-O-β- (M4c) glucuronides were the principal components, which accounted for 49.9, 12.2, and 24.1% of the circulating radioactivity. Overall, these data suggest that ertugliflozin is well absorbed in humans, and eliminated largely via glucuronidation.
Introduction
Type 2 diabetes mellitus (T2DM) is characterized by insulin resistance in muscle and liver, resulting in higher blood glucose levels (DeFronzo, 1988,2009). In healthy subjects, glucose filtered from the blood in the glomerulus is almost completely reabsorbed, such that less than one percent of glucose is excreted in urine. The transport of glucose from the tubule into the tubular epithelial cells is mediated by the sodium-dependent glucose cotransporters (SGLTs), which belong to a large family of sodium glucose cotransporters (Wright and Turk, 2004). Two SGLT isoforms have been identified: SGLT2, which is exclusively expressed in the brush border of epithelial cells in S1 and S2 segments of proximal renal tubules, and SGLT1, which is expressed primarily in the small intestine, S3 segment of the proximal tubule of the kidney, and myocardium (Pajor and Wright, 1992; Wright, 2001). About 90% of glucose filtered in the urine is reabsorbed through SGLT2 (Kanai et al., 1994; Wallner et al., 2001).
Selective suppression of SGLT2 activity by small molecule inhibitors increases excretion of glucose from the body (via inhibition of renal glucose reabsorption) and assists in the reduction of hyperglycemia in T2DM (Oku et al., 1999; Adachi et al., 2000; Zhang et al., 2005; Bołdys and Okopień 2009; Neumiller et al., 2010). Because of their ability to increase urinary glucose excretion in T2DM, SGLT2 inhibitors offer the advantage of plasma glucose-lowering without inducing excessive insulin secretion (Katsuno et al., 2007; Fujimori et al., 2008; Wilding et al., 2009; Patel and Fonseca, 2010). Furthermore, the increase in urinary glucose excretion leads to a negative energy balance and osmotic diuresis, making it a unique antidiabetic agent that reduces also body weight and blood pressure in diabetic patients (Abdul-Ghani and DeFronzo, 2008; Nair and Wilding, 2010). Several SGLT2-selective inhibitors are in various stages of clinical trials (Hussey et al., 2010; Sha et al., 2011; Grempler et al., 2012; Shah et al., 2012), and proof-of-concept has been reported with dapagliflozin (Forxiga; Bristol-Myers Squibb, NY), in phase III studies in patients with T2DM (Bailey et al., 2010; Ghosh et al., 2012).
(1S,2S,3S,4R,5S)-5-[4-Chloro-3-(4-ethoxybenzyl)phenyl]-1-hydroxymethyl-6,8-dioxabicyclo[3.2.1]octane-2,3,4-triol (ertugliflozin, PF-04971729) (Fig. 1) belongs to a new class of potent and selective SGLT2 inhibitors bearing a dioxa-bicyclo[3.2.1]octane bridged ketal motif and is currently in development for the treatment of T2DM (Mascitti et al., 2011). The results from pharmacokinetics studies in rats and dogs suggested that ertugliflozin is well absorbed with oral bioavailability of 69% and 94%, respectively (Kalgutkar et al., 2011). The in vitro metabolic profile of ertugliflozin in liver microsomes and cryopreserved hepatocytes from rat, dog, and human was qualitatively similar; prominent metabolic pathways included monohydroxylation, O-deethylation, and glucuronidation (Kalgutkar et al., 2011). Following single oral dose administration to healthy subjects, ertugliflozin was rapidly absorbed with mean plasma concentrations occurring at 0.5 to 1.5 hours postdose. Systemic exposure as ascertained from maximal plasma concentrations (Cmax), and area under the plasma concentration time curve (AUC) appeared to be dose proportional over the dose range evaluated of ertugliflozin (0.5–300 mg) in healthy human subjects (Phase I data on file). The terminal elimination half-life (t1/2) of ertugliflozin was 11–17 hours, and oral clearance was within 1.5-fold of that predicted from allometric scaling of animal pharmacokinetics (Kalgutkar et al., 2011). The aims of the present study were (1) to quantify the levels of ertugliflozin and total radioactivity in plasma, (2) to investigate the routes of elimination of ertugliflozin, (3) to examine the biotransformation fate of ertugliflozin, and (4) to demonstrate mass balance in healthy male subjects after a single 25-mg oral dose of [14C]-ertugliflozin administered as a l-pyroglutamic acid co-crystal.
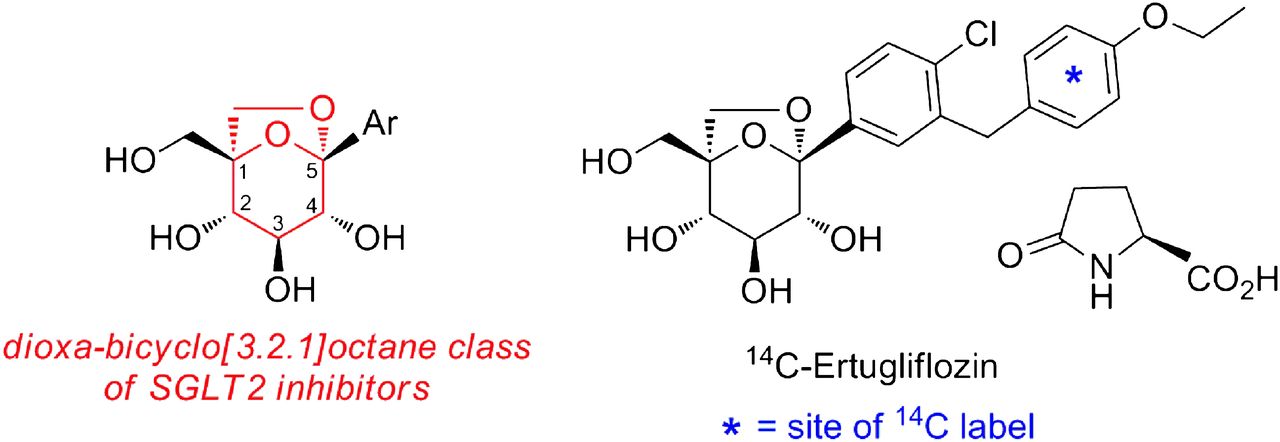
Structure of ertugliflozin l-pyroglutamate co-crystal.
Materials and Methods
Chemicals and Reference Compounds
Ertugliflozin and [14C]-ertugliflozin l-pyroglutamic acid co-crystal (specific activity of the co-crystal and active forms were 3.09 μCi/mg and 4.18 μCi/mg, respectively, and the radiochemical purity was >99%) were synthesized at Pfizer Worldwide Research and Development (Groton, CT). The chemical structure of ertugliflozin and the position of the radiolabel are illustrated in Fig. 1. Reduced NADPH and uridine-diphosphate-glucuronic acid trisodium salt (UDPGA) were obtained from Sigma-Aldrich (St. Louis, MO). Human liver microsomes were prepared from a mixed sex pool of 50 donors (provided by BD Biosciences, Woburn, MA). All other commercially available reagents and solvents were of either analytical or HPLC grade. The syntheses of (1S,2S,3S,4R,5S)-5-{4-chloro-3-[(R)-(4-ethoxyphenyl)(hydroxyl)methyl]phenyl}-1-(hydroxymethyl)-6,8-dioxabicyclo[3.2.1]octane-2,3,4-triol (M1a) and (1S,2S,3S,4R,5S)-5-{4-chloro-3-[(S)-(4-ethoxyphenyl)(hydroxyl)methyl]phenyl}-1-(hydroxymethyl)-6,8-dioxabicyclo[3.2.1]octane-2,3,4-triol (M1b), (1S,2S,3S,4R,5S)-5-[4-chloro-3-(4-hydroxybenzyl)phenyl]-1-(hydroxymethyl)-6,8-dioxabicyclo[3.2.1]octane-2,3,4-triol (M2),
(2S,3S,4S,5R,6R)-6- (1S,2S,3S,4R,5S)-5-[4-chloro-3-(4-ethoxybenzyl)phenyl]-2,3-dihydroxy-1-(hydroxymethyl)-6,8-dioxabicyclo[3.2.1]octan-4-yl)oxy-3,4,5-trihydroxytetrahydro-2H-pyran-2-carboxylic acid (M4a) and (2S,3S,4S,5R,6R)-6-[(1S,2S,3S,4R,5S)-5-[4-chloro-3-(4-ethoxybenzyl)phenyl]-2,4-dihydroxy-1-(hydroxymethyl)-6,8-dioxabicyclo[3.2.1octan-4-yl)oxy)-3,4,5-trihydroxytetrahydro-2H-pyran-2-carboxylic acid (M4c) have been described elsewhere (see Mascitti, 2011 and Mascitti et al., 2013). The absolute configuration of M1a and M1b was arbitrarily assigned.
Human Study
The study protocol, consent documents, consent procedures, and subject recruitment procedures were approved by the Independent Institutional Review Board. The study was conducted in compliance with the International Conference on Harmonization Good Clinical Practices guidelines, the ethical principles that have their origin in the Declaration of Helsinki, and the U.S. Food and Drug Administration regulations for informed consent and protection of subject rights. The study design incorporated a nonrandomized, open-label, single-period assessment of pharmacokinetics in six healthy male subjects between the ages of 20 and 55 years with a body mass index between 23.8 and 30.2 kg/m2. All subjects provided written, informed consent before participation in the study. Subjects were confined to the Clinical Research Unit (Charles River Clinical Services, Tacoma, WA) under continuous observation approximately 12 hours before dose through at least 144 hours postdose or until a minimum of 90% of the radioactive dose administered was recovered or less than 1% was excreted in a 24-hour period for 2 consecutive days. After an overnight fast, subjects received a single oral dose of [14C]-ertugliflozin pyroglutamate co-crystal (25-mg equivalent of ertugliflozin, ∼100 μCi/subject) as a suspension in methyl cellulose (total aqueous volume administered was 240 ml). After administration, all subjects were required to refrain from eating and drinking beverages during the first 4 hours after dosing. Subjects were prohibited from consuming grapefruit or grapefruit-related citrus fruits (e.g., Seville oranges or pomelos) from 7 days prior to dosing until the collection of the final pharmacokinetics blood sample. Administration of the study drug under the supervision of medical personnel ensured adherence. Venous blood samples were collected in heparinized tubes (containing K2 EDTA as an anticoagulant) from each subject and at 0.25, 0.5, 1, 2, 3, 4, 6, 9, 12, 24, 36, 48, 72, 96, 120, and 144 hours postdose. Each sample consisted of 10 ml blood (for measurement of total [14C] radioactivity and ertugliflozin). For analysis of ertugliflozin metabolites, venous blood samples (∼30 ml) were collected from each subject at predose and at 1, 3, 6, and 12 hours postdose. All blood samples were centrifuged, and plasma samples were collected in separate tubes. Urine samples were collected at predose and at 0- to 12-, 12- to 24-, and then at 24-hour intervals for up to 216 hours for subjects 1001, 1002, 1003, 1005, and 1006, or up to 288 hours for subject 1004. Feces were collected as passed (1 collection per each 24-hour period) from time of dosing for up to 216 hours for subjects 1001, 1002, 1003, 1005, and 1006, or up to 288 hours for subject 1004. All samples were stored at or below −20°C until analysis.
Measurement of Total Radioactivity in Plasma, Urine, and Feces
The analysis of total radioactivity in urine, feces, and plasma was conducted at Charles River Laboratories Preclinical Services (Senneville, Quebec, Canada). Total radioactivity in plasma, urine, and feces was measured using a Packard 2500 liquid scintillation counter (PerkinElmer Life and Analytical Sciences, Boston, MA). The total radioactivity in plasma was expressed as nanogram-equivalents (ng-equiv)/ml ertugliflozin. For all subjects, duplicate 400 μl weighed aliquots of plasma and urine were processed for analysis of total radioactivity. Aliquots of plasma and urine were mixed directly with 10 ml of Hionic Fluor scintillation fluid, followed by liquid scintillation counting (LSC). For fecal samples, samples were homogenized with deionized water (50% w/w, feces/water). Triplicate weighed aliquots of fecal homogenates (∼400 mg) were air-dried before combustion using a PerkinElmer Model 307 sampler oxidizer. Radioactivity in the combustion products was determined by trapping the liberated 14CO2 mixed with liquid scintillation fluid for radioactivity measurement.
Quantitation of Ertugliflozin in Plasma
Plasma concentrations of ertugliflozin were determined at Tandem Laboratories (West Trenton, NJ) using a validated liquid chromatography tandem mass spectrometry (LC-MS/MS) assay (Kalgutkar et al., 2011). Calibration response curves were linear over a range of 0.5 to 250 ng/ml using an weighted (l/concentration2) linear least squares regression. The lower limit of quantitation for ertugliflozin was 0.5 ng/ml.
Quantitation of Total Radioactivity in Plasma
Plasma samples were analyzed for total radioactivity concentrations (parent drug equivalents) at Charles River Laboratories (Senneville) using a validated analytical assay in compliance with the sponsor’s standard operating procedures. Samples were assayed using a validated, sensitive, and specific liquid scintillation spectroscopy method. The lower limit of quantitation for total radioactivity in plasma was 6.7 ng-equiv/ml.
Pharmacokinetic Analysis
Pharmacokinetic parameters were determined using noncompartmental analysis. Maximum plasma concentrations (Cmax) of ertugliflozin or total radioactivity in plasma were estimated directly from the experimental data, with Tmax defined as the time of first occurrence of Cmax. Terminal elimination rate constants (kel) were estimated by linear regression of the log-linear plasma concentration-time curve. t1/2 was calculated as 0.693/kel. AUC from time t to infinity [AUC(t–∞)] was extrapolated from AUC(0–t) adding Clast/kel, where Clast is the predicted plasma concentration at the last quantifiable time point estimated from the log-linear regression analysis.
Extraction of Metabolites from Biologic Matrices
Plasma.
Plasma samples were pooled according to the Hamilton method (Hamilton et al., 1981). Pooled plasma samples (0–24 hours, 11 ml) were precipitated by the addition of 30 ml of acetonitrile while vortexing vigorously for 15–30 minutes. After centrifugation (3000 g for 10 minutes), the supernatants were removed. The pellet was re-extracted with 10 ml of acetonitrile, and the two supernatants were combined. Aliquots (1 ml) were counted by LSC. The recovery of radioactivity after extraction was determined to be 83–101%. The supernatants were concentrated to dryness in a TurboVap LV evaporator (Zymark Corporation, Hopkinton, MA). The residues were reconstituted in 0.5 ml of water, and 100 μl aliquots were injected onto the HPLC column for analysis.
Urine.
Urine samples were pooled from 0 to 48 hours for each subject in proportion to the volume of samples collected at each different collection interval; the radioactivity in the sample pool represented >92% of the total radioactivity excreted in urine for each subject. Pooled urine samples (∼15 ml/each subject) were lyophilized at −50°C overnight. The residue was reconstituted with 0.8 ml of water, vortexed, and centrifuged for 5 minutes at 2740 g. An aliquot (100 ml) was injected onto the HPLC column for analysis.
Feces.
Fecal homogenates containing the highest levels of excreted radioactivity were pooled on a percentage weight basis for each subject and represented >96% of total radioactivity excreted in feces. Pooled fecal samples (12–18 g) were transferred to a 500 ml Erlenmeyer flask that contained 40 ml of acetonitrile, and then the flask was sonicated for 15 minutes and vigorously shaken in a 37°C water bath for 15 minutes. After centrifugation at 2740 g for 10 minutes, the supernatant was transferred to a 100-ml Erlenmeyer flask, and the remaining residue was further extracted with acetonitrile (2 × 30 ml). The two supernatants were combined, and a 1-ml aliquot was counted for radioactivity by LSC. The extraction recovery was estimated to be 85–96%. The supernatants were evaporated to dryness under nitrogen in a Turbo Vap LV evaporator. The residue was reconstituted in 1 ml of methanol, and aliquots (50 µl) of concentrated fecal extracts were injected onto the HPLC column for analysis.
Quantitative Assessment of Metabolites
Metabolite quantification from urine, feces, and plasma was performed by measuring the areas of individually separated HPLC peaks detected using a β-RAM (IN/US Systems, Tampa, FL) and the Laura program (version 3.1.1.39; LabLogic System Ltd., Sheffield, UK). The β-RAM provided integrated peak representation in counts per minute and the percentage of total radioactivity comprised by each peak within the radiochromatogram. The β-RAM was operated in the homogeneous liquid scintillation counting mode with the addition of 3 ml/min Tru-Count (IN/US) scintillation cocktail to the HPLC effluent.
High-Performance Liquid Chromatography
The HPLC system consisted of an Agilent-1100 quaternary solvent delivery system, an Agilent-1100 membrane degasser, an Agilent-1100 autoinjector, an Agilent 1100 photodiode array detector (Hewlett Packard, Palo Alto, CA), and an IN/US radioactive monitor (β-RAM). Chromatography was performed on a Phenomenex Synergi, RP column (4.6 mm × 150 mm, 4 µm) with a mobile phase comprised of 5 mM ammonium formate, pH = 3.0 (solvent A), and acetonitrile (solvent B). The mobile phase gradient was programmed as follows: initiated with 95% A, changed to 30% A over 45 minutes, followed by a short gradient to 5% A from 45 to 52 minutes, and returned to initial gradient of 95% A from 53 to 60 minutes. The system was allowed to equilibrate for 7 minutes prior to the next injection. A flow rate of 1.0 ml/min was maintained throughout the analysis. For plasma, four consecutive injections (100 μl each, 0.5 minutes apart) were made onto the column to accomplish one profiling analysis. During the first three injections, the HPLC system was operated at a flow rate of 0.2 ml/min with a mobile phase consisting of ammonium formate buffer/acetonitrile (97:3). After the fourth injection, the HPLC system resumed the normal gradient program as described above.
LC-MS/MS
Identification of the metabolites was performed on a Thermo LTQ (Thermo Fisher Scientific) operated with an electrospray ionization source. The effluent from the HPLC column was split, and ∼50 μl/min was introduced into the API interface. The remaining effluent was directed to the flow cell of β-RAM. The β-RAM response was recorded in real time by the mass spectrometer that provided simultaneous detection of radioactivity and mass spectrometry data. The interface was operated at 4500 V, and the mass spectrometer was operated in the positive ion mode with a capillary temperature set at 240°C. Structural information was generated from the collision-induced dissociation (CID) spectra of the molecular ions (MH+). Due to the lack of nitrogen atoms and/or other positively charged sites in the structural architecture of ertugliflozin, CID spectra of parent and metabolites in the mass balance study were attained from the corresponding ammonium adducts, and structure elucidation was based on these adducts.
Identification of Ertugliflozin Metabolites
Stock solutions of unlabeled ertugliflozin and authentic standards of M1 diastereomers, des-ethyl ertugliflozin (M2), erutgliflozin-4-β-O-glucuronide (M4a), and ertugliflozin-3-β-O-glucuronide (M4c) were prepared in methanol
Generation of oxidative metabolites.
The incubation volume was 1 ml and consisted of the following: 0.1 M potassium phosphate buffer (pH 7.4), human liver microsomes (P450 concentration = 0.5 μM), NADPH (1.0 mM), and ertugliflozin (10 μM). The reaction mixture was prewarmed at 37°C for 2 minutes before adding NADPH. The final concentration of methanol in the incubation media was 0.2% (v/v) and incubations were carried out at 37°C for 60 minutes in a shaking water bath.
Generation of ertugliflozin glucuronide metabolites.
Human liver microsomes (protein concentration = 0.7 mg/ml) were mixed with 100 mM phosphate buffer (pH 7.4), MgCl2 (5 mM), ertugliflozin (10 μM), and alamethicin (10 μg/ml). The mixture was placed on ice for 15 minutes to allow alamethicin pore formation, followed by the addition of UDPGA (5 mM) to a final incubation volume of 1.0 ml. The reaction mixture was incubated at 37°C for 60 minutes. Enzymatic reactions were terminated by the addition of ice-cold acetonitrile (4 ml). The solutions were centrifuged (3,000 g, 15 minutes), and the supernatants were dried under a steady nitrogen stream. The residue was reconstituted with 25% aqueous acetonitrile (250 μl) and analyzed for metabolite formation by LC-MS/MS. The retention time (tR) and mass spectral characteristics of enzymatically generated M1a/M1b, M2, M4a, and M4c were compared with those of the authentic standards.
LC-MS/MS Assay for Structural Characterization of In Vitro Metabolites
Analysis of human liver microsomal incubations was performed on a LTQ Orbitrap XL mass spectrometer (Thermo Fisher Scientific, Bremen, Germany) using an electrospray ionization source operating in a negative-ion mode. The HPLC system consisted of an Accela pump, autosampler, and diode array detector. Full scan mass spectra were acquired at a resolution setting of 15,000 with data-dependent scans yielding CID of the most intense ion from the full scan and CID of the most intense ion from the second scan event. The mobile phase consisted of 5 mM ammonium formate adjusted to pH 3.0 with formic acid (solvent A) and acetonitrile (solvent B) at a flow rate of 1.0 ml/min. Separation of the ertugliflozin glucuronide metabolites M4a and M4c was achieved on a Phenomenex Hydro RP column (4.6 mm × 150 mm, 4 μm particle size) (Phenomenex, Torrance, CA). The gradient profile was 5% B from 0 to 5 minutes increasing in linear fashion to 80% by 35 minutes, 95% from 36 to 37 minutes, and then returning to starting conditions in 10 minutes. Separation of the M1a and M1b diastereomers was achieved on a Phenomenex Gemini C18 column (4.6 mm × 250 mm, 5 μm particle size) (Phenomenex). The gradient profile was 5% B from 0 to 5 minutes increasing in linear fashion to 50% by 40 minutes, 95% from 41 to 44 minutes, and then returning to starting conditions in 10 minutes.
Results
Pharmacokinetics of Ertugliflozin and Total Radioactivity
Mean concentration-time profiles of ertugliflozin and total radioactivity in plasma of humans after oral administration of [14C]-ertugliflozin are depicted in Fig. 2. The pharmacokinetic parameters for ertugliflozin and total radioactivity are shown in Table 1. After a single 25-mg oral dose, plasma concentrations of ertugliflozin and total radioactivity both peaked at approximately 1 hour, indicating rapid oral absorption. Terminal phase t1/2 values for ertugliflozin and total radioactivity were comparable, averaging approximately 17 hours (Table 1). Quantifiable concentrations of plasma ertugliflozin were observed up to ∼96 hours postdose, whereas plasma total radioactivity concentrations were quantifiable up to ∼72 hours postdose. The ratios of Cmax and AUC(0–∞) of ertugliflozin to total radioactivity were 0.67 and 0.44, respectively, suggesting that ertugliflozin accounted for approximately 50% of the circulating radioactivity. Variability in Cmax and AUC(0–∞), based on geometric percent coefficient of variation (% CV), was low and generally similar for ertugliflozin and total radioactivity, ranging from 12% to 20%.

Mean plasma concentration–time profiles of ertugliflozin and total radioactivity in healthy male volunteers after a 25-mg single oral dose of [14C]-ertugliflozin (N = 6).
Pharmacokinetic parameters of ertugliflozin and total radioactivity after a single 25-mg oral dose of [14C]-ertugliflozin to healthy male subjects (N=6)
Mass Balance
The excretion of radioactivity in urine and feces is summarized in Table 2. The mean (±S.D.) total recovery of administered radioactivity for the six subjects was 91.1%, of which 50.2 ± 10.1% was recovered in urine and 40.9 ± 7.1% was recovered in feces. The target recovery of >90% was achieved at ∼168 hours postdose. The excretion of radioactivity in urine was rapid; at 24 hours postdose, the mean cumulative recovery was 40 ± 7.0%, which accounted for ∼80% of total radioactivity recovered in urine. At 48 hours postdose, the mean cumulative recovery was 46.1 ± 8.7%, constituting approximately 92% of total radioactivity recovered in urine. At 96 and 168 hours postdose, the mean cumulative recoveries were 49.2 ± 9.7% and 50.1 ± 10.1% percent, respectively, which represented ∼98% and 99.8% of total radioactivity recovered in urine. The excretion of radioactivity in feces was prolonged due to irregular bowel movement observed in some subjects. At 24, 48, 72, 96, and 168 hours postdose, the mean (±S.D.) cumulative recovery was 4.5 ± 9.8%, 11.4 ± 16.7%, 20.9 ± 17.8%, 28.3 ± 17.5%, and 40.3 ± 7.1%, which accounted for approximately 11%, 28%, 51%, 69%, and 98.5% of the total radioactivity recovered in feces, respectively.
Excretion of radioactivity in human urine and feces after an oral dose of 25 mg [14C]-ertugliflozin
Quantitative Profiles of [14C]- Ertugliflozin and Metabolites in Excreta and Circulation
Urine.
A representative HPLC-radiochromatogram of urinary metabolites is shown in Fig. 3A. The mean percentages of metabolite detected in human urine, expressed as percent of administered dose, are shown Table 3. Unchanged ertugliflozin and a total of seven metabolites were detected in human urine. Unchanged ertugliflozin was a minor urinary metabolite, which represented 1.5% of the administered dose. In contrast, metabolites M4a, M4b, M4c, M5a, and M5b were the major components in urine. Collectively, they accounted for 43.9% of the administered dose and 87.8% of total radioactivity excreted in the urine.

Representative HPLC radiochromatograms of ertugliflozin and its metabolites in human urine (A), feces (B), and plasma (C) after a single 25-mg oral dose of [14C]-ertugliflozin.
Percentages (Mean ± S.D.) of excretory metabolites of ertugliflozin in humans after administration of a single 25-mg oral dose of [14C]-ertugliflozin (N = 6)
Feces.
A representative HPLC-radiochromatogram of human fecal metabolites is shown in Fig. 3B. The mean percentages of fecal metabolites, expressed as percentage of the administered dose, are shown in Table 3. Unchanged ertugliflozin was the major component in feces, accounting for ∼90% of the recovered radioactivity in feces and 33.8% of the administered dose. Minor metabolites M1, M2, and M3 were also detected in the fecal samples, which represented <2.0% of the administered dose.
Plasma.
A representative HPLC radiochromatogram of circulating metabolites in human plasma is shown in Fig. 3C. The relative amounts of [14C]-ertugliflozin and metabolites, expressed as percentage of total radioactivity, are presented in Table 4. Ertugliflozin and a total of six metabolites were detected in circulation. The majority of circulating radioactivity was attributed to unchanged ertugliflozin (49.9%). Metabolites M1, M2, M4a, M4b, M4c, and M5a accounted for 2.5, 1.3, 12.2, 4.1, 24.1, and 6.0% of the circulating radioactivity.
Percentages (mean ± S.D.) of circulating metabolites of ertugliflozin in humans after administration of a single 25-mg oral dose of [14C]-ertugliflozin (N = 6)
Identification of Metabolites
Table 5 displays the proposed structures of ertugliflozin metabolites detected in humans upon administration of a single 25-mg oral dose of [14C]-ertugliflozin. Under the current experimental conditions, ertugliflozin possessed a tR of ∼36.4 minutes on HPLC and showed an ammonium adduct ion [M+NH4]+ at m/z 454 under positive ionization conditions. The CID spectra displayed the expected fragment ions at m/z 437, 419, 329, 273, 207, 155, and 135 as noted in our previous work (Kalgutkar et al., 2011). Thus, the ion at m/z 437 occurred from the loss of NH3, whereas, the fragment ion at m/z 329 resulted from a neutral loss of 125 Da (C3H11O4N) from the ammoniated modified glucose moiety of parent compound. The fragment ions at m/z 207 and m/z 135 were derived from the loss of ethoxybenzene motif from the fragment ion at m/z 329.
Liquid chromatography tandem mass spectrometry (LC-MS/MS) characteristics and proposed structures of ertugliflozin metabolites observed in the human mass balance study
Metabolite M1.
M1 had a tR of ∼27.9 minutes on HPLC and showed an ammonia adduct ion [M+NH4]+at m/z 470, an addition of 16 Da to the molecular weight of ertugliflozin, which suggested that M1 was a monohydroxylated metabolite of ertugliflozin. The CID spectrum of M1 displayed fragment ions at m/z 435, 407, 299, 243 and 215. The ion at m/z 435 was due to the sequential loss of NH3 and H2O. The most abundant fragment ion, which occurred at m/z 407 (loss of 28 Da from m/z 435) was derived from the loss of ethylene unit. The absence of fragment ions derived from benzylic cleavage (e.g., m/z 207 and 135 seen in the mass spectrum of ertugliflozin) in the CID spectrum of M1 suggested the benzylic position as the most likely site of hydroxylation.
Metabolite M2.
M2 had a tR of ∼27.2 minutes on HPLC and displayed an ammonia adduct ion [M+NH4]+at m/z 426, corresponding to a loss of 28 Da from the molecular weight of ertugliflozin.
Unambiguous structural characterization of M1 and M2 was obtained from an in vitro incubation of unlabeled ertugliflozin (10 μM) in NADPH-supplemented human liver microsomes. M1, which is derived from hydroxylation at the bis-benzylic position, can exist as one of the two possible diastereomeric forms, M1a and M1b, respectively (Fig. 4). As shown in Fig. 4, the HPLC tR of M1 generated in human liver microsomes (and observed in systemic circulation) suggested that both the M1a and M1b diastereomers were formed at a ratio of ∼85:15 in favor of M1b. In the case of M2, the HPLC tR and MS characteristics of the enzymatically generated metabolite were identical to des-ethyl ertugliflozin. CID spectra for M1a/M1b and M2 observed in microsomal incubations and in vivo were identical to the respective synthetic standards (unpublished data).
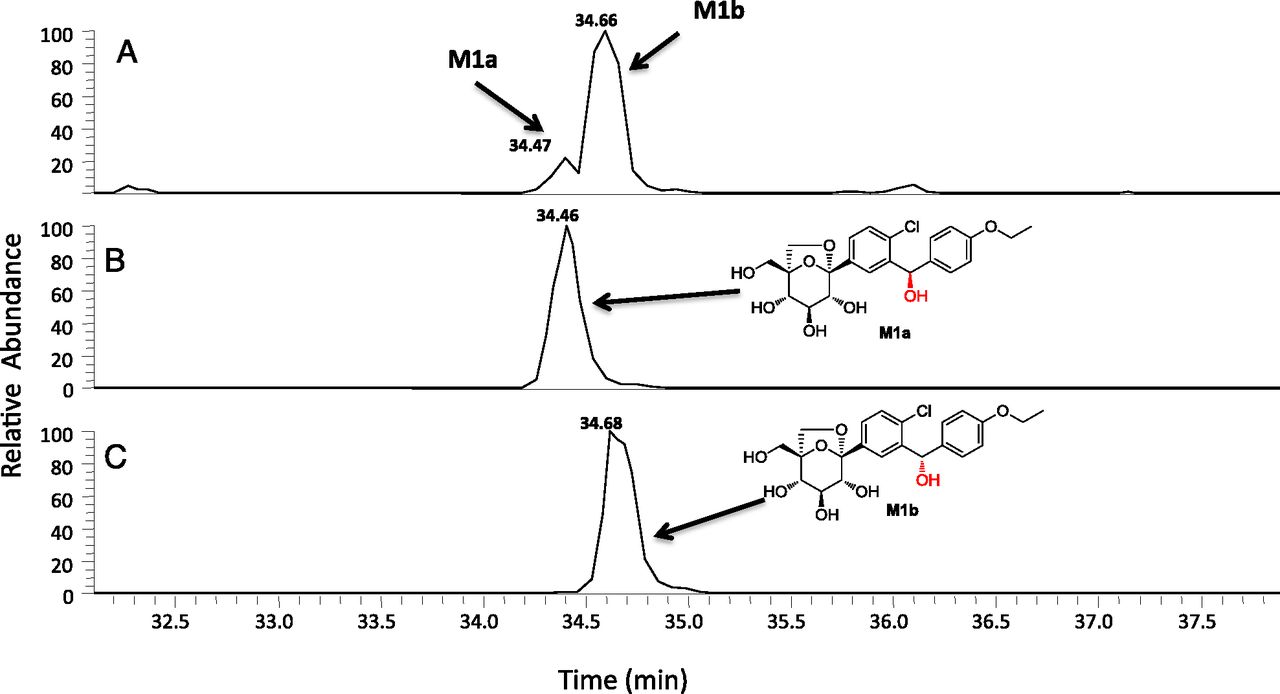
Extracted ion chromatogram of a NADPH-supplemented human liver microsomal incubation with ertugliflozin (10 μM) conducted at 37°C for 60 minutes (A). (B and C) HPLC tR of authentic standards of the diastereomers M1a and M1b, respectively.
Metabolite M3.
M3 had a tR of ∼29.8 minutes on HPLC and displayed an ammonia adduct ion [M+NH4]+at m/z 470, suggestive of a monohydroxylated PF-04971729 metabolite. The CID spectrum of M3 exhibited fragment ions at m/z 453, 435, 345, 327, 207, 151, and 139. The fragment ion at m/z 207, which was discerned in the mass spectra of M3 and ertugliflozin, suggested that the chlorobenzyl group was not modified. The fragment ion at m/z 151, which is 16 Da higher than the characteristic ion at m/z 135 in ertugliflozin, suggested that the hydroxylation in M3 occurred on the aromatic portion of the ethoxyphenyl ring; a proposed structure that is consistent with the fragmentation pattern is depicted in Table 5.
Metabolites M4a, M4b, and M4c.
M4a, M4b, and M4c were regioisomers that displayed identical ammonia adduct ions [M+NH4]+ at m/z 630. The molecular weights of M4a, M4b, and M4c were 176 Da higher than ertugliflozin, suggesting that they were obtained from glucuronidation of the glycoside hydroxyl groups (Table 5). Chromatographically, M4a, M4b, and M4c were well separated with tR of 29.4 minutes, 31.3 minutes, and 34.3 minutes, respectively (see Fig. 3). Additional insight into the regiochemistry of glucuronidation was obtained via separate in vitro incubations of unlabeled ertugliflozin (10 μM) in UDPGA-supplemented human liver microsomes. LC-MS analysis in the negative ion mode revealed the formation of the ertugliflozin glucuronides, M4a and M4c, with an identical molecular mass (M–H−) of 611.1537 (Fig. 5A). As seen in Fig. 5, B and C, the HPLC tR of M4a and M4c generated from the microsomal incubations were identical to the authentic standards of ertugliflozin -4-β-O-glucuronide and ertugliflozin -3-β-O-glucuronide, respectively. The CID spectra of authentic M4a and M4c, which are shown in Fig. 6, were identical to those of enzymatically formed M4a and M4c, respectively.
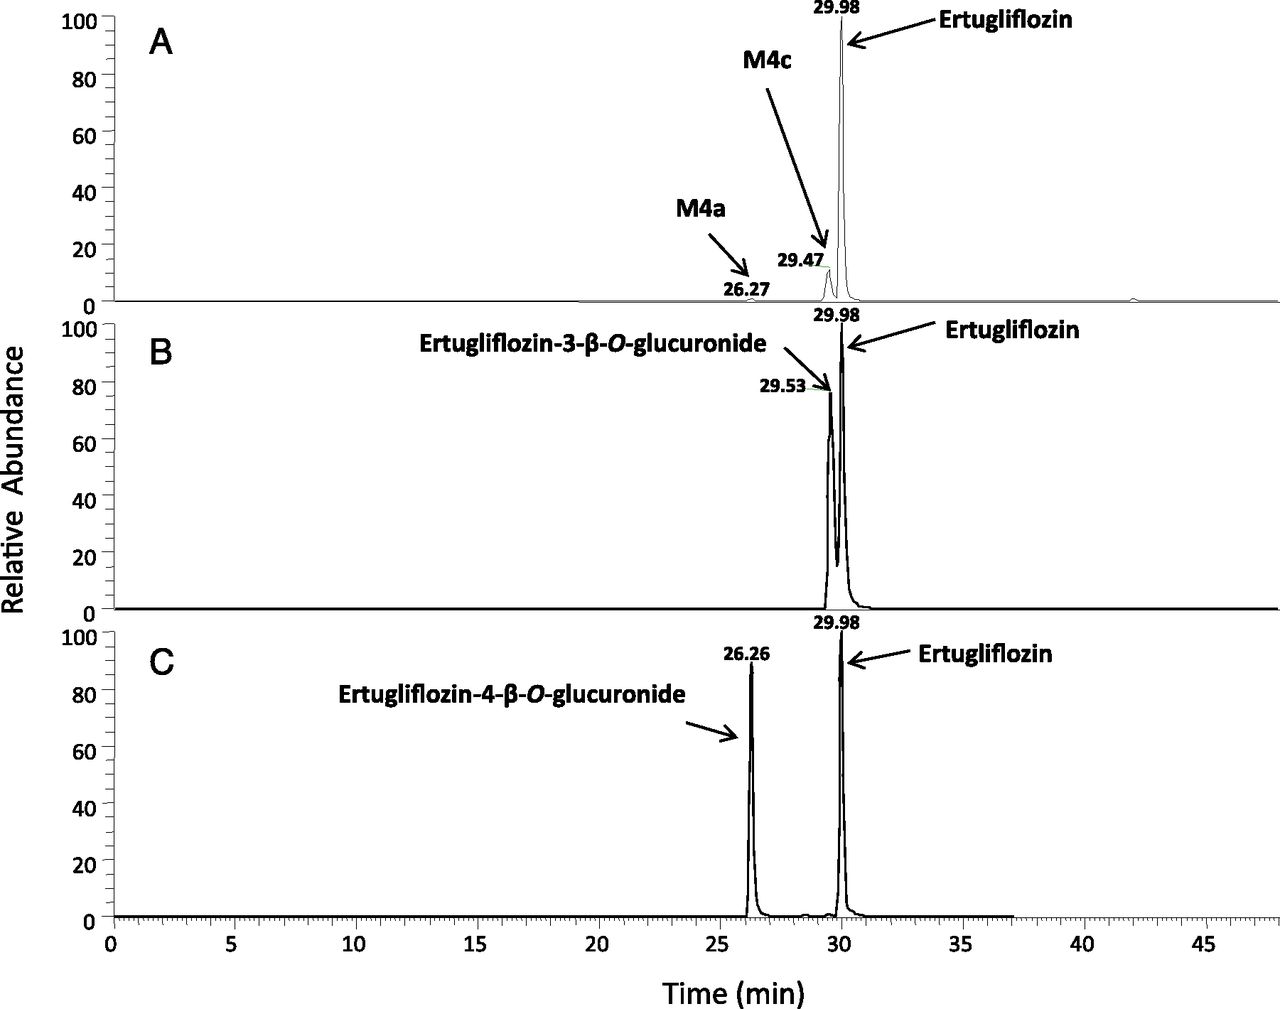
Extracted ion chromatogram of a UDPGA-supplemented human liver microsomal incubation with ertugliflozin (10 μM) conducted at 37°C for 60 minutes (A). (B and C) HPLC tR of authentic standards of ertugliflozin with ertugliflozin glucuronides M4a and M4c, respectively.
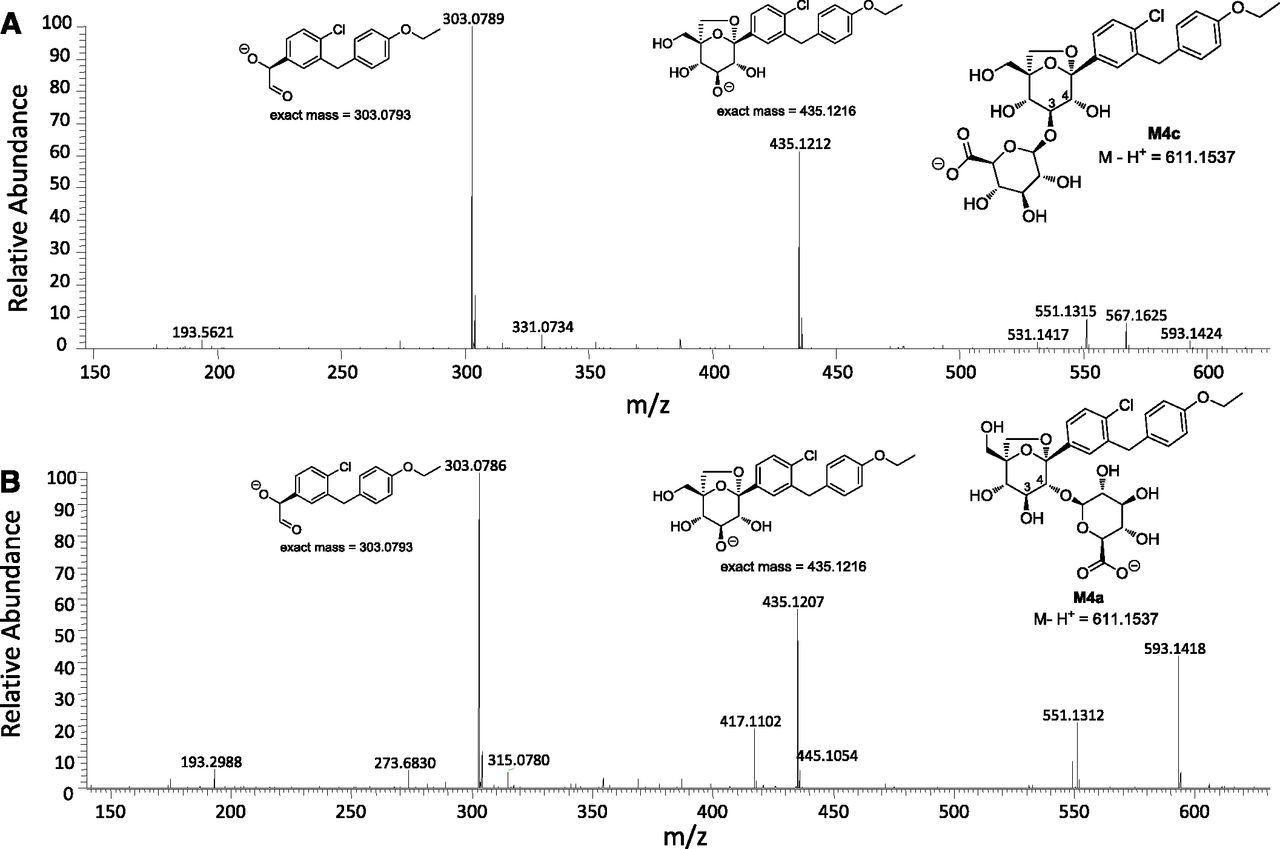
CID spectra of ertugliflozin glucuronides M4c (A) and M4a (B). MS fragmentation data were generated with the electrospray ionization source was operating in a negative-ion mode.
Metabolites M5a and M5b.
M5a and M5b, which eluted at tR of 21.3 minutes and 26.7 minutes, respectively, also were regioisomers that displayed identical ammonia adduct ions [M+NH4]+ at m/z 602. The molecular weight of M5a and M5b suggested that they were obtained from glucuronidation of M2. M5a and M5b had identical CID spectra with fragment ions at m/z 459, 409, 391, 301, 283, 207, and 107. The fragment ion at m/z 409 resulted from loss of glucuronic acid and ammonia, whereas the ion at m/z 107, which corresponds to the benzyl-phenol carbocation (Kalgutkar et al., 2011), suggested that the site of glucuronidation was not on the phenolic oxygen. Proposed structures of M5a and M5b, which are consistent with the fragmentation pattern, are shown in Table 5.
Discussion
In this work, we characterized the routes of elimination, metabolism, and excretion mass balance of [14C]-ertugliflozin after a single 25-mg oral dose to humans. A radioactivity dose of 100 μCi of [14C]-ertugliflozin was selected for this study based on radioactivity dosimetry estimates from the tissue distribution of [14C]-ertugliflozin in Long-Evans rats. Mass balance was achieved, with mean total recovery of ∼91%. Approximately, 50.2% and 40.9% of the total administered radioactive dose was recovered in urine and feces, respectively. These results are generally consistent with the mass balance and excretion pattern of [14C]-ertugliflozin in nonclinical toxicology species (Supplemental Tables 1–8). For instance, oral administration of a 25-mg/kg dose of [14C]-ertugliflozin to Sprague-Dawley rats resulted in total radioactivity recoveries of 93.8% (mean values from male and female rats) over a time period of 0–168 hours (Supplemental Table 1). The mean radioactivity recovered in urine and feces of male and female animals accounted for ∼27.5% and ∼61.9% of the administered dose, respectively (Supplemental Tables 2, 3, and 4). Likewise, oral administration of a 10-mg/kg dose of [14C]-ertugliflozin to beagle dogs resulted in total radioactivity recoveries of 93.4% (mean values from male and female dogs) over a time period of 0–144 hours (Supplemental Table 5). The majority of radioactivity was excreted in feces of male and female dogs and accounted for ∼85.5% of the dose, whereas the radioactivity recovered in urine of male and female dogs accounted for ∼8.0% of the administered dose (Supplemental Tables 6 and 7, respectively).
Of the total radioactivity excreted in human feces and urine, unchanged ertugliflozin constituted 35.3% of the dose. A total of 8 metabolites was identified in human excreta by LC-MS/MS (Table 4) with the primary biotransformation pathway involving glucuronidation of the glycoside hydroxyl groups in ertugliflozin to afford three regioisomeric metabolites M4a, M4b, and M4c (∼39.3% of the administered dose recovered in urine), of which M4c was the major regioisomer (31.7% of the dose). The structures of M4a and M4c were unambiguously identified as ertugliflozin-4-β-O-glucuronide and ertugliflozin-3-β-O-glucuronide, respectively. In vitro metabolism studies on ertugliflozin have revealed that the formation of M4a–M4c is catalyzed by UDP-glucuronosyltransferase isozyme 1A9 (Kalgutkar et al., 2011). In addition to glucuronidation, a minor metabolic fate of ertugliflozin involved oxidative metabolism by cytochrome P450 (P450) to yield monohydroxylated metabolites (M1 and M3) and des-ethyl ertugliflozin (M2), which accounted for ∼5.2% of the dose in excreta. In vitro studies in human liver microsomes indicated that both diastereomers of M1, i.e., M1a and M1b, were formed, with M1b being the dominant form. The structures of M1a/M1b and M2 were unambiguously confirmed via comparison of the HPLC tR and CID spectra of the metabolites generated from microsomes with the respective synthetic standards. Although, M2 possessed in vitro SGLT2 inhibitory potency (IC50 = 2.6 nM) comparable to ertugliflozin (IC50 = 0.87 nM) (Mascitti et al., 2011), it is likely that M2 will not contribute significantly toward SGLT2 inhibition in vivo due to its low circulating concentrations. In vitro P450 phenotyping studies (Kalgutkar et al., 2011) using a panel of recombinant human P450 isoforms have indicated that the formation of M1–M3 is catalyzed principally by CYP3A4/3A5. Glucuronidation of glycoside hydroxyl motif in M2 led to the glucuronide regioisomers M5a and M5b (∼4.6% of the dose recovered in feces). Human circulating metabolites of ertugliflozin included M1, M2, M4a–M4c, and M5a. In plasma, ertugliflozin and corresponding glucuronides M4a and M4c were the principal components, which accounted for 49.9, 12.2, and 24.1% of the circulating radioactivity, respectively, in humans. Oxidative metabolites (M1 and M2) and M5a (des-ethyl ertugliflozin glucuronide) were minor components and represented ∼2.5, 1.3, and 6.0% of the circulating radioactivity, respectively. The biotransformation pathways of ertugliflozin discerned in humans (Fig. 7) are similar to the known metabolic profile of dapagliflozin (Forxiga) in humans. Like ertugliflozin, dapagliflozin (Forxiga) is metabolized via glucuronidation on the sugar moiety to yield the pharmacologically inactive dapagliflozin-3-β-O-glucuronide (analogous to M4c) as the major human metabolite in circulation (Kasichayanula et al., 2011a,b).

Summary of ertugliflozin biotransformation pathways in humans.
The parent drug accounted for ∼33.8% of the dose in feces, suggesting that the fraction of the oral dose absorbed in humans is ∼66%. It is quite possible that oral absorption is significantly higher, as inferred from corresponding mass balance studies in bile duct-cannulated rats (Supplemental Table 9) and dogs (Supplemental Table 12), wherein unchanged ertugliflozin and glucuronide M4c accounted for ∼2.4% and 16.5% of the dose in rat bile (Supplemental Table 10) and ∼9.6% and 39.2% of the dose in dog bile (Supplemental Table 13). However, in feces of intact rats and dogs (Supplemental Tables 3 and 7, respectively), unchanged ertugliflozin and oxidative metabolites (M1 and/or M2) were the major components [male/female rat feces: ertugliflozin (24.5%) and M2 (26.7%); male/female dog feces: ertugliflozin (65.1%), M1 (7.1%), and M2 (8.7%)] with little to no detectable levels of the glucuronide M4c. Similar findings were noted in feces from bile duct-cannulated rats (Supplemental Table 11) and dogs (Supplemental Table 14). These observations imply that glucuronide M4c is susceptible to hydrolysis in the intestine of animals following biliary excretion to yield parent drug ertugliflozin, which is then eliminated in the feces. The likelihood that this scenario would extend to humans is high taking into consideration the commonality in the in vitro metabolic profile of ertugliflozin in rat, dog, and humans with glucuronidation, representing a predominant biotransformation pathway (Kalgutkar et al., 2011). Ultimately, intravenous pharmacokinetic studies in humans will lead to a better understanding of the oral absorption with ertugliflozin. The carboxylic acid derivative muraglitazar, which is a dual α/γ peroxisome proliferator-activated receptor activator and is prone to acyl glucuronidation in animals and humans (Wang et al., 2006; Zhang et al., 2007), serves as an excellent example to support our hypothesis on the oral absorption of ertugliflozin.
Comparison of ertugliflozin metabolic profile in circulation and excreta of humans and preclinical toxicology species (rats and dogs) did not reveal any human-specific metabolites; each metabolite was present in at least one of the animal species used in toxicology assessments. However, some differences were noted with respect to the relative amounts of individual circulating metabolites formed in each species. For example, in rats and dogs, ertugliflozin was most abundant and accounted for ∼90.3% (Supplemental Table 4) and 94.2% (Supplemental Table 8) of circulating radioactivity, respectively. In contrast with the human profile, the contribution of glucuronide metabolites (M4a and M4c) to circulating radioactivity was minor in rats (< 1.0%) and dogs (∼3.0%). Ertugliflozin glucuronide M4c (24.1% of the dose in systemic circulation) in humans is not anticipated to contribute to the activity of ertugliflozin in vivo. As such, the SGLT2 inhibitory potency of M4c has not been evaluated; however, existing structure-activity relationships for SGLT2 inhibition (Mascitti et al., 2011) suggest that M4c will be inactive as a SGLT2 inhibitor. This hypothesis is consistent with the lack of SGLT2 inhibition by structurally analogous glucuronide derivatives of SGLT2 inhibitors such as dapagliflozin (Forxiga) and remogliflozin (Kasichayanula et al., 2011a,b; Sigafoos et al., 2012). As an unreactive, inactive ether glucuronide, M4c does not raise any particular safety concerns (considering its disproportionate nature—humans >> animals), and in fact this type of glucuronide metabolite is specifically exempted in the Food and Drug Administration Human Metabolites in Safety Testing guidance (http://www.fda.gov/downloads/Drugs/GuidanceComplianceRegulatoryInformation/Guidances/ucm079266.pdf). In conclusion, the open-label Phase I study has shown that ertugliflozin is well absorbed and metabolized mainly via glucuronidation and to a lesser extent by oxidative metabolism. Renal excretion of unchanged ertugliflozin was deemed to be negligible. Recovery of administered radioactivity was >90% with radiolabeled material eliminated via the fecal and urinary route. All the identified human metabolites were present in animal species used for long-term safety assessments.
Acknowledgments
The authors thank Benjamin A. Thuma and Thomas Brandt for the synthesis of the glucuronide metabolites of ertugliflozin.
Authorship Contributions
Participated in research design: Miao, Nucci, Amin, Tugnait, Kalgutkar.
Conducted in vitro experiments: Miao, Sharma, Vaz.
Conducted clinical study: Nucci, Amin.
Contributed new reagents or analytic tools: Mascitti.
Performed data analysis: Miao, Amin, Nucci, Vaz, Sharma, Kalgutkar.
Wrote or contributed to the writing of the manuscript: Kalgutkar, Mascitti, Nucci, Callegari.
Footnotes
↵
 This article has supplemental material available at dmd.aspetjournals.org.

Abbreviations
- API
- atmospheric pressure ionization
- AUC
- area under the plasma concentration time profile
- CID
- collision-induced dissociation
- Clast
- predicted plasma concentration at the last quantifiable time point estimated from the log-linear regression analysis
- Cmax
- maximum plasma concentration
- CV
- coefficient of variation
- Ertugliflozin or PF-04971729
- (1S,2S,3S,4R,5S)-5-[4-chloro-3-(4-ethoxybenzyl)phenyl]-1-hydroxymethyl-6,8-dioxabicyclo[3.2.1]octane-2,3,4-triol
- HPLC
- high-performance liquid chromatography
- kel
- terminal-phase rate constant
- LC-MS/MS
- liquid chromatography tandem mass spectrometry
- LSC
- liquid scintillation counting
- P450
- cytochrome P450
- T2DM
- type 2 diabetes mellitus
- SGLT
- sodium-dependent glucose cotransporter
- t1/2
- terminal half-life
- Tmax
- time of first occurrence of Cmax
- tR
- retention time
- UDPGA
- uridine-diphosphate-glucuronic acid trisodium salt
- Received October 9, 2012.
- Accepted November 20, 2012.
- Copyright © 2013 by The American Society for Pharmacology and Experimental Therapeutics


