


Abstract
Incubational binding or the fraction of drug unbound in an in vitro incubation, fuinc, is an important parameter to predict or measure in the pursuit of accurate clearance predictions from in vitro data. Here we describe a method for fuinc determination directly in the hepatocyte intrinsic clearance (CLint) assay with emphasis on compounds that are actively transported into hepatocytes, hypothesizing that for such compounds the typical protocol of 1 million hepatocytes/ml systematically underestimates the maximum attainable unbound intracellular drug concentration. Using the transporter substrate atorvastatin as a test compound, incubations were performed and a mathematical model applied to describe metabolism, distribution, and binding at different hepatocyte concentrations. From these investigations it was evident that, since binding is more extensive intracellularly than in the medium, increased partitioning into the cellular volume, due to active uptake, increases the total amount of atorvastatin bound in the incubation. Consequently, a significant lowering of the hepatocyte concentration impacts the free drug concentration in the incubation and increases the observed rate of metabolism and therefore observed CLint (that is, when viewed from the media drug concentration). The applicability of the findings was tested for a series of 11 actively transported zwitterions for which standard rat hepatocyte metabolic CLint data (1 million cells/ml incubation) poorly predicted in vivo clearance (average fold error of 5.4). Using metabolic CLint determined at a lower hepatocyte concentration (0.125 million cells/ml) considerably improved clearance predictions (average fold error of 2.3).
Introduction
Arguably one of the most critical tasks within drug metabolism and pharmacokinetics is the accurate prediction of in vivo clearance (CL) from in vitro data. For hepatic metabolic CL, it is now widely accepted that the use of in vitro data can and should be relied on to make accurate predictions (in vitro-in vivo extrapolation) (Houston, 1994; Ito and Houston, 2005; Grime and Riley, 2006; Lavé et al., 2009; Sohlenius-Sternbeck et al., 2012). In a drug discovery setting, hepatocyte intrinsic metabolic clearance (CLint) and in vitro incubational drug binding (fuinc) are used to estimate the unbound intrinsic metabolic clearance (CLint,u), which together with plasma protein binding and estimated blood/plasma partitioning facilitates a first-line approach. Poor predictions of clearance should spark detailed investigations to ascertain the reasons. Since it is usually used as a predicted parameter from simple lipophilicity terms (Austin et al., 2005; Kilford et al., 2008), the accuracy of fuinc is in such situations of immediate interest. However, even when measured, the method for experimentally determining fuinc typically involves equilibrium dialysis analogous to plasma protein binding experiments using metabolically inactivated cells (perhaps with low or limited drug transporter functionality due to the incubation period taken to reach equilibration). Consequently, such methods do not exactly replicate the conditions under which the drug experiences the possibility to be unavailable for metabolism during the assay for metabolic intrinsic clearance.
In the work presented here we investigated an alternative method for estimating the unbound drug fraction available for metabolism through determining the metabolic CLint at several different rat hepatocyte concentrations. This direct method for fuinc determination is of particular interest with compounds for which the rate of metabolism is limited by poor passive permeability into the hepatocytes and also for compounds that are actively transported into hepatocytes. In the first case, the rate of drug metabolism is likely to be rapid but limited by the permeability into the cells, and therefore the intracellular unbound drug concentration may be considerably lower than the extracellular unbound concentration (Lu et al., 2006), whereas the second situation may be true when the active uptake increases the intracellular unbound drug concentration significantly above extracellular unbound concentration (Webborn et al., 2007).
While a method for predicting the in vivo hepatic clearance of compounds that are actively transported into hepatocytes exists (Soars et al., 2007a), there are certain circumstances when this “media loss” approach may be inappropriate or challenging to delivery of high quality data. Therefore we explored the possibility that a modified approach, assaying the metabolic CLint at hepatocyte concentrations considerably lower than the typical protocol of 1 million hepatocytes per ml, could improve the prediction of the in vivo clearance. The ideas described above were examined in experiments performed with the uptake transporter substrate atorvastatin and an AstraZeneca new chemical entity, AZ151, also a moderately lipophilic acid but devoid of any active hepatic uptake. A mathematical model, written to describe and aid understanding of the processes of active and passive uptake and the extracellular and intracellular binding and metabolism of atorvastatin and AZ151 at the different hepatocyte concentrations incubated, is also described. The mechanistic information allowed consideration of a simplified expression with the aim of clarifying and explaining the incubational binding phenomenon in situations where active hepatocyte uptake is a dominant process. Finally, the utility of the modified CLint assay in a real drug discovery project environment was investigated. All the findings are discussed with regard to in vivo hepatic clearance predictions.
Materials and Methods
Materials.
Atorvastatin (log D7.4 of 1.1; molecular weight of 559 g/mol) was obtained from Sequoia Research Products Ltd. (Oxford, UK). AZ151 ([N-(2-[(3-chloro-2-fluorobenzyl)thio]-6-[[(1R)-2-hydroxy-1-methylethyl]amino]-pyrimidin-4-yl)methanesulfonamide]; log D7.4 of 2.4; molecular weight of 421 g/mol) was obtained as a 10 mM dimethylsulfoxide (DMSO) stock solution from the AstraZeneca Compound Management Team (Mölndal, Sweden). Hepatocyte suspension medium (HSM) was prepared by supplementing William’s medium E (Sigma-Aldrich, St. Louis, MO) with 25 mM HEPES and 2 mM l-glutamine (pH 7.4).
Measurement of Log D7.4.
Partitioning of compounds (40 μM) between 1-octanol and 0.02 M phosphate buffer, pH 7.4, at 20°C was determined using a standard shake flask method (Leo et al., 1971).
Hepatocyte Preparation.
Hepatocytes were isolated from adult male Sprague-Dawley rats (250–300 g) using a procedure based on the method of Seglen (1976) as described previously (Kenny and Grime, 2006). The rats were obtained from Harlan Nederland (Horst, The Netherlands). Hepatocytes had greater than 80% viability, assessed using the trypan blue exclusion method. Hepatocytes were kept in HSM on ice until preincubation and all incubations were started within 2 hours after isolation.
In Vitro Metabolic CLint Determined at Different Hepatocyte Concentrations.
Metabolic intrinsic clearance (CLint) was assayed for as detailed previously (Soars et al., 2007a) using atorvastatin and AZ151 solutions diluted from the DMSO stock in HSM. Compound concentrations were 1 μM and incubation DMSO concentration was 0.05% v/v. However, the following modifications were made: Several cell concentrations were used (0.125, 0.1875, 0.25, 0.375, 0.5, 0.75, 1.0, 1.5, 2.0, 4.0 million cells/ml) and each CLint determination used ten time points (10, 20, 30, 45, 67, 80, 90, 100, 120, and 130 minutes). Incubations were performed in triplicate.
Determination of In Vitro Unbound Metabolic CLint (CLint,u).
In vitro CLint,u was estimated using two different methods. First, from measured CLint/fuinc at 1 million cells/ml, where fuinc was predicted from log D7.4 using the equation (1)as described previously (Austin et al., 2005). Second, CLint,u and fuinc at 1 million cells/ml were estimated from a simultaneous fit of all the CLint data from each hepatocyte concentration to the expression
 (2)adapted from Grime and Riley (2006), where [hepatocyte] represents the hepatocyte concentration.
Assessment of Atorvastatin and AZ151 Uptake into Rat Hepatocytes Using An “Oil-Spin” Procedure.
Mineral and silicon oil (Sigma-Aldrich) were mixed to give a final density of 1.015 g/ml. Beckman 0.5-ml microtubes (Fisher Scientific GTF, Stockholm, Sweden) were prepared ahead of incubation start by addition of 15 μl 4% cesium chloride (CsCl) and 140 μl oil-mixture, followed by spinning at 4,000g for 2 minutes. The AZ151 and atorvastatin DMSO stocks were diluted in HSM to 2 μM (0.1% DMSO) and the rat hepatocyte suspension (same preparation as for the hepatocytes used in the CLint assay) was diluted to 2 million cells/ml. Oil-spin experiments were based on the centrifugal filtration method (Petzinger and Fückel, 1992; Paine et al., 2008). In short, equal volumes of prewarmed compound and cell solutions were mixed to give 1 μM drug and 1.0 million cells/ml in the final incubation. The temperature was controlled using a water bath set to 50 RPM (linear shaking) at 37°C. At selected time points (15, 30, 45 second, 1, 2, 3, 5, 15, 30, 60, 90, and 120 minutes) a 100-μl aliquot was removed from each incubation, dispensed into a microtube, and immediately centrifuged at 7,000g for 15 seconds to separate cells from media using a benchtop Eppendorf MiniSpin centrifuge. Medium samples were directly taken from the supernatant above the oil layer, after which the tubes containing the cell pellets were placed on dry ice. Cell samples were prepared for analysis by cutting frozen tube tips containing the cell pellet below the oil/CsCl interface into a 96-well plate. Methanol (200 μl) containing a volume marker was added to each well and the plate was mixed at room temperature using a plate shaker for 1 hour. After 100 μl deionized water had been added to each well, the plate was centrifuged at 4,000g at 4°C for 20 minutes. The supernatants were, together with samples from the medium fraction (diluted to attain the same methanol concentration), analyzed by liquid chromatography-tandem mass spectrometry and the drug concentration determined from appropriate standard curves. Incubations were run in duplicates with reference incubations performed at 4°C.
Liquid Chromatography-Tandem Mass Spectrometry Analysis.
Mass spectrometry was performed on an Acquity TQD triple quadrupole mass spectrometer (Waters, Milford, MA) using multiple reaction monitoring in negative ion mode with chromatographic separation being performed using an Acquity ultra-performance liquid chromatography sample and solvent manager (Waters). Chromatographic separation was achieved with an Acquity ultra-performance liquid chromatography BEH C18 1.7 μm 2.1 × 30-mm column (Waters) using 10 μl sample. The mobile phase consisted of water with 0.2% (v/v) formic acid (A) and acetonitrile containing 0.2% (v/v) formic acid (B). The gradient was as follows: 96% A (0–0.2 minutes), 96 to 5% A (0.2–1.0 minutes), 4% A (1–1.2 minutes). The flow rate was 1.0 ml/min and the column temperature was 40°C. Instrument control and data processing were performed using MassLynx 4.1 software, including QuanOptimize and QuanLynx (Waters).
Mechanistic Mathematical Model for Elucidating the Underlying Processes of Drug Distribution, Binding, and Metabolism in the In Vitro Incubations.
The sets of kinetic data were analyzed using a mechanistic model, comprising a medium, a cellular, and an outer membrane compartment (Fig. 1), similar to the approach applied by Paine et al. (2008). In the model, transport between the medium and the cellular compartments is described by unsaturable active uptake (CLint,up) and bidirectional passive diffusion (CLint,diff). While active biliary excretion can be a primary mechanism of elimination in vivo, it is unclear to what extent the relevant drug efflux transporter functionality is retained shortly after hepatocyte isolation (Bow et al., 2008; Li et al., 2008). Active efflux as well as transport associated with bidirectionality of uptake transporters, were therefore assumed to be limited in the present analysis. Elimination from the cellular compartment is described by the parameter CLint,met.

Schematic representation of the proposed mechanistic model comprising medium, cellular, and outer membrane compartments. Adjustable parameters define active uptake (CLint,up), bidirectional diffusion clearance (CLint,diff), metabolic intrinsic clearance (CLint,met), as well as intracellular (fucell) and membrane binding (Kmed). The cellular fractions collected experimentally include the cellular and the membrane model compartments (shaded area).
Extracellular binding was assumed to be dominated by drug associating with the outer surface of the cellular membrane, described as a rapid equilibrium established between unbound drug in the medium (Dmed,u) and drug in the membrane compartment (Dmem): (3)where Kmed is the equilibrium constant and [M] represents the concentration of membrane in units of 1 million cells/ml. Intracellular binding was instead defined as a rapid equilibrium established between unbound (Dcell,u) and bound (Dcell,b) drug within the cellular compartment:
 (4)where Kcell is the equilibrium constant. Since Kcell is independent of the hepatocyte concentration it may alternatively be described in terms of the intracellular fraction unbound (fucell). Equations 5 and 6 define the change of the unbound drug concentration in the cell (of volume Vcell) and the medium (of volume Vmed) compartments, respectively, with time when active efflux is assumed to be limited:
 (5)
(5) (6)
(6)Taking into account extracellular (eq. 3) and intracellular (eq. 4) binding, numerical integration of eqs. 5 and 6 give the concentration profiles of the cellular and medium compartment, respectively. Estimates of the adjustable clearance parameters CLint,up, CLint,diff, and CLint,met as well as binding descriptors Kmed and fucell were obtained by simultaneous fit of the simulated total hepatocyte (cell + membrane compartments) amount to experimentally obtained cell fraction data at 37 and 4°C using the nonlinear least squares solver of the commercial software package Matlab 7.12 (The MathWorks Inc., Natick, MA). In the analysis only 4°C data reflecting approximate steady-state conditions (samples taken 120 minutes after incubation start) were used. CLint,up and CLint,met, processes that are mediated by specific transporter or enzymatic activity, were furthermore considered inactivated at 4°C. Concentration profiles were calculated based on the assumption of a cellular volume Vcell of 4.0 μl/million hepatocytes (Reinoso et al., 2001). The standard errors were calculated from the variances obtained from the Jacobian matrix evaluated at the point estimates of the parameters (Bonate, 2005).
At pseudo-steady-state conditions, when d[D]cell,u/dt = 0, the unbound cell-to-media concentration ratio (Kp,uu) is described by the ratio of clearances associated with drug entering and leaving the cellular compartment (Iwatsubo et al., 1999; Shitara and Sugiyama, 2006). With the current parameterization, Kp,uu is then calculated from
 (7)
(7)Approximate Description of fuinc as a Function of Hepatocyte Concentration upon Variation of the Unbound Cell-to-Media Concentration Ratio.
The following section outlines the derivation of an approximate description of how fuinc (CLint/CLint,u) is expected to vary, as the hepatocyte concentration and/or the unbound cell-to-media concentration ratio is changed, solely from consideration of the two separate binding equilibriums established in the media and inside the cell (eqs. 3 and 4, respectively). Equation 7 defines Kp,uu as the ratio of unbound drug in the cell to that of the medium (of volume Vcell and Vmed, respectively). The unbound concentration of drug in the media ([D]med,u) and cell ([D]cell,u) compartments can then be expressed in terms of the total unbound amount Du in the incubation:
 (8)
(8) (9)
(9)Equation 9 is obtained by rearrangement of eq. 8 after division by [D]med,u and use of eq. 7 for incorporation of Kp,uu. Equation 9 can, at moderate Kp,uu levels, be approximated by eq. 10 since the cellular volume Vcell << Vmed. Equation 11 is the corresponding expression for [D]cell,u.
 (10)
(10) (11)
(11)The unbound fraction in the incubation (fuinc = Du/Dtot), where Dtot is the total amount of drug in the incubation, is related to the fraction bound in the medium (fbmed) and the cells (fbcell): (12)in which eqs. 3 and 4 are used to incorporate binding constants Kmed and Kcell, respectively. In the final substitution, the unbound concentrations of drug in the media and the cell are replaced using eqs. 10 and 11, respectively. Rearrangement gives a final expression for the fraction unbound in the incubation
 (13)
(13)Equation 13 describes how the nonspecific binding of drug in the incubation is expected to change as [M] and Vcell/Vmed changes. Kp,uu is the unbound cell-to-media concentration ratio, which rapid metabolism or active uptake can drive considerably below or above 1. In either scenario there is a clear deviation from normal partitioning relationships (Kp,uu = 1) at which fuinc may usually be expected to be adequately described from log D7.4. As fuinc relates the observed intrinsic metabolic clearance to the unbound metabolic clearance (CLint,u = CLint/fuinc) and since both (Kmed × [M]) and are approximately proportional to the hepatocyte concentration, the ratio of the observed and unbound metabolic clearance can be approximated to (14)where Kcell is expressed using fucell (eq. 4), RV denotes the cell-to-incubation volume ratio (4.0/1000 ml/million cells) and [hepatocyte] is the hepatocyte concentration divided by 1 million cells/ml. The three constants included in the final expression can all be estimated from a fit of the mechanistic model (eqs. 3–6): Kmed and fucell constitute model parameters, whereas Kp,uu can be indirectly assessed from estimated values of CLint,up, CLint,diff and CLint,met using eq. 7.
Predictions of In Vivo Hepatic Clearance.
In vivo clearance predictions were made using measured rat plasma protein binding and blood-to-plasma data (as described previously, Gardiner and Paine, 2011). The predictions used fuinc predicted from measured log D7.4 (eq. 1) or estimated using the multiple hepatocyte concentration metabolic CLint data (eq. 2). All this data were used to make the clearance predictions, essentially as described previously (Grime and Riley, 2006; Sohlenius-Sternbeck et al., 2012). Rat plasma clearance was determined after the administration of an intravenous dose (1 mg/kg) to male Sprague-Dawley rats, as described previously (Weaver and Riley, 2006). In vivo (observed) unbound CLint (CLint,u in vivo) was calculated by rearrangement of the Well Stirred Liver Model, as described previously (Soars et al., 2007a). Predicted in vivo unbound CLint values were calculated in the same way, using the predicted in vivo hepatic CL and in vivo (observed)/predicted unbound CLint ratios.
A Project Example to Determine the Utility of the Revised Metabolic Clint Method.
For a chemical series of zwitterions (molecular weights ranging from 383 to 506 g/mol, log D7.4 values ranging from 0.7 to 2.6) metabolic CLint values were determined using incubations containing 1 and 0.125 million rat hepatocytes/ml, as described above. Clearance predictions and in vivo rat plasma clearance values were also performed as above.
Results
In Vitro Metabolic Clint Determined at Different Hepatocyte Concentrations.
AZ151 and atorvastatin were incubated with rat hepatocytes at eight cell concentrations in the interval 0.125–4.0 million cells/ml to determine the CLint values. The measured values increased with decreasing cell concentration, but despite the similar physicochemical properties of the two compounds, the rate of increase of CLint with respect to cell concentration was considerably larger for atorvastatin (Fig. 2).

Effect of hepatocyte concentration on observed metabolic intrinsic clearance (CLint) obtained from rat hepatocyte incubations with AZ151 (A) and atorvastatin (B). The dashed line represents the dependence expected using the CLint obtained at 1 million cells/ml and fuinc predicted from log D7.4 (eq. 1). The solid line represents the dependence based on the best fit of the observed CLint data to eq. 2. The resulting unbound metabolic clearance CLint,u from each of the two approaches are given from the y-axis intercept.
Determination of In Vitro Unbound CLint (CLint,u).
Unbound CLint (CLint,u) values for both compounds were estimated from CLint/fuinc, where fuinc was predicted from log D7.4 using eq. 1. Additionally, CLint,u was estimated from a simultaneous fit to eq. 2 of all the CLint data from each hepatocyte concentration incubation. Both methods for estimating CLint,u are detailed in Materials and Methods. Estimates obtained for CLint,u and fuinc are given in Table 1, with resulting simulations in Fig. 2.
Assessment of Atorvastatin and AZ151 Uptake into Rat Hepatocytes Using an “Oil-Spin” Procedure.
Incubations with rat hepatocytes were performed in duplicate at 37°C at 1 million cells/ml, and post sampling the cellular fractions were separated from the media. To resolve passive events expected to be less dependent on temperature (diffusion and nonspecific binding) from those mediated by specific transporter or enzymatic activity, reference incubations were performed at 4°C. Obtained cell fraction kinetic data for AZ151 and atorvastatin are shown in Fig. 3, A and C, respectively (medium fraction data in Supplemental Fig. 1).
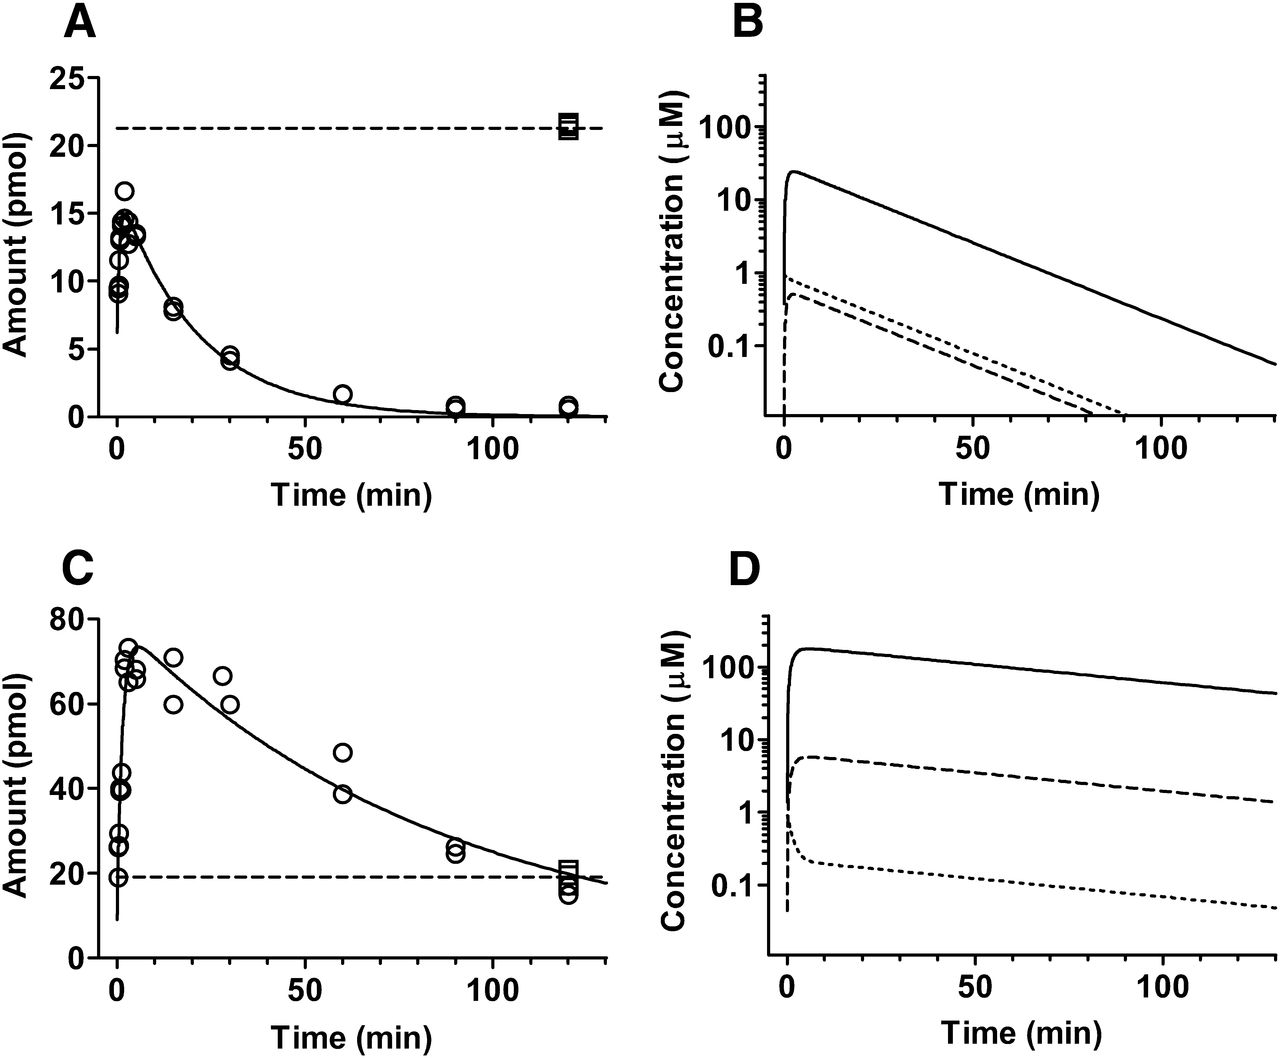
Cellular amount (intracellular + membrane bound) of AZ151 (A) and atorvastatin (C) in the 100-μl samples collected from 1 μM incubations at 1.0 million cells/ml. Experimentally observed values at 4 and 37°C are squares and circles, respectively, and simulated, using the mathematical mechanistic model, is the solid line (37°C) or dashed line (4°C at steady state). Simulated profiles for AZ151 (B) and atorvastatin (D) total (solid) and unbound (dashed) intracellular concentrations and incubation medium concentration (dotted) at 1.0 million cells/ml.
Mechanistic Mathematical Model for Elucidating the Underlying Processes of Drug Distribution, Binding, and Metabolism in the In Vitro Incubations.
To elucidate the mechanism underlying the in vitro turnover of the two test compounds, the cellular concentration profiles obtained from the oil-spin experiments were analyzed by a mechanistic mathematical model (Fig. 1). Simultaneous fit to 37 and 4°C cell data gave estimates of the five model descriptors: active uptake (CLint,up), bidirectional diffusion (CLint,diff), metabolism (CLint,met), membrane binding (Kmed), and intracellular binding (fucell). In contrast to the atorvastatin time-course data, the AZ151 data were well described without contribution of an active component to the uptake (CLint,up = 0). Model best-fit estimates are summarized in Table 2, with simulations included in Fig. 3, A and C (the simulated amount, based on the fit to cell data, in the medium compartment is included in Supplemental Fig. 1).
Model best-fit parameter estimates obtained from fit to “oil-spin” data
Active uptake (CLint,up), bidirectional diffusion clearance (CLint,diff), metabolic intrinsic clearance (CLint,met), membrane binding (Kmed) and intracellular binding (fucell). Estimate S.E. given in parenthesis. The unbound cell-to-media concentration ratio Kp,uu was calculated using eq. 7.
Figure 3, B and D, shows the mechanistic model’s simulated drug concentration-time profile in the cell, and the media compartments when the cell concentration was 1 million cells/ml. Over the course of the simulation, AZ151 and atorvastatin distribute quite differently between the two fractions. The unbound cell-to-media concentration ratio attained at pseudo-steady-state conditions (Kp,uu) can be obtained by comparing the concentrations in the two compartments graphically or alternatively be calculated from the clearance parameters using eq. 7. For AZ151 the calculated ratio was 0.7, whereas for atorvastatin the ratio was 27, implying that the maximum unbound atorvastatin concentration reached inside the hepatocytes is much greater than that of AZ151. Simulations of unbound intracellular concentration were performed in addition at selected hepatocyte concentrations between 0.125 and 4 million cells/ml (Fig. 4). For AZ151 the maximum unbound intracellular concentration increases 1.25 times as the hepatocyte concentration is lowered from 1.0 to 0.125 million cells/ml, whereas for atorvastatin the corresponding change of hepatocyte concentration results in 3.6 times higher unbound drug concentration.

Influence of hepatocyte concentration on the unbound intracellular concentration of AZ151 (A) and atorvastatin (B) obtained using the mechanistic model. Profiles are simulated at (top-to-bottom) 0.125, 0.3, 0.5, 1.0 (bold line), 2.0, and 4.0 million cells/ml.
Approximate Description of fuinc as a Function of Hepatocyte Concentration Upon Variation of the Unbound Cell-to-Media Concentration Ratio.
From consideration of drug binding in the media and inside the hepatocytes, eq. 14 was derived to understand how fuinc (CLint/CLint,u) changes as the hepatocyte concentration is varied. The relationship also accounts for situations where the unbound cell-to-media concentration ratio (Kp,uu) deviates significantly from 1, here in particular observed for atorvastatin. In fitting of the mechanistic model, descriptors of binding, Kmed and fucell, in eq. 14, were estimated (Table 2). By insertion of the values associated with AZ151 and atorvastatin together with their estimated Kp,uu ratios (0.7 and 27, respectively) into the equation, the CLint/CLint,u profiles shown in Fig. 5 were calculated. The distinct CLint/CLint,u profiles experimentally observed for AZ151 and atorvastatin were both well described by the derived expression.

Comparison of experimentally assessed and calculated fuinc = CLint/CLint,u profiles for AZ151 (A) and atorvastatin (B). The dependency determined from observed CLint/CLint,u data (circles) is the solid line and the dashed line represents the profile calculated from eq. 14.
Predictions of Rat In Vivo Hepatic Clearance of Atorvastatin and a Project Example of the Application of the Revised Metabolic Clint Method.
Atorvastatin observed plasma clearance in vivo in the rat was 46 ml/min per kg (and therefore calculated blood clearance was 33 ml/min per kg, using the measured blood-to-plasma ratio of 1.4). The in vitro measured value for plasma protein binding was 95.8%. Applying eq. 1 for estimating fuinc, the predicted blood clearance was 4.5 ml/min per kg, using the “regression corrected” approach for predicting clearance (Grime and Riley, 2006; Soars et al., 2007a). The in vivo (observed)/predicted unbound CLint ratio was 12.4. Using CLint,u derived by fitting eq. 2 to CLint data from several hepatocyte concentrations the predicted blood clearance was 11 ml/min per kg and the in vivo (observed)/predicted unbound CLint ratio was 4.6.
Initial predictions of rat clearance from standard rat hepatocyte in vitro metabolic CLint data (1 million hepatocytes/ml) and fuinc predicted from log D7.4 for a novel series of zwitterions were not acceptable, since the in vivo (observed)/predicted unbound CLint ratio ranged from 2 to 13 and the average fold error (afe) for the predictions was 5.4 (Fig. 6). Metabolic CLint was subsequently determined for the compounds at the lower cell concentration of 0.125 million hepatocytes/ml. The CLint data from both hepatocyte concentrations were used to estimate CLint,u from fit to eq. 2, values that thereafter were used to predict in vivo rat CL. This resulted in a much improved in vitro-in vivo correlation (Fig. 6), with the in vivo (observed)/predicted unbound CLint ratio ranging from 1 to 3.8 and an afe of 2.3.

Prediction of CLint,u in vivo for 11 AstraZeneca new chemical entities using CLint,u from 1) standard rat hepatocyte metabolic CLint at 1.0 million cells/ml and fuinc determined from log D7.4 (open circles) and 2) metabolic CLint at 1.0 and 0.125 million cells/ml using eq. 2 (filled circles). The dashed line represents the linear regression analysis of data obtained from method 1: y = 1.011x + 0.639, R2 = 0.597, afe = 5.4; and the dotted line the analysis of data obtained from method 2: y = 1.083x + 0.077, R2 = 0.689, afe = 2.3. The solid line represents the line of unity.
Discussion
Over the last twenty years, in vitro drug metabolism and kinetic data have been used with increasing refinement to predict in vivo clearance such that there is common belief that in vitro data are highly predictive of clinically relevant situations, provided that the underlying assumptions are understood (Soars et al., 2007b). The importance and utility of incorporating drug binding terms has been previously reviewed in detail (Grime and Riley, 2006), and detailed in vitro methods to facilitate the accurate prediction of hepatic clearance and drug-drug interactions for drugs that are actively transported into hepatocytes have been published (Soars et al., 2007a; Grime et al., 2008; Paine et al., 2008; Bi et al., 2012; Jones et al., 2012). Nevertheless, it continues to be worthwhile for drug metabolism and pharmacokinetics scientists to critique experimental conditions in the search for further refinement and mechanistic understanding (Hallifax and Houston, 2012).
In this present work we considered the concept that a commonly used in vitro hepatocyte incubation protocol for determining unbound metabolic intrinsic clearance [CLint/fuinc either predicted from log D7.4 (eq. 1) or measured using equilibrium dialysis] may be inappropriately employed for situations where active uptake is an important factor in drug disposition. We considered whether an alternative approach for estimating fuinc directly in the CLint assay through assessing the impact of changing hepatocyte concentration on CLint (eq. 2) may be more generally applicable. To establish if this is the case, experiments were performed with atorvastatin at several hepatocyte concentrations and a mathematical model was written to describe the findings. As a control we chose an AstraZeneca new chemical entity (AZ151) since it was also a moderately lipophilic acid, but critically and in contrast to atorvastatin, AZ151 is not subject to active hepatic transport.
For AZ151, the prediction of fuinc from log D7.4 (eq. 1) matched the fuinc estimated from a simultaneous fit of CLint data at several hepatocyte concentrations (eq. 2) with values being 0.72 and 0.78, respectively. Accordingly CLint,u values estimated using both methods also agree (38 μl/min per million cells observed and 40 μl/min per million cells, Fig. 2). For atorvastatin, the increase of CLint had a considerably stronger dependency on the decreasing cell concentration and as a result the fuinc calculated using eq. 2 (0.33) was much lower than the log D7.4 calculated fuinc value of 0.90. This results in a considerable underprediction of CLint,u for atorvastatin when using the log D7.4 prediction method (25 compared with 68 μl/min per million cells).
The mechanism underlying this observed discrepancy was explored through a separate study undertaken to quantitatively characterize how distribution, binding, and metabolism of the two test compounds differed in the hepatocyte incubation. Experiments were performed in which the concentration of atorvastatin and AZ151 in the cell and media fractions during a 120-minute incubation was assessed by rapidly separating the two matrices using the “oil-spin” procedure described in the Materials and Methods section. The obtained kinetic cell data sets were analyzed using a compartmental model. Several reports have recently described the application of physiologically inspired models for the mechanistic description of hepatocyte uptake kinetics (Poirier et al., 2008; Watanabe et al., 2009; Yabe et al., 2011; Ménochet et al., 2012a,b). We here used an unsaturable model, based on the model of Paine et al. (2008). Best-fit simulated profiles match well over the full 120-minute incubation to cell (Fig. 3, A and C) and medium (Supplemental Fig. 1) data. Importantly, AZ151 data are described without contribution of active uptake (CLint,up = 0). This is contrary to atorvastatin, for which active uptake accounts for 97% of the total uptake (CLint,up plus CLint,diff), in agreement with literature data (Paine et al., 2008). The distribution of unbound drug between the cell and the medium (Fig. 3, B and D) was calculated from obtained model clearances (eq. 7). For AZ151 and atorvastatin, obtained values were slightly below (Kp,uu = 0.7) and substantially higher (Kp,uu = 27), respectively, than the expected value of 1 in absence of active uptake and metabolism.
A general description of fuinc (CLint/CLint,u) at the conditions of the in vitro incubation may take into account the two separate binding equilibriums established in the medium and inside the hepatocyte. A simplified expression was formulated to describe the influence of hepatocyte concentration ([hepatocyte]) on CLint/CLint,u also in situations when Kp,uu deviates from 1 (eq. 14). The expression is helpful for conceptualizing the effect of active uptake on the observed intrinsic metabolic clearance as the hepatocyte concentration changes. Insertion of the mechanistic model binding descriptors Kmed, fucell, and the estimated Kp,uu ratio into eq. 14 gave the CLint/CLint,u profiles in Fig. 5, A and B. The decrease in CLint/CLint,u with increasing hepatocyte concentration experimentally observed for AZ151 and atorvastatin are essentially reproduced by the expression using the model derived parameters, validating the approach. The figure shows that the deviating fuinc profile of actively transported drugs can be understood by separating the total binding into a media and cellular part and accounting for the distribution of drug between them. Since drug is more extensively bound intracellularly than in the media, increased partitioning into the cellular volume due to active uptake will increase the total amount of drug bound. As a direct consequence, a variation of the hepatocyte concentration will have a stronger impact on the unbound amount of drug in the incubation (Figs. 4 and 5). In this case, the intracellular matrix acts as a sink sequestering the major part of drug under the standard conditions of 1 million cells/ml. Of course, following the greater rise in the intracellular unbound concentration upon decreasing the hepatocyte concentration below 1 million cells/ml, the greater is the increase in observed rate of metabolism (and therefore CLint when viewed from the media drug concentration) for the actively transported drug.
Using CLint values measured at several hepatocyte concentrations to obtain an accurate estimate of in vitro metabolic CLint,u (eq. 2; Table 1) considerably improved the prediction of the in vivo clearance for atorvastatin, verified by the fact that the in vivo (observed)/predicted unbound CLint ratio decreased from 12.4 to 4.6 using the standard CLint assay. Of course, a ratio of unity indicates a perfect prediction, but it is worth noting that following intravenous administration, a 50% recovery of unchanged atorvastatin in rat bile has been reported (Watanabe et al., 2010) and therefore the in vivo/in vitro metabolic CLint discrepancy calculated here could in fact be considerably less than 4.6. Additionally, in the same report, the analysis indicated a 1.8-fold higher in vivo uptake clearance for atorvastatin compared with in vitro, indicating compromised hepatic uptake after cell isolation, which may be attributed to decrease in organic anion-transporting polypeptide expression after isolation (Kimoto et al., 2012). This is supported by close consideration of the dataset in Soars et al. (2007a) in which 36 compounds thought to be substrates for hepatic uptake transporters gave a rat observed/predicted in vivo CLint,u afe of 3-fold. Additonally, human in vivo CLint,u predictions for atorvastatin, bosentan, and montelukast showed an offset of 2- to 3-fold. Taking these two factors (atorvastatin biliary clearance and possible lower in vitro than in vivo organic anion transporting polypeptide activity) into account, it can be claimed that the methods described may improve in vivo metabolic clearance predictions.
For the series of 11 zwitterionic new chemical entities described in this article, standard rat hepatocyte metabolic CLint data at 1.0 million cells/ml did not afford good predictions of in vivo clearance when the fuinc was predicted from eq. 1 (afe of 5.4, Fig. 6). Further experiments performed to investigate uptake into the rat hepatocytes indicated that all of the zwitterions assayed were subject to active uptake (using “oil spin” experiments, data not shown). On the basis of the findings presented, CLint was also measured at the lower hepatocyte concentration of 0.125 million cells/ml, which allowed CLint,u to be determined from fit of eq. 2. (Measurements of CLint at two hepatocyte concentrations are required to estimate CLint,u, while data from additional concentrations allows for assessment of the quality of the fit). Use of the estimated CLint,u considerably improved the prediction (afe = 2.3, Fig. 6). This slight underprediction is consistent with the discussion point above, that expression of involved drug transporters is downregulated in vitro compared with the liver tissue (Kimoto et al., 2012).
This work provides a practical in vitro method and a mechanistic background to facilitate the accurate prediction of hepatic metabolic clearance for drugs that are actively transported into the liver. While the method is clearly not suitable for drugs that are extremely metabolically stable, the approach, based on determining CLint at a hepatocyte concentration considerably lower than the typical concentration of 1 million cells/ml, complements the “media loss” assay [detailed in the publication by Soars et al. (2007a)], which essentially probes the distribution into the hepatocytes. Additionally the method described is more applicable to automated assay design and in comparison with the “media loss” assay allows a greater mechanistic understanding of some of the processes that a drug encounters and therefore facilitates the accurate prediction of hepatic clearance and effective design of drugs with optimal pharmacokinetic characteristics.
Acknowledgments
The authors thank François Guillou for careful review of, and suggestions on, this manuscript.
Authorship Contributions
Participated in research design: Nordell, Svanberg, Bird, Grime.
Conducted experiments: Nordell, Svanberg, Bird.
Performed data analysis: Nordell, Svanberg, Grime.
Wrote or contributed to the writing of the manuscript: Nordell, Grime.
Footnotes
↵
 This article has supplemental material available at dmd.aspetjournals.org.

Abbreviations
- afe
- average fold error
- AZ151
- N-(2-[(3-chloro-2-fluorobenzyl)thio]-6-[[(1R)-2-hydroxy-1-methylethyl]amino]-pyrimidin-4-yl)methanesulfonamide
- CLint
- intrinsic clearance from hepatocyte incubation
- CLint,diff
- intrinsic diffusion clearance in compartmental model
- CLint,met
- intrinsic metabolic clearance in compartmental model
- CLint,u
- unbound intrinsic clearance from hepatocyte incubation
- CLint,up
- intrinsic active uptake clearance in compartmental model
- Dcell,b
- amount of bound drug in the cellular compartment
- Dcell,u
- amount of unbound drug in the cellular compartment
- Dmed,u
- amount of unbound drug in the medium compartment
- Dmem
- amount of drug in the outer membrane compartment
- DMSO
- dimethylsulfoxide
- Dtot
- total amount of drug in the incubation
- Du
- unbound drug in the incubation
- fucell
- intracellular fraction unbound
- fuinc
- fraction unbound in the incubation
- HSM
- hepatocyte suspension medium
- Kcell
- intracellular compartment binding constant
- Kmed
- outer membrane binding constant
- Kp,uu
- unbound cell-to-media concentration ratio
- Vcell
- volume of the cellular compartment
- Vmed
- volume of the medium compartment
- Received November 28, 2012.
- Accepted January 30, 2013.
- Copyright © 2013 by The American Society for Pharmacology and Experimental Therapeutics


