


Abstract
Despite the fact that much progress has been made recently in the development of targeted covalent inhibitors (TCIs), their pharmacokinetics (PK) have not been well characterized in the light of extrahepatic clearance (CLextH) by glutathione (GSH)/glutathione S-transferase (GST)-dependent conjugation attributable to the unique electrophilic structure (e.g., acrylamide moiety) of TCI compounds. In the present study, CLextH values were examined in rat, dog, and monkey to predict the contribution of CLextH to the PK of the TCIs afatinib, ibrutinib, and neratinib in humans. Afatinib and neratinib both underwent extensive conjugation with GSH in buffer and cytosol fractions of liver and kidney, whereas ibrutinib showed much lower reactivity/susceptibility to GSH/GST-dependent conjugation. The CLextH in each species was calculated from the difference between observed total body clearance and predicted hepatic clearance (CLH) in cryopreserved hepatocytes suspended in 100% serum of the corresponding species. The power-based simple allometry relating the CLextH for the unbound compound to animal body weight was applicable across species for afatinib and neratinib (R2 ≥ 0.9) but not for ibrutinib (R2 = 0.04). The predicted AUC after oral administration of afatinib and neratinib agreed reasonably closely with reported values in phase I dose-escalation studies. Comparisons of CLextH and CLH predicted that CLextH largely determined the PK of afatinib (>90% as a proportion of total body clearance) and neratinib (∼34%) in humans. The present method can serve as one of the tools for the optimization of PK in humans at the discovery stage for the development of TCI candidates.
Introduction
Targeted covalent inhibitors (TCIs), which typically possess an α,β-unsaturated carbonyl moiety (i.e., a Michael acceptor) such as an acrylamide group, achieve exceptionally high potency in targeted inhibition by forming a covalent bond with a cysteine residue in the active site of the target enzyme or receptor after the reversible interaction of a noncovalent scaffold with the active site (Garuti et al., 2011; Singh et al., 2011; Carmi et al., 2012; Kalgutkar and Dalvie, 2012). In recent years, many TCI candidates have proceeded to clinical studies, and afatinib and ibrutinib were approved by the U.S. Food and Drug Administration for the treatment of non-small-cell lung cancer with an exon 19 deletion or exon 21 substitution (L858R) mutation (Keating, 2014) and mantle cell lymphoma (Cameron and Sanford, 2014), respectively.
TCIs structurally carry a potential liability for toxicity caused by covalent protein modifications (Baillie, 2006; Liebler, 2008); therefore, structural bioinformatics with computer-aided drug design plays a critical role in the design of highly selective TCI candidates (Singh et al., 2011; Carmi et al., 2012). The sequential mechanism involved in the mode of action allows exceptionally high selectivity, which can be achieved by carefully designing low intrinsic reactivity of the electrophilic acrylamide moiety such that covalent binding only proceeds when the TCI is held in a highly favorable position/orientation by the preceding reversible (noncovalent) interaction.
Despite efforts to minimize off-target covalent modification by reducing the reactivity of the acrylamide moiety, the structure inherently retains an electrophilic reactivity to the cysteine residue of glutathione (GSH) (Bohme et al., 2009; Schwobel et al., 2010), which exists abundantly in cells at a concentration 0.5–10 mM (Watanabe et al., 2003) and scavenges reactive electrophiles by forming GSH adducts. In addition to nonenzymatic conjugation with GSH, glutathione S-transferase (GST) isoforms, which are expressed ubiquitously throughout the body (Pacifici et al., 1988; de Waziers et al., 1990; Awasthi et al., 1994; Rowe et al., 1997), accelerate GSH conjugation by lowering the pKa of the sulfhydryl group of GSH from 9.0 to 6.2–6.7 and increasing the cytosolic concentration of deprotonated GSH (Armstrong, 1997; Fabrini et al., 2011). Therefore, both nonenzymatic and GST-dependent GSH conjugation of the acrylamide moiety in extrahepatic organs as well as in the liver is likely to play a significant role in the pharmacokinetics (PK) of TCI compounds.
The present study examined the extrahepatic clearance (CLextH) of TCI compounds in preclinical species (rat, dog, and monkey) and predicted the contribution of CLextH to PK in humans by taking the extrapolated CLextH into consideration. We used afatinib [a tyrosine kinase inhibitor of epidermal growth factor receptor (EGFR)], ibrutinib (a Bruton’s tyrosine kinase inhibitor), and neratinib [a tyrosine kinase inhibitor of EGFR under clinical development for the treatment of breast cancer in HER2-amplified patients (Gandhi et al., 2014)] as model TCI compounds (Fig. 1). The CLextH values in preclinical species were calculated for each TCI compound from the difference between the observed total body clearance (CLtot,obs) and predicted hepatic clearance (CLH) from metabolic stability in cryopreserved hepatocytes suspended in 100% serum of the corresponding species (Shibata et al., 2000, 2002, 2014). The CLextH thus obtained in each species was extrapolated to the value in humans by allometric scaling where applicable, and the extrapolated CLextH was combined with the predicted CLH from human hepatocytes to calculate the predicted total body clearance (CLtot,pred) in humans.

Model targeted covalent inhibitors afatinib, ibrutinib, and neratinib.
The predicted area under the plasma concentration–time curve extrapolated to infinity (AUC0–∞) after oral administrations of afatinib and neratinib agreed reasonably closely with reported values in phase I dose-escalation studies. In contrast, ibrutinib had much lower reactivity/susceptibility to GSH/GST-dependent conjugation than afatinib and neratinib, and simple allometric scaling was not applicable to the extrapolation of CLextH across preclinical species. Our study suggests that the contribution of CLextH by GSH conjugation to the total body clearance depends on the reactivity and susceptibility of the electrophilic structure of TCI compound to GSH/GST-dependent conjugation and that their ubiquitous distribution allows allometric scaling of CLextH across species, including in humans.
Materials and Methods
Chemicals.
Afatinib and neratinib were obtained from Selleckchem (Houston, TX) and LC Laboratories (Woburn, MA), respectively. Ibrutinib was synthesized at Tsukuba Research Center by Taiho Pharmaceutical Co., Ltd. (Ibaraki, Japan). Propranolol hydrochloride and GSH were purchased from Sigma-Aldrich Co. (St. Louis, MO). Hydroxypropyl methyl cellulose (HPMC) TC-5 was purchased from Shin-Etsu Chemical Co. Ltd. (Tokyo, Japan). All other reagents were of the highest grade available.
Cryopreserved Hepatocytes.
Cryopreserved hepatocytes of male Sprague-Dawley rats (lot QJL) and male beagle dogs (lot Db245) were purchased from Celsis In Vitro Technologies (Baltimore, MD) and Life Technologies Japan Ltd (Tokyo, Japan), respectively. Cryopreserved hepatocytes of male cynomolgus monkey (lot HEP186016) and human (lots HH278 and HH281) were obtained from Biopredic International (Rennes, France).
Cytosol Fractions of Liver and Kidney in Human.
Cytosol fractions of liver and kidney from human were purchased from XenoTech (Lenexa, KS) and Celsis In Vitro Technologies (Baltimore, MD), respectively.
Preparation of Serum.
Rat blood was collected via the abdominal aorta under ether anesthesia. Dog and monkey blood were collected via cephalic veins. After stabilization for 3 hours at room temperature to coagulate the blood, samples were centrifuged at 1,800g for 20 minutes at 4°C. Serum was collected as the clear supernatant and stored at −80°C until use. Human serum was purchased from Biopredic International.
GSH Conjugation in Buffer (pH 7.4) and Cytosol Fractions of Human Liver and Kidney.
An aliquot of stock solution of GSH (100 mM, adjusted to pH 7.0 with 0.1 N NaOH) was added to potassium phosphate buffer (pH 7.4) to prepare an incubation solution containing 2 mM GSH. An aliquot (3 µl) of stock compound solution (2 mM) in 100% acetonitrile (afatinib and neratinib) or 100% methanol (ibrutinib) was added to the buffer (600 µl) at a final concentration of 10 µM in a 96-well plate after preincubation for 5 minutes, and the resultant mixture was incubated at 37°C with shaking at 120 rpm. Samples (50 µl) were taken from the plate at 0, 5, 10, 20, 30, 40, 50, and 60 minutes after the onset of incubation. The sample was mixed with a 150 µl of ice-cold solution (acetonitrile/methanol, 2/1, v/v) by pipetting the solution up and down, and it was transferred to a MultiScreen Deep Well Solvinert Filter Plate (Merck Millipore, Billerica, MA) and centrifuged at 1,000g for 3 minutes at 4°C.
The concentrations of the TCI and its GSH adduct were immediately measured by ultraperformance liquid chromatography (UPLC), as described in the section for liquid chromatography with tandem mass spectrometry (LC-MS/MS) and UPLC analyses. The chemical reaction with GSH was stopped by the addition of 3 volumes of ice-cold acetonitrile/methanol (2/1, v/v), and the generated GSH conjugates were stable for 3 hours under the present conditions. The amount of formed GSH conjugate was calculated from the molar absorptivity (i.e., area of UV absorbance of GSH conjugate at 300 nm/mol of GSH conjugate), which was determined from a UV chromatogram of GSH conjugate converted from the known amount of model compound by incubation in the buffer containing 200 mM GSH.
The susceptibility to GSH/GST-dependent conjugation in cytosol fractions of human liver and kidney was evaluated by the incubation of each model compound in potassium phosphate buffer (pH 7.4) containing cytosol fractions (0.1 mg/ml) and 2 mM GSH. An aliquot (3 µl) of stock compound solution (2 mM) in 100% acetonitrile (afatinib and neratinib) or 100% methanol (ibrutinib) was added to the buffer (600 µl) at a final concentration of 10 µM in a 96-well plate after preincubation for 5 minutes, and the resultant mixture was incubated at 37°C with shaking at 120 rpm. Samples (50 µl) were taken from the plate at 0, 5, 10, 20, 30, 40, 50, and 60 minutes after the onset of incubation. The samples were treated as described in the previous section, and the concentrations of compounds were measured by UPLC, as described in the section on LC-MS/MS and UPLC analyses.
In Vitro Metabolic (Intrinsic) Clearance (CLint,in vitro) in Cryopreserved Rat, Dog, Monkey and Human Hepatocytes Suspended in 100% Serum from the Corresponding Species.
Viable cells were counted 3 minutes after the suspension was mixed with an equal volume of 0.4% trypan blue to stain the dead cells before counting (trypan blue exclusion test). Hepatocytes were resuspended in 100% serum of the corresponding species on ice for incubation at the following cell densities for rat, dog, monkey, and human hepatocytes: for afatinib 3, 1, 2, and 3 × 10⁶ (viable) cells/ml, respectively; for ibrutinib 2, 1, 0.3, and 0.5 × 10⁶ (viable) cells/ml, respectively; and for neratinib 3, 1, 0.3, and 1 × 10⁶ (viable) cells/ml, respectively. The lowest possible cell density was preliminarily determined to ensure that the first-order disappearance was accurately evaluated by >10% disappearance during the 60-minute (rat) or 120-minute (the other species) incubation.
An aliquot (3.8 µl) of stock solution (200 µM) in 100% acetonitrile (afatinib and neratinib) or 100% methanol (ibrutinib) was added to the suspension (760 µl), which had been pipetted into a 1.5-ml tube, and the resultant suspension was gently mixed at the final concentration of 1 µM. Each sample (50 µl) was pipetted into four 96-well plates with flat bottoms (n = 3). Each of three plates was incubated at 37°C with shaking at 150 rpm in an atmosphere of 95% O2/5% CO2 in a water bath incubator (300 ml water in ISOTEMP 205; Fisher Scientific, Waltham, MA) placed on an orbital shaker (MMS-210, EYELA, Tokyo, Japan) for 15, 30 and 60 minutes for rat or 30, 60 and 120 minutes for the other species.
The incubated plate was placed on ice at the designated time after the onset of incubation, and the reaction was terminated by the addition of a 150 µl of ice-cold solution (acetonitrile/methanol, 2/1, v/v) containing propranolol (0.2 µM) as an internal standard for the LC-MS/MS analysis. The same solution that was used for the termination of the reaction was also added to the samples in the control plate, which served for the determination of initial concentration at time 0 for each incubation.
The resultant samples were mixed by pipetting the solution up and down, and were transferred to 0.5-ml tubes, followed by the centrifugation at 10,000g for 10 minutes at 4°C. After 10-fold dilution in the solution (acetonitrile/methanol/water, 2/1/1, v/v/v), the amount of compound remaining in the supernatant was determined by LC-MS/MS, as described in the section on LC-MS/MS and UPLC analyses.
PK Studies in Rat, Dog, and Monkey.
Male Sprague-Dawley rats, 7–9 weeks of age, were purchased from Charles River Japan (Yokohama, Japan). Male beagle dogs (9–13 kg) and male cynomolgus monkeys (4.0–6.5 kg) were used for the PK studies. The animals were maintained on a 12-hour light/dark cycle and were acclimated at least for a week before dosing. The animals were provided with food and water ad libitum. All animals were fasted overnight before dosing and were fed at 8 hours after the dose. The PK studies described were performed with the approval of the institutional animal care and use committee.
For PK studies in rats, the following dosing conditions were used (n = 3 for each route of administration for each compound). Afatinib was injected into the jugular vein under isoflurane anesthesia for intravenous (i.v.) administration at 1 mg/1 ml/kg in saline containing 2 Eq HCl, or was administered orally at 3 mg/10 ml/kg in 0.5% HPMC suspension containing 2 Eq HCl. Ibrutinib was injected into the jugular vein under isoflurane anesthesia for i.v. administration at 1 mg/1 ml/kg in 10% ethanol/10% polyethylene glycol 400 (PEG400)/water containing 2 Eq HCl, or was administered orally at 3 mg/10 ml/kg in 0.5% HPMC suspension. Neratinib was injected into the jugular vein under isoflurane anesthesia for i.v. administration at 1 mg/1 ml/kg in 10% ethanol/10% PEG400/water containing 2 Eq HCl, or was administered orally at 3 mg/10 ml/kg in 0.5% HPMC suspension.
In the cases of PK studies in dog and monkey, the following dosing conditions were used (n = 3 for each route of administration for each compound). Afatinib was injected into the cephalic vein for i.v. administration at 1 mg/1 ml/kg in saline containing 2 Eq HCl or was administered orally at 3 mg/5 ml/kg in 0.5% HPMC suspension containing 2 Eq HCl. Ibrutinib was injected into the cephalic vein for i.v. administration at 1 mg/0.5 ml/kg in 10% ethanol/10% PEG400/water containing 2 Eq HCl or was administered orally at 3 mg/5 ml/kg with 0.5% HPMC suspension. Neratinib was injected into the cephalic vein for i.v. administration at 1 mg/0.5 ml/kg in 10% ethanol/10% PEG400/water containing 2 Eq HCl or was administered orally at 3 mg/5 ml/kg in 0.5% HPMC suspension.
Blood was collected in a heparinized syringe from the jugular vein in rat or the cephalic vein in dog and monkey at 0.083, 0.25, 0.5, 1, 2, 4, 8, and 24 hours after dosing for i.v. administration and at 0.25, 0.5, 1, 2, 4, (6), 8, and 24 hours after dosing for oral administration where the samples at 6 hours after dosing were obtained in the rat for all compounds and in the dog for neratinib. The collected blood samples were quickly centrifuged at 10,000g for 5 minutes at 4°C to obtain plasma samples. All plasma samples were stored at −80°C until use. Urine samples from dog and monkey after i.v. administration were collected from 0–4, 4–8, and 8–24 hours after dosing. Plasma and urine samples were deproteinized by the addition of 20 volumes of 87.5% ethanol-containing propranolol (200 nM) as an internal standard, and the resultant samples were filtrated using a MultiScreen Deep Well Solvinert Filter Plate. The drug concentrations in plasma and urine were quantified by LC-MS/MS in multiple reaction monitoring, as described in the section on LC-MS/MS and UPLC analyses.
Plasma Protein Binding and Blood-to-Plasma Concentration Ratio (RB).
An aliquot (1 µl) of compound stock solution (100 µM) in 50% acetonitrile was added to rat, dog, monkey, and human plasma at a final concentration of 1 µM. The equilibrium dialysis between plasma and phosphate-buffered saline (PBS) at pH 7.4 (Life Technologies Japan, Tokyo, Japan) was performed using HTD96a (HTDialysis, Gales Ferry, CT) with a HTD 96a/b dialysis membrane strip (molecular mass cutoff at 12–14 kDa) at 37°C for 6 hours with shaking at 80 rpm in 10% CO2 atmospheric condition. After 6 hours, an aliquot of plasma sample (10 µl) and blank PBS (50 µl) were quickly mixed in a 0.5-ml tube for the determination of plasma concentration, and an aliquot of PBS sample (50 µl) and blank plasma (10 µl) were quickly mixed in a 0.5-ml tube for the determination of the concentration in the PBS sample. After the addition of ethanol (180 µl) containing an internal standard to both plasma- and PBS-derived samples, the resultant mixtures were centrifuged at 10,000g for 10 minutes at 4°C. The concentrations in the supernatants of both samples were measured by the LC-MS/MS method described in the section on LC-MS/MS and UPLC analyses. The value of the unbound fraction in plasma (fU) was calculated from the ratio of the concentration in PBS to that in the plasma.
An aliquot (1 µl) of compound stock solution (200 µM) in 100% acetonitrile (afatinib and neratinib) or 100% methanol (ibrutinib) was added to the blood (100 µl) at a final concentration of 1 µM, which had been pipetted into a 0.5-ml tube; the resultant sample was mixed and placed on ice (n = 3). The samples were then incubated in a water bath for 20 minutes at 37°C with shaking at 150 rpm. An aliquot of the incubated blood sample (10 µl), blank plasma (10 µl), and water (60 µl) was quickly mixed in a 0.5-ml tube for determination of the concentration in whole blood. The remaining incubated blood was centrifuged at 6,000g for 1 minute at 37°C to separate the plasma. An aliquot of separated plasma sample (10 µl), blank blood (10 µl), and water (60 µl) was mixed in a 0.5-ml tube for determination of the plasma concentration. After the addition of 240 µl of solution (acetonitrile/methanol, 2/1, v/v) containing an internal standard to both the whole blood-derived and plasma-derived samples, the resultant samples were centrifuged at 10,000g for 15 minutes at 4°C. After 10-fold dilution of each sample in solution (acetonitrile/methanol/water, 2/1/1, v/v/v), the concentration in the supernatants of both samples was measured by the LC-MS/MS method described in the section on LC-MS/MS and UPLC analyses. The value of the blood-to-plasma concentration ratio (RB) was calculated from the ratio of the concentration in whole blood to that in plasma.
LC-MS/MS and UPLC Analyses.
For the LC-MS/MS method, the system consisted of a Quattro Premier XE and Acuity UPLC-UV system (Waters Corp., Milford, MA) with an Acquity BEH C18 column (1.7 µm, 2.1×50 mm, Waters Corp.) at 40°C. Multiple reaction monitoring was used with the following mass numbers for each compound (parent > product): afatinib (486.31 > 370.96), ibrutinib (441.01 > 138.00), neratinib (556.92 > 112.07), and propranolol (260.00 > 116.00; internal standard) at positive-ion mode.
The method involved gradient elution with 0.1% formic acid (solvent A) and acetonitrile (solvent B) at a flow rate of 0.35 ml/min. The A/B ratio was set at 90/10 as the initial elution condition for all standard compounds. After the injection of the sample (2 µl), the ratio changed linearly to 35/65 from 0.3 to 3.0 minutes, to 5/95 from 3.0 to 3.1 minutes, and maintained at 5/95 from 3.1 to 3.5 minutes after injection. The ratio was changed quickly to 90/10 at 3.51 minutes after the injection, and was maintained at 90/10 until 5 minutes (total analytic time: 5 minutes/sample). The retention times of afatinib, neratinib, propranolol (internal standard), and ibrutinib were 1.6, 1.8, 2.1, and 2.9 minutes, respectively.
For the UPLC method, the system consisted of an Acuity UPLC with PDA eλ Detector system (Waters Corp.) with an Acquity BEH C18 column (1.7 µm, 2.1×50 mm; Waters Corp.) at 40°C. The method involved gradient elution with 10 mM ammonium acetate (solvent A) and acetonitrile (solvent B) at a flow rate of 0.35 ml/min. The A/B ratio was set at 98/2 as the initial elution condition for all standard compounds. After injection of the sample (3 µl), the ratio changed linearly to 82/18 from 0.05 to 1.0 minutes, to 60/40 from 1.0 to 3.2 minutes, to 5/95 from 3.2 to 4.0 minutes after injection. The ratio was changed quickly to 98/2 at 4.05 minutes after the injection, and was maintained at 98/2 until 5 minutes (total analytic time: 5 minutes/sample). Peaks were detected by absorbance at 300 nm. The retention times of afatinib, ibrutinib, and neratinib were 3.7, 4.1, and 3.9 minutes, respectively, and those of the corresponding glutathione adducts were 2.5, 3.1, and 2.8 minutes, respectively.
PK Analysis.
PK parameters were calculated using Phoenix WinNonlin, version 6.1 (Pharsight Corporation, Mountain View, CA). Plasma concentrations below the lower limit of quantification (i.e., 0.003, 0.001, and 0.0015 µM for afatinib, ibrutinib, and neratinib, respectively) were regarded as 0. The area under the concentration curve (AUC) values were calculated by the trapezoidal (log/linear) method and were extrapolated to infinity beyond the last quantifiable time point using a rate constant determined by linear regression analysis of the log-linear part of the plasma concentration-time curve; the percentage of the extrapolated AUC was <10% of AUC0–∞ for all experiments, except for in the rat after i.v. administration of afatinib which accounted for ∼18% of AUC0–∞. The observed total body (plasma) clearance (CLtot,obs) was calculated as dose/AUC after i.v. administration. The oral bioavailability (FPO) was calculated by dividing the area under the plasma concentration–time curve after oral administration (AUCoral) by the AUC0–∞ after i.v. administration.
Calculations.
The value of in vitro metabolic (intrinsic) clearance (CLint,in vitro, µl/min/106 cells) was calculated from eq. 1 using cell density (CD, cells/ml), incubation time (T, 120 minutes in the present study), the ratio (R) of unchanged compound concentration at time T to that at time 0 (Shibata et al., 2000), and the recovery (S) to time zero at time T in 100% serum:
 (1)
(1)The value of CLint,in vitro was multiplied by the empirically calculated scaling factor [SF; 3.35, 4.45, 2.33, and 4.08 ×10⁹ cells/kg body weight (BW) for rat, dog, monkey, and human hepatocytes, respectively, which were determined for the lots of cryopreserved preparations used in the present study and were similar to those reported in the previous studies (Shibata et al., 2000, 2002, 2014)] to calculate the predicted metabolic (intrinsic) clearance for whole liver (CLH,int,in vitro, ml/min/kg BW) as follows:
 (2)
(2)The dispersion model was chosen as the liver model to predict hepatic clearance (CLH) because previous publications had reported that the dispersion model accurately predicted hepatic availability (FH) from in vitro data even for high-clearance drugs (Roberts and Rowland, 1986; Iwatsubo et al., 1997; Naritomi et al., 2003; Niro et al., 2003). The value of CLH was calculated from CLH, int,in vitro as follows: (3)where the dispersion number (DN) = 0.17 (Roberts and Rowland, 1986),
  , and
, and  . The hepatic blood flow rates (QH) for rat, dog, monkey, and human were assumed to be 58.8 (Lin et al., 1982), 30.9, 43.6, and 20.7 ml/min/kg BW (Davies and Morris, 1993), respectively. The value of FH was calculated from the obtained CLH via eq. 4:
 (4)
(4)CLextH (ml/min/kg BW) in each animal species was calculated by subtracting the predicted CLH (eq. 3) from the observed total body (plasma) clearance (CLtot,obs) obtained from PK studies after i.v. administration:
 (5)
(5)Allometric scaling across species was performed to predict the CLextH corrected for the unbound compound (CLu,extH, ml/min/body) in humans. Simple allometry relating the calculated CLu,extH in the species to the BW of the corresponding species was considered, and the value of CLu,extH was plotted against BW on a log-log scale based on the power-based simple allometric equation: (6)where
 ; BW = 0.25, 10, and 5 kg/body for rat, dog, and monkey, respectively (Davies and Morris, 1993); and a and b represent the allometric coefficient and exponent, respectively. Linear regression was then performed using Microsoft Excel 2010 (Microsoft, Redmond, WA) according to the logarithmic transformation of eq. 6 (i.e., Log CLu,extH = Log a + b × Log BW), and the CLextH for human (ml/min/kg BW) was calculated by fU (in humans) × CLu,extH (at BW = 70 kg/body for humans)/70.
The predicted total body clearance (CLtot,pred) in humans was calculated by summing the obtained CLextH and the predicted hepatic clearance (CLH) from cryopreserved human hepatocytes suspended in 100% human serum (eq. 3):
 (7)
(7)The product of the absorption fraction and intestinal availability (fa⋅FG) in each animal species was calculated by dividing the observed FPO by the predicted FH (eq. 4) in the corresponding species:
 (8)
(8)The AUCoral value for each dose (Dose) in humans was predicted by using calculated values of FH (eq. 4), CLtot,pred (eq. 7), and fa⋅FG (eq. 8):
 (9)
(9)Results
GSH/GST-Dependent Conjugation.
The chemical reactivity with GSH was examined for afatinib, ibrutinib, and neratinib (10 µM) in phosphate buffer (pH 7.4) containing 2 mM GSH at 37°C for 60 minutes (Fig. 2A). Afatinib and neratinib formed equivalent amounts of GSH conjugates in parallel with decreases in the parent compound to 36% and 29% of the initial concentrations, respectively, whereas ibrutinib had little reactivity with GSH in buffer and remained mostly in an unconjugated form after a 60-minute incubation. Similarly, GSH/GST-dependent conjugation with ibrutinib in the cytosol fractions of both liver and kidney from humans was much slower than those for afatinib and neratinib (Fig. 2B). No differences were observed for the disappearance and formation profiles of all parent compounds in the cytosol fractions between liver and kidney.

Glutathione (GSH) conjugation in buffer and cytosol fractions. (A) Formation of GSH adducts and disappearance of afatinib, ibrutinib, and neratinib in 100 mM phosphate buffer (pH 7.4) containing 2 mM GSH. Data are presented as the mean of duplicate determinations. Solid and broken lines represent the remaining proportion (%) of the parent compound and the formation (%) of GSH adduct, respectively. (B) Formation of GSH adducts and disappearance of afatinib, ibrutinib, and neratinib in cytosol fraction of human liver and kidney. Data are presented as the mean of duplicate determinations. Solid lines with filled and open squares represent the remaining proportion (%) of the parent compound in cytosol from liver and kidney, respectively. Broken lines with filled and open triangles represent the formation (%) of GSH adduct in cytosol from liver and kidney, respectively.
In Vitro Metabolic (Intrinsic) Clearance (CLint, in vitro) in Cryopreserved Rat, Dog, Monkey, and Human Hepatocytes Suspended in 100% Serum of the Corresponding Species.
The time-courses of the disappearance of afatinib, ibrutinib, and neratinib in cryopreserved rat, dog, monkey, and human hepatocytes suspended in 100% serum of the corresponding species are shown in Fig. 3A–C, respectively. The recovery (S value in eq. 1) for each compound from 100% serum was also determined at 60 minutes (rat) or 120 minutes (dog, monkey, and human). The following values of recovery were obtained in rat, dog, monkey, and human serum (mean ± S.D., n = 3): for afatinib 96% ± 4%, 98% ± 3%, 95% ± 1%, and 96% ± 1%, respectively; for ibrutinib 97% ± 2%, 89% ± 2%, 91% ± 2%, and 84% ± 2%, respectively; and for neratinib 97% ± 1%, 97% ± 3%, 93% ± 2%, and 71% ± 3%, respectively. First-order disappearance with incubation time was observed for all compounds, and the values of CLint,in vitro were calculated using eq. 1 (Table 1).

Time course of disappearance of (A) afatinib, (B) ibrutinib, and (C) neratinib in cryopreserved preparations of rat, dog, monkey, and human hepatocytes suspended in 100% serum of the corresponding species. Data are presented as the mean ± S.D. of triplicate determinations. Lines represent the best-fitted first-order disappearance curves for the calculation of in vitro metabolic (intrinsic) clearance (CLint,in vitro) by eq. 1.
Prediction from hepatocytes [hepatic clearance (CLH) and availability (FH)] and observed pharmacokinetics in preclinical species [total body (plasma) clearance (CLtot,obs), oral bioavailability (FPO), and absorption fraction × intestinal availability (fa⋅FG)]
Data represent mean ± S.D. (n = 3).
The predicted CLH and FH (Table 1) were then calculated using eq. 3 and eq. 4, respectively, based on the predicted metabolic (intrinsic) clearance for whole liver (CLH,int,in vitro), which was scaled up from CLint,in vitro by empirical scaling factors (eq. 2). Afatinib was found to be very stable in the hepatocytes of all the species tested, with predicted FH > 0.96. Ibrutinib demonstrated a large species difference in the calculated FH values in rats (0.64) > dogs (0.33) = monkeys (0.28) >> humans (0.076). Neratinib was more stable in rat hepatocytes with predicted FH = 0.96 than the other species; the predicted FH in dogs, monkeys, and humans ranged from 0.50 to 0.70.
Pharmacokinetics in Rat, Dog, and Monkey.
Plasma concentration–time profiles of afatinib, ibrutinib, and neratinib after i.v. (1 mg/kg) and oral (3 mg/kg) administrations are shown in Figs. 4, A–C, respectively. The observed total body (plasma) clearance (CLtot,obs) and oral bioavailability (FPO) are listed in Table 1.
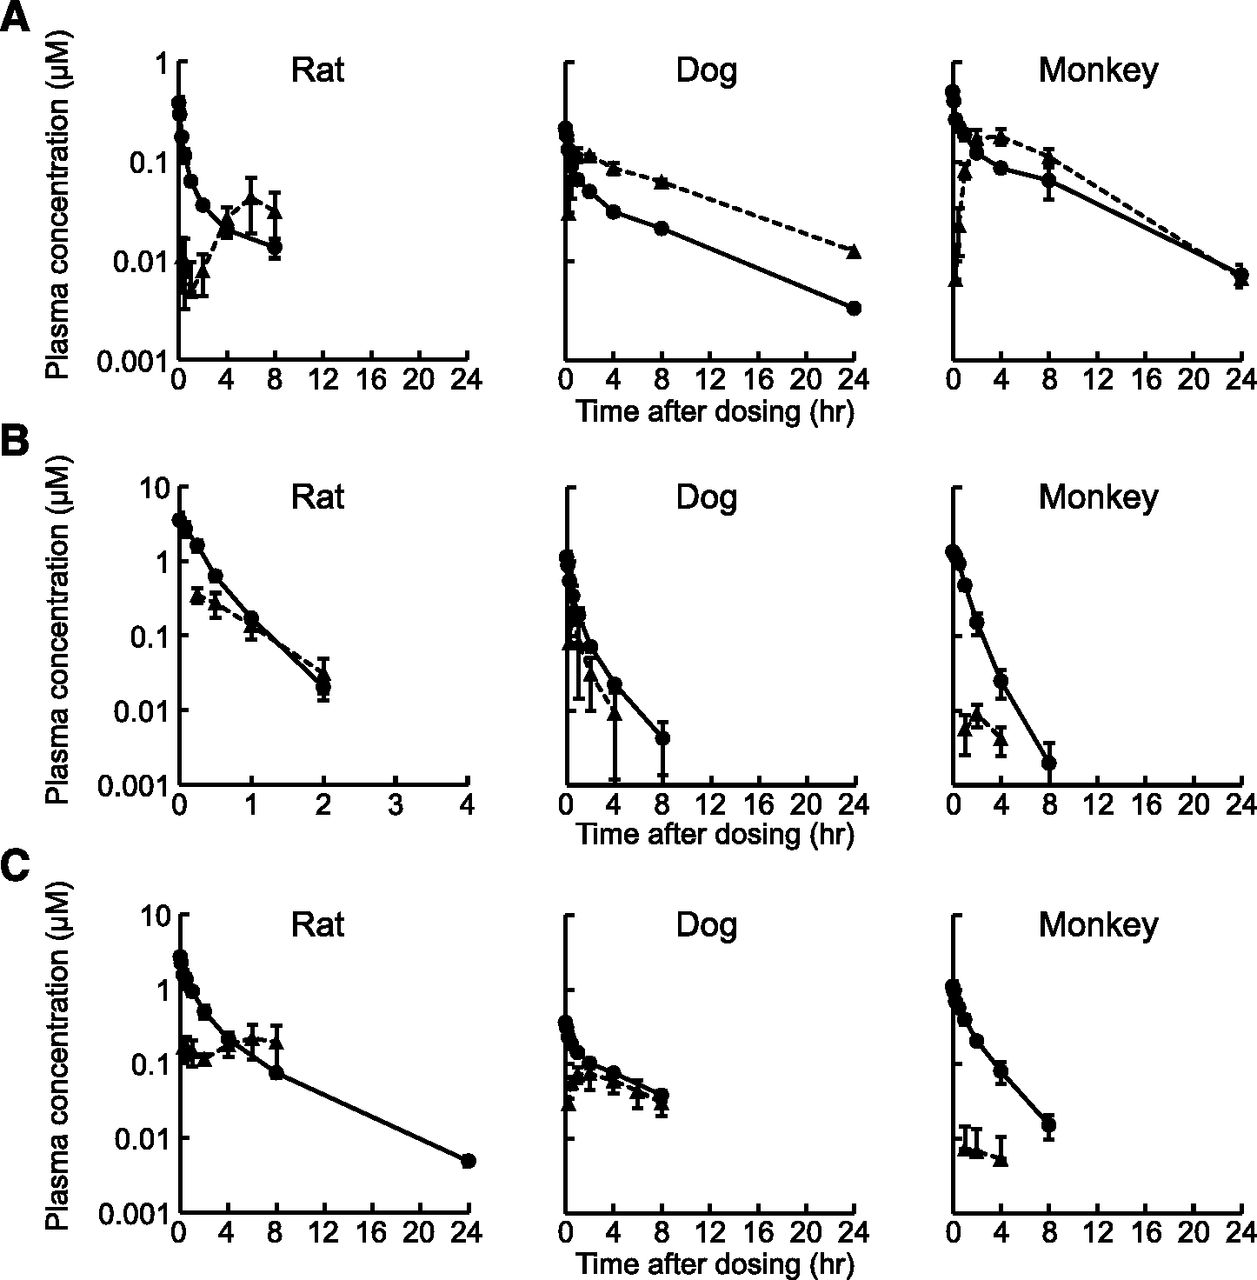
Plasma concentration-time profiles of (A) afatinib, (B) ibrutinib, and (C) neratinib after intravenous (1 mg/kg) and oral (3 mg/kg) administrations to rat, dog, and monkey. Data are presented as the mean ± S.D. (n = 3). Circles and triangles represent plasma concentrations after intravenous and oral administrations, respectively. The lower limits of quantitation were 0.003, 0.001, and 0.0015 µM for afatinib, ibrutinib, and neratinib, respectively.
The values of CLtot,obs were larger than those of predicted CLH in all cases, especially for afatinib, whose CLtot,obs values were 38-, 8.5-, and 10-fold larger than the predicted CLH in rat, dog, and monkey, respectively. As the urinary excretions of the parent afatinib were negligible in dogs and monkeys (<0.5% of dose), these results suggested that the nonrenal CLextH largely accounted for the total body clearance of afatinib in preclinical species.
The values of fa⋅FG (Absorption fraction × Intestinal availability) were calculated by using the observed FPO and the predicted FH in rat, dog, and monkey (eq. 8), and the results are listed in Table 1. The fa⋅FG values for afatinib were relatively constant among species (0.39∼0.85), whereas those for ibrutinib and neratinib in monkeys (0.012 and 0.028, respectively) were markedly smaller than the corresponding values in rats (0.15 and 0.22, respectively) and dogs (0.34 and 0.33, respectively).
Plasma Protein Binding and Blood-to-Plasma Concentration Ratio.
We evaluated fU by the equilibrium dialysis method, and the following values were obtained in rat, dog, monkey, and human plasma (mean ± S.D., n = 3): for afatinib 9.1% ± 0.3%, 7.3% ± 0.8%, 7.8% ± 0.4%, and 10.1% ± 0.4%, respectively; for ibrutinib 0.25% ± 0.03%, 2.1% ± 0.2%, 2.9% ± 0.1%, and 2.9% ± 0.1%, respectively; and for neratinib 0.19% ± 0.03%, 1.9% ± 0.3%, 0.64% ± 0.04%, and 1.3% ± 0.0%, respectively. By using these values, CLextH was converted to the corresponding value for the unbound compound (CLu,extH), which was used in the allometric scaling analysis (eq. 6).
The values of RB were also determined in rat, dog, monkey, and human blood as follows (mean ± S.D., n = 3): for afatinib 3.0 ± 0.0, 5.6 ± 0.2, 2.1 ± 0.0, and 2.2 ± 0.0, respectively; for ibrutinib 0.72 ± 0.03, 0.94 ± 0.02, 0.85 ± 0.01, and 0.86 ± 0.01, respectively; and for neratinib 0.68 ± 0.02, 1.4 ± 0.0, 0.84 ± 0.03, and 0.91 ± 0.03, respectively. These values were used for the calculations of CLH and FH by eq. 3 and eq. 4, respectively.
Extrahepatic Clearance and Allometric Scaling to Human.
The CLH value (Table 1) divided by RB (listed in the previous section) was normalized by hepatic blood flow rate (QH) in each species, and the results are shown in Fig. 5A. Similarly, the calculated CLextH value divided by RB was normalized by QH, and the results are shown in Fig. 5B. In addition, the CLextH value in each species was corrected by fU of the corresponding species (listed in the previous section), and the obtained CLu,extH in preclinical species are plotted against their BWs on a log-log scale (Fig. 5C).

Contribution of extrahepatic clearance (CLextH) and allometric scaling to human. (A) Hepatic clearance (CLH) [corrected by blood-to-plasma concentration ratio (RB)] normalized by hepatic blood flow rate (QH). (B) CLextH (corrected by RB) normalized by QH. (C) Power-based simple allometry relating CLextH corrected by the unbound fraction in plasma (CLu,extH) to BW across preclinical species for the extrapolation of CLu,extH to humans. The following allometric coefficient (a) and exponent (b) were obtained for the power-based simple allometric equation (eq. 6) with the coefficient of determination (R2) for linear regression: a = 688, b = 0.837, and R2 = 0.894 for afatinib; a = 1887, b = 0.593, and R2 = 0.918 for neratinib. The power-based simple allometric relationship was not applicable to ibrutinib for the extrapolation of CLu,extH (R2 = 0.042).
Power-based simple allometric relationships between the calculated CLu,extH in preclinical species and BW of the corresponding species (eq. 6) were obtained across species with good coefficients of determination (R2) of 0.89 and 0.92 for afatinib and neratinib, respectively. The allometric scaling resulted that extrapolated values of CLextH in human were 34.7 and 4.4 ml/min/kg for afatinib and neratinib, respectively, based on the following CLu,extH values (as expressed per kg BW) in rat, dog, and monkey: for afatinib 967, 778, and 287 ml/min/kg BW, respectively; and for neratinib 3560, 1005, and 671 ml/min/kg BW, respectively. In contrast, the large species difference in the CLu,extH values (as expressed per kg BW) of ibrutinib among preclinical species (7492, 1658, and 52 ml/min/kg BW in rat, dog, and monkey, respectively) precluded an application of simple allometry across species (R2 = 0.042).
Comparisons between Predicted and Observed AUC after Oral Administrations of Afatinib and Neratinib in Dose-Escalation Studies in Human.
The relationships between dose and AUC value after oral administrations (AUCoral) of afatinib and neratinib were predicted by incorporating CLH (and FH) (Table 1), CLextH (Table 2), CLtot,pred (eq. 7, Table 2), and fa⋅FG in preclinical species (Table 1) into eq. 9. The predicted AUCoral values were compared with the observed values in the dose-escalation studies in human volunteers and patients (Fig. 6). The dose-AUCoral relationships were best-approximated to those reported for afatinib and neratinib when the fa⋅FG values determined in dogs were used for both predictions: the predicted AUCoral values (211 and 799 ng⋅h/ml) at the recommend doses of 40 mg (for afatinib) and 240 mg (for neratinib), respectively, were both within ∼3-fold of the observed values (299∼662 ng⋅h/ml for afatinib; 823∼1640 ng⋅h/ml for neratinib) (Table 2).
Predicted and observed area under the plasma concentration–time curve after oral administrations of afatinib and neratinib at the recommended doses for humans

Predicted versus observed area under the plasma concentration–time curve (AUC) after single oral administrations of (A) afatinib and (B) neratinib to humans in dose-escalation studies. Observed AUC values of afatinib represent the geometric mean and were obtained from the following reports: yellow diamond, AUC0–24h in patients (Murakami et al., 2012); blue square, AUC0–24h in patients (Wind et al., 2013); red circle, AUC0-inf in patients (Yap et al., 2010); green triangle, AUC0–∞ in healthy volunteers (Stopfer et al., 2012); and black open triangle, AUC0–24h in patients (Molife et al., 2013). Observed AUC values of neratinib represent the mean ± S.D. and were obtained from the following reports: red circle, AUC0–24h in patients (Wong et al., 2009); black open triangle, AUC0–24h in healthy volunteers (Abbas et al., 2012); green triangle, AUC0–∞ in healthy volunteers (Abbas et al., 2011); and blue square, AUC0–∞ in patients (Ito et al., 2012). Solid, dashed, and dotted lines represent the predictions of AUC using fa⋅FG in dog, rat, and monkey, respectively.
Discussion
TCIs have recently emerged as drug candidates where pharmacologic targets need to be silenced in a sustained manner. In the present study, we examined CLextH for afatinib, ibrutinib, and neratinib as model TCI compounds in preclinical species because conjugation by ubiquitously distributed GSH/GST to the electrophilic α,β-unsaturated carbonyl moiety (Michael acceptor) may determine the PK of TCI compounds. We calculated total body clearance by combining the extrapolated CLextH in humans and the hepatic clearance predicted from cryopreserved human hepatocytes, and we compared the predicted and observed AUC values in phase I dose-escalation studies for afatinib and neratinib, which resulted in reasonably good agreement. These results suggested that GSH conjugation, which is characteristic of TCI compounds, while depending on the chemical reactivity and/or susceptibility to GSH/GST, allowed allometric scaling of CLextH across species for the prediction of PK in humans.
The CLextH in each preclinical species was calculated by subtracting the predicted CLH from the observed total body clearance (CLtot,obs) in the corresponding species (eq. 5 and Fig. 5B). Of GST isoforms, GSTpi is known to be highly expressed in extrahepatic tissues/organs (Pacifici et al., 1988; de Waziers et al., 1990; Awasthi et al., 1994; Rowe et al., 1997), and it is likely to be responsible for extrahepatic GSH conjugation with the unique electrophilic Michael acceptor of TCI compounds. Allometric scaling had been used to extrapolate the rate of GSH conjugation in physiologically based PK models of toxicity and GSH-depletion established in one species to those in other species, including humans, for the risk assessment of ethylene dichloride (D’Souza et al., 1988), methylene chloride (Andersen et al., 1987; Reitz et al., 1989), and vinylidene chloride (D’Souza and Andersen, 1988), all of which undergo GSH conjugation for elimination of the parent compound and/or reactive metabolite(s). Therefore, we hypothesized that nonenzymatic and GST-dependent GSH conjugation activities are not subject to qualitative species differences but are dependent only on the size of the body across species. The results of linear regression with good coefficient of determination (R2 ≥ 0.9) for the relationship between CLextH corrected by unbound fraction in plasma (CLu,extH) and BW (Fig. 5C) for afatinib and neratinib, both good substrates for GSH conjugation (Fig. 2), supported our hypothesis that CLu,extH in humans can be predicted from extrapolation by power-based simple allometry relating the value to BW (eq. 6).
The extrapolated CLextH value (Table 2) suggested that CLextH accounts for ∼94% of the total body clearance of afatinib in humans. In agreement with our prediction of extensive GSH/GST-dependent conjugation in humans, afatinib undergoes GSH/GST-dependent conjugation as the predominant pathway for metabolic elimination in humans; a mass-balance study with [14C]afatinib in humans (Stopfer et al., 2012) reported that the overall recovery of radioactivity was 89.5%, with ∼89% excreted as the parent afatinib and the remaining radioactive component mostly accounted for by conjugates with GSH, cysteine-glycine, and cysteine.
The prediction of the PK of neratinib (Table 2) suggested that both CLextH (4.4 ml/min/kg) and CLH (8.5 ml/min/kg) were involved in total body clearance in humans. Neratinib was reported to be mainly metabolized by cytochrome P450 isoform 3A4 (CYP3A4) in a preclinical study, and coadministration of ketoconazole (400 mg once daily for 5 days), a potent CYP3A inhibitor, increased the AUC and maximum plasma concentration of neratinib by 4.8- and 3.2-fold, respectively, compared with those after the administration of neratinib alone in humans (Abbas et al., 2011). These data from drug-drug interaction studies were consistent with our present results, namely, that the metabolism in the liver contributed to the PK of neratinib in addition to the CLextH by GSH/GST-dependent conjugation in humans.
In contrast to large contributions of GSH conjugation to the PK of afatinib and neratinib, ibrutinib showed little reactivity with GSH in phosphate buffer at pH 7.4 (Fig. 2A) and underwent much slower GSH conjugation in the cytosol fractions from human liver and kidney (Fig. 2B). These results suggested that the contribution of GSH/GST-dependent conjugation to CLextH for ibrutinib was much smaller than that for afatinib and neratinib. Ibrutinib is known to mainly undergo CYP3A- and CYP2D6-mediated metabolism in humans (CDER, 2013). Therefore, we evaluated the metabolic stability of ibrutinib (20 nM) in NADPH-fortified liver, kidney, and lung microsomes from rats, dogs, monkeys, and humans (0.1 mg microsomal protein/ml for liver and kidney; and 0.5 mg microsomal protein/ml for lung) to examine the potential contribution of P450 isoform(s) to the extrahepatic metabolism of ibrutinib in preclinical species and humans (Supplemental Fig. 1).
The data indicated that the metabolic rates in kidney and lung microsomes of rat (lung) and dog (kidney and lung) were much higher than those in other species: in kidney microsomes 0.035 min−1 in dogs versus 0.0063, 0.0063, and 0.0016 min−1 in rats, monkeys, and humans, respectively; and in lung microsomes 0.0094 min−1 in rats and dogs versus 0.0017 and 0.0012 min−1 in monkeys and humans, respectively. In contrast, the rate of metabolism for ibrutinib in dog liver microsomes was 6- to 9-fold lower than that found in other species: 0.063 min−1 in dogs versus 0.48, 0.55, and 0.37 min−1 in rats, monkeys, and humans, respectively. Although the P450 isoform(s) responsible for the metabolism of ibrutinib in the kidney and lung of rats and dogs remains to be elucidated and the contribution of other enzyme(s) to CLextH in these species cannot be excluded, the species difference in P450-mediated extrahepatic metabolism, in contrast to ubiquitous GSH conjugation across species, may at least partially explain the observed large CLextH values in the rat (18.7 ml/min/kg) and dog (34.8 ml/min/kg) compared with the monkey (1.5 ml/min/kg). Because of the uncertainty of the contribution of CLextH to PK in humans, we did not perform a prediction of the PK of ibrutinib in humans.
The present prediction of hepatic (blood) clearance for ibrutinib from cryopreserved human hepatocytes suspended in 100% human serum (CLH/RB = 16/0.86 = 18.6 ml/min/kg in Table 1) was consistent with the documented value (∼19 ml/min/kg) predicted from the in vitro intrinsic clearance in human liver microsomes (∼8000 μl/min/mg microsomal protein) used for physiologically based PK modeling for ibrutinib in humans (CDER, 2013). The hepatic blood flow-limited PK predicted for ibrutinib (CLH, ∼19 ml/min/kg versus QH, 20.7 ml/min/kg) may at least partially explain the observed large CL/F (∼1000 L/h) and high variability in steady-state AUCoral values [680 ± 517 and 953 ± 705 ng⋅h/ml (mean ± S.D.)] at the recommended doses of 420 mg/d (for chronic lymphocytic leukemia) and 560 mg/d (for mantle cell lymphoma), respectively (CDER, 2013).
Calculations of the product of absorption fraction and intestinal availability (fa⋅FG) (eq. 8 and Table 1) revealed very low values for ibrutinib (0.012) and neratinib (0.028) in monkeys compared with those in rats and dogs (i.e., 0.15 and 0.34, respectively, for ibrutinib; 0.22 and 0.33, respectively, for neratinib), while the values for afatinib were relatively constant among all species (0.39∼0.85). Metabolic studies demonstrated (data not shown) that ibrutinib and neratinib were metabolized by NADPH-fortified intestinal microsomes (0.2 mg microsomal protein/ml for 60 minutes) from rats, dogs, monkeys, and humans: for ibrutinib 48, 240, 383, and 186 µl/min/mg protein, respectively; for neratinib 29, 54, 49, and 14 µl/min/mg protein, respectively; whereas afatinib was stable in intestinal microsomes from all species: 15, 13, 5, and 1 µl/min/mg protein, respectively. The calculation (Fig. 6) showed an outstanding discrepancy between the predicted and observed AUCoral for neratinib when the value of fa⋅FG determined in the monkey was used for the prediction. These results were consistent with previous reports that the intestinal availability in vivo in monkeys is much lower than that in rats (Takahashi et al., 2008) and humans (Akabane et al., 2010; Nishimuta et al., 2010) when the substrate undergoes extensive metabolism in NADPH-fortified intestinal microsomes from monkeys (Akabane et al., 2010). These reports suggested that the monkey is not an appropriate species for the prediction of fa⋅FG in humans (Takahashi et al., 2008; Akabane et al., 2010; Nishimuta et al., 2011).
In conclusion, conjugation by GSH/GST isoforms, which are responsible for the extrahepatic elimination of afatinib and neratinib, allowed simple allometric scaling of CLu,extH across species for the prediction of its contribution to PK in humans. The present method combines the predicted CLH from human hepatocytes suspended in 100% human serum and the extrapolated CLextH for humans from allometric scaling of CLextH in preclinical species to calculate the CLtot,pred in humans. This method can provide preliminary information on the potential contribution of CLextH by GSH/GST-dependent conjugation to the total body clearance in PK in humans, which facilitates the optimization of PK at the drug-discovery stage for the development of TCI candidates with higher exposure after oral administration.
Acknowledgments
The authors thank Naoko Fujino and Dr. Jiro Kuze for their very valuable support of this work.
Authorship Contributions
Participated in research design: Shibata, Chiba.
Conducted experiments: Shibata.
Performed data analysis: Shibata, Chiba.
Wrote or contributed to the writing of the manuscript: Shibata, Chiba.
Footnotes
- Received September 30, 2014.
- Accepted December 10, 2014.
↵
 This article has supplemental material available at dmd.aspetjournals.org.

Abbreviations
- AUC0–∞
- area under the plasma concentration–time curve extrapolated to infinity
- AUCoral
- area under the plasma concentration–time curve extrapolated to infinity after oral administration
- BW
- body weight
- CLextH
- extrahepatic clearance
- CLu,extH
- extrahepatic clearance for unbound compound
- CLH
- hepatic clearance
- CLH,int,in vitro
- predicted metabolic (intrinsic) clearance for whole liver
- CLint,in vitro
- in vitro metabolic (intrinsic) clearance
- CLtot,obs
- observed total body (plasma) clearance
- CLtot,pred
- predicted total body clearance
- EGFR
- epidermal growth factor receptor
- fa
- absorption fraction
- FG
- intestinal availability
- FH
- hepatic availability
- FPO
- oral bioavailability
- fU
- unbound fraction in plasma
- GSH
- glutathione
- GST
- glutathione S-transferase
- HPMC
- hydroxypropyl methyl cellulose
- LC-MS/MS
- liquid chromatography-tandem mass spectrometry
- P450
- cytochrome P450
- PEG400
- polyethylene glycol 400
- PK
- pharmacokinetics
- PBS
- phosphate-buffered saline
- QH
- hepatic blood flow rate
- RB
- blood-to-plasma concentration ratio
- TCI
- targeted covalent inhibitor
- UPLC
- ultraperformance liquid chromatography
- Copyright © 2015 by The American Society for Pharmacology and Experimental Therapeutics


