


Abstract
The metabolism of cis-tramadol has been studied in human liver microsomes and in cDNA-expressed human cytochrome P-450 (CYP) isoforms. Human liver microsomes catalyzed the NADPH-dependent metabolism of tramadol to the two primary tramadol metabolites, namely,O-desmethyl-tramadol (metabolite M1) andN-desmethyl-tramadol (metabolite M2). In addition, tramadol was also metabolized to two minor secondary metabolites (each comprising ≤3.0% of total tramadol metabolism), namely,N,N-didesmethyl-tramadol (metabolite M3) and N,O-didesmethyl-tramadol (metabolite M5). Kinetic analysis revealed that multiple CYP enzymes were involved in the metabolism of tramadol to both M1 and M2. For the high-affinity enzymes involved in M1 and M2 formation, Kmvalues were 116 and 1021 μM, respectively. Subsequent reaction phenotyping studies were performed with a tramadol substrate concentration of 250 μM. In studies with characterized human liver microsomal preparations, good correlations were observed between tramadol metabolism to M1 and M2 and enzymatic markers of CYP2D6 and CYP2B6, respectively. Tramadol was metabolized to M1 by cDNA-expressed CYP2D6 and to M2 by CYP2B6 and CYP3A4. Tramadol metabolism in human liver microsomes to M1 and M2 was markedly inhibited by the CYP2D6 inhibitor quinidine and the CYP3A4 inhibitor troleandomycin, respectively. In summary, this study demonstrates thatcis-tramadol can be metabolized to tramadol metabolites M1, M2, M3, and M5 in human liver microsomal preparations. By kinetic analysis and the results of the reaction phenotyping studies, tramadol metabolism in human liver is catalyzed by multiple CYP isoforms. Hepatic CYP2D6 appears to be primarily responsible for M1 formation, whereas M2 formation is catalyzed by CYP2B6 and CYP3A4.
Tramadol, (2-[(dimethylamino)methyl]-1-(3-methoxyphenyl)cyclohexanol), is a synthetic opioid analgesic of the aminocyclohexanol type that has two chiral centers (Paar et al., 1992). It is a centrally acting analgesic drug with an analgesic efficacy and a potency that ranges between weak opioids and morphine (Poulsen et al., 1996). The biological activity of tramadol was initially attributed to predominantly μ-receptor-mediated opioid analgesia. However, tramadol has only a low affinity for μ-receptors of the central nervous system, being 6000 times lower than that of morphine. One metabolite of tramadol, namely, O-desmethyl-tramadol (metabolite M12), is known to have a higher affinity for opioid receptors than the parent drug. In contrast to other opioids, the analgesic action of tramadol is only partially inhibited by the opioid antagonist naloxone, which suggests an additional mechanism of action. Indeed, tramadol may act by both opioid and monoaminergic mechanisms, the latter involving inhibition of norepinephrine reuptake and stimulation of serotinin release (Collart et al., 1993a,b; Dayer et al., 1994, 1997; Poulsen et al., 1996).
The metabolism of tramadol has been studied in humans, rats, mice, Syrian hamsters, guinea pigs, rabbits, and dogs (Lintz et al., 1981). Following oral doses of 14C-labeled tramadol of either 1.06 or 1.25 mg/kg to two human volunteers, around 90% of the administered radioactivity was excreted in the urine. Analysis of 0- to 72-h urine samples revealed some unchanged tramadol (25 or 32% of total urinary radioactivity) and a number of tramadol metabolites. The primary metabolites (Fig. 1) of tramadol, namely, O-desmethyl-tramadol (metabolite M1) andN-desmethyl-tramadol (metabolite M2) may be further metabolized to three additional secondary metabolites, namely,N,N-didesmethyl-tramadol (metabolite M3),N,N,O-tridesmethyl-tramadol (metabolite M4), and N,O-didesmethyl-tramadol (metabolite M5). The urine of the two subjects given14C-labeled tramadol contained various amounts of these tramadol metabolites, together with conjugates (glucuronides and sulfates) of metabolites M1, M4, and M5 and some unidentified components.

Some known metabolic pathways of tramadol.
Tramadol has been shown to undergo both N- andO-demethylations to various metabolites which can be conjugated with either d-glucuronic acid or sulfate (Lintz et al., 1981).
The O-demethylation of tramadol to metabolite M1 is known to be catalyzed by human hepatic CYP2D6 (Paar et al., 1992, 1997; Poulsen et al., 1996). This cytochrome P-450 (CYP) isoform (Nelson et al., 1996) is expressed polymorphically in humans with some 93% of Caucasians being phenotypically extensive metabolizers and the remainder being poor metabolizers of CYP2D6 probe substrates such as debrisoquine and sparteine (Dahl et al., 1995; Ingelman-Sundberg et al., 1995). A close relationship has been reported between tramadolO-demethylation and sparteine oxidation in human volunteers and tramadol may show a weaker analgesic effect on clinical pain in poor than in extensive metabolizers (Poulsen et al., 1996; Paar et al., 1997). In the study of Lintz et al. (1981), a marked difference was observed between the two subjects examined in the relative amounts of M1 and M2 formed. Possibly one subject may have been CYP2D6 deficient (i.e., a poor metabolizer). In another study where a 50-mg oral dose of tramadol was given to 104 volunteers, mean values for M1 and M2 excretion in 24-h urines were 15 and 4% of the administered dose, respectively (Paar et al., 1997). Unlike tramadolO-demethylation, no correlation was observed between tramadol N-demethylation and sparteine oxidation in extensive metabolizers (Paar et al., 1997).
The in vitro metabolism of both (−)- and (+)-tramadol has been investigated in human liver microsomes with a substrate concentration range of 50 to 5000 μM (Paar et al., 1992). ForO-demethylation to metabolite M1, theKm value for both isomers was determined to be 210 μM. While Eadie-Hofstee plots for M1 formation were monophasic, tramadol N-demethylation to metabolite M2 was stated to exhibit biphasic kinetics. Moreover, M1 formation, but not M2 formation, was competitively inhibited by quinidine with a reportedKi value of 15 nM. Other studies have demonstrated that quinidine is a selective inhibitor of human hepatic CYP2D6 (Newton et al., 1995; Clarke, 1998; Pelkonen et al., 1998).
The objective of this study was to obtain more information on the CYP isoforms responsible for cis-tramadol metabolism in human liver. Investigations have been performed with human liver microsomes and cDNA-expressed CYP isoforms. The cis-tramadol metabolites studied were the two primary metabolites, namely, M1 and M2, together with two secondary metabolites, namely, M3 and M5 (Fig.1).
Experimental Procedures
Materials.
NADPH, cytochrome c, Tris, diethyldithiocarbamate, quinidine, sulfaphenazole, and troleandomycin were obtained from Sigma (Poole, Dorset, UK) and furafylline and S-(+)-mephenytoin from Salford Ultrafine Chemicals and Research Ltd. (Manchester, UK). A reaction phenotyping kit (product no. H0500, version 5) containing 16 individual human liver microsomal preparations, characterized for total CYP content and a range of CYP isoform enzyme activities, was purchased from XenoTech LLC (Kansas City, KS) and stored at −80°C. Microsomes from human B-lymphoblastoid cells containing cDNA-expressed human CYP isoforms (GENTEST, Woburn, MA) were obtained from Cambridge Bioscience (Cambridge, UK) and stored at −80°C. The samples of human B-lymphoblastoid cell microsomes comprised control cell microsomes (i.e., no transfected human cytochrome P-450 isoform cDNA but contain native CYP1A1 activity) and cell microsomes containing CYP1A2, CYP2A6 + OR [i.e., CYP2A6 cDNA plus human NADPH-cytochrome P-450 reductase (OR) cDNA], CYP2B6, CYP2C8 + OR, CYP2C9 + OR, CYP2C19, CYP2D6 + OR, CYP2E1 + OR, and CYP3A4 + OR.
Tramadol, Tramadol Metabolites, and Internal Standards.
Samples of tramadol, tramadol metabolites, and13C- and deuterium-labeled tramadol and tramadol metabolites [internal standards for liquid chromatography-mass spectrometry-mass spectrometry (LC-MS-MS) analysis] were supplied by Department of Pharmacokinetics and Drug Metabolism, Purdue Pharma L.P. (Ardsley, NY). The compounds (all hydrochlorides) supplied are listed in Table 1.
LC-MS-MS conditions employed for the analysis of tramadol, tramadol metabolites, and internal standards in incubation extracts
Human Liver Microsomes.
Samples of human liver (surplus to transplant requirements) were transported on ice to TNO BIBRA from other institutions and were stored at −80°C. Washed microsomal fractions were prepared in 0.154 M KCl containing 50 mM Tris-HCl, pH 7.4, as described previously (Lake, 1987). Liver microsomal fractions were assayed for total CYP content (Omura and Sato, 1964) and for protein (Lowry et al., 1951) using bovine serum albumin as standard. Microsomal fractions were diluted to 10 mg of protein/ml and aliquots stored at −80°C. Two separate batches, designated pools I and II, of pooled human liver microsomes were prepared. Each batch was prepared by pooling liver samples from five subjects. Pool I comprised liver samples from males aged 2.5 and 58 years and females aged 14, 59, and 74 years, whereas pool II comprised liver samples from male subjects aged 44 and 50 years and female subjects aged 11, 31, and 55 years. Microsomal NADPH-cytochromec reductase activity was determined at 37°C in cuvettes containing 0.4 mM NADPH (test cell only), 0.62 mg/ml cytochromec, 1.2 mM KCN, 20 to 50 μg of microsomal protein and 0.1 M phosphate buffer, pH 7.6, in a final volume of 2.5 ml. The rate of reduction of cytochrome c was monitored at 550 nm using an extinction coefficient of 21 mM−1cm−1.
Metabolism of Tramadol by Human Liver Microsomes.
The NADPH-dependent metabolism of tramadol was studied in incubation mixtures containing 5 to 5000 μM tramadol (added in 5 μl of methanol), 10 mM MgCl2, 2 mM EDTA, 80 mM phosphate buffer, pH 7.4, and 0.25 to 1.5 mg of microsomal protein in a final volume of 1 ml. After a 5-min preincubation at 37°C in a shaking water bath, the reaction was initiated by the addition of 1 mM NADPH. Incubations were performed for 3 to 30 min at 37°C and were terminated by the addition of 2 ml of ice-cold acetonitrile containing the 13C- and deuterium-labeled internal standards for LC-MS-MS analysis (see below). Blank incubations contained all components except NADPH, which was added after the reaction was terminated with acetonitrile. For each tramadol substrate concentration, incubation time, and microsomal protein concentration incubations were conducted in duplicate with either a single or a duplicate blank (no NADPH) tube. Apart from the studies with the CYP1A2 mechanism-based inhibitor furafylline (Newton et al., 1995), where dimethyl sulfoxide (DMSO) was used, methanol was used as the solvent for these investigations to minimize solvent effects on individual CYP isoforms (Chauret et al., 1998; Busby et al., 1999).
Tramadol metabolism to tramadol metabolites M1, M2, M3, and M5 was quantified by LC-MS-MS analysis. An HTS PAL autosampler (Presearch Ltd., Hitchin, Herts, UK) attached to an HP1100 series high-performance liquid chormatograph (Hewlett Packard Ltd., Bracknell, Berks, UK) were used to introduce samples into a Micromass Quattro LC triple quadrupole mass spectrometer (Micromass UK Ltd., Altrincham, Cheshire, UK) using an Electrospray Z-spray source. All incubations were terminated by the addition of two volumes of ice-cold acetonitrile containing 300 ng/ml of each of the 13C- and deuterium-labeled tramadol metabolite M1, M2, M3, and M5 internal standards. In preliminary experimentscis-tramadol-13C,-D3was also used as an internal standard. After vortex mixing and centrifugation at 5000g for 20 min at 4°C an aliquot of the supernatant was removed and appropriately diluted prior to analysis. For example, for all studies using a tramadol substrate concentration of 250 μM, samples were diluted with 1 volume of water and 8 volumes of 30% (v/v) acetonitrile in water. Chromatography of 20-μl aliquots of the diluted supernatants was performed with a 100 × 3.0 mm Kromasil C18 100Å 5-μm column (catalog no. 56105-078, Hypersil; Runcorn, Cheshire, UK) and isocratic elution with a mobile phase of 30% (v/v) acetonitrile in water, containing 0.1% (v/v) glacial acetic acid, at a flow rate of 0.3 ml/min and column temperature of 35°C. The eluate was passed directly into the triple quadrupole mass spectrometer operating in positive electrospray mode with probe and source block temperatures of 400 and 110°C, respectively, using nitrogen for desolvation and nebulization and a capillary voltage of 3.2 kV to initiate ionization. The compounds were selectively detected by multiple reaction monitoring using argon and quantitation was carried out against triplicate spiked aqueous standards at either four or six levels using the appropriate13C- and/or deuterium-labeled analog as internal standard for each analyte and a calibration curve produced for each metabolite. Table 1 shows the retention time, multiple reaction monitoring function, cone voltage, and collision energy for each compound analyzed.
Kinetics of Tramadol Metabolism.
Kinetic data were analyzed by Michaelis-Menten and Eadie-Hofstee plots. Inspection of Eadie-Hofstee plots revealed that multiple enzymes were involved in the metabolism of tramadol to both tramadol metabolites M1 and M2. Kinetic analysis was performed by inspection of the Eadie-Hofstee plots and considering the data as biphasic kinetics with both high-affinity and low-affinity enzymes. For the high-affinity enzyme, Km andVmax values were calculated directly from the Eadie-Hofstee plots. Additional calculations were performed to calculate the contribution of the high-affinity enzyme to the low-affinity enzyme kinetic plot. The following equation was used:
Tramadol Metabolism Correlation Analysis.
Incubation mixtures contained 250 μM tramadol (added in 5 μl of methanol), 10 mM MgCl2, 2 mM EDTA, 0.4 mg of microsomal protein, and 87 mM phosphate buffer, pH 7.4, in a final volume of 1 ml. After a 5-min preincubation at 37°C in a shaking water bath, the reaction was initiated by addition of 1 mM (final concentration) NADPH. Incubations were conducted in triplicate with a single blank (no NADPH) for each of the 16 preparations of characterized human liver microsomes and were terminated after 5 min by addition of 2 ml of ice-cold acetonitrile containing the13C- and deuterium-labeled tramadol metabolite M1, M2, M3, and M5 internal standards. Incubations were processed for LC-MS-MS analysis as described above.
Tramadol Metabolism by cDNA-Expressed CYP Isoforms.
A 100 mM stock solution of tramadol in methanol was diluted to 333 μM with 100 mM phosphate buffer, pH 7.4. Incubation mixtures contained 250 μM tramadol (added as 187.5 μl of 333 μM tramadol), 10 mM MgCl2, 2 mM EDTA, 1 mM NADPH, and 80 mM phosphate buffer in a final volume of 0.25 ml. After 5-min preincubation in a 37°C water bath, the reaction was initiated by adding 0.25 mg of B-lymphoblastoid cell microsomal protein with gentle mixing. The incubations were conducted in duplicate with a single blank (no microsomes) for each CYP isoform preparation. Reactions were terminated after either 5 or 30 min with 0.5 ml of ice-cold acetonitrile containing the 13C- and deuterium-labeled tramadol metabolite M1, M2, M3, and M5 internal standards. Incubations were processed for LC-MS-MS analysis as described above.
Tramadol Metabolism Inhibition Studies.
For the mechanism-based inhibitors requiring preincubation with NADPH, incubation mixtures contained 10 mM MgCl2, 2 mM EDTA, 1 mM NADPH, 85 mM phosphate buffer, pH 7.4, 0.5 mg of pool II microsomal protein, and either 5 to 50 μM furafylline, 5 to 100 μM diethyldithiocarbamate, or 5 to 100 μM troleandomycin in a volume of 0.945 ml. The inhibitors were added in either methanol (5 μl/tube) or DMSO (furafylline only, 5 μl/tube) and the concentrations refer to the final concentrations in a 1-ml incubation. Following a 30-min preincubation at 37°C in a shaking water bath, 250 μM tramadol (added in 5 μl of methanol) and 1 mM NADPH (final concentration 2 mM) were added. Incubations were performed for 5 min at 37°C and were terminated by the addition of 2 ml of ice-cold acetonitrile containing the 13C- and deuterium-labeled tramadol metabolite M1, M2, M3, and M5 internal standards. All test incubations were performed in either triplicate (no inhibitor added controls, but with either 5 μl of methanol or 5 μl of DMSO) or duplicate (for each concentration of each inhibitor), with single blank tubes where tramadol was added after the ice-cold acetonitrile. Incubations were processed for LC-MS-MS analysis as described above.
For the compounds not requiring extensive preincubation with NADPH, incubation mixtures contained 10 mM MgCl2, 2 mM EDTA, 1 mM NADPH, 0.5 mg of pool II microsomal protein, 85 mM phosphate buffer, pH 7.4, and either 2 to 50 μM sulfaphenazole, 2 to 20 μM quinidine, or 50 to 500 μM S-mephenytoin in a volume of 0.995 ml. All the inhibitors were added in methanol (5 μl/tube) and the concentrations refer to the final concentrations in a 1-ml incubation. Following a 10-min preincubation at 37°C in a shaking water bath, the reaction was initiated by the addition of 250 μM tramadol (added in 5 μl of methanol). Incubations were performed for 5 min at 37°C and were terminated by the addition of 2 ml of ice-cold acetonitrile containing the 13C- and deuterium-labeled tramadol metabolite M1, M2, M3, and M5 internal standards. All test incubations were performed in either triplicate (no inhibitor added but containing 5 μl of methanol/tube) or duplicate (for each concentration of each inhibitor), with single blank tubes where tramadol was added after the ice-cold acetonitrile. Incubations were processed for LC-MS-MS analysis as described above.
Results
Metabolism of Tramadol by Human Liver Microsomes.
Tramadol was metabolized by human liver microsomes in the presence of NADPH to all four available tramadol metabolites. While M1 and M2 were major metabolites of tramadol in human liver microsomes, M3 and M5 represented only minor metabolites. Some representative data for tramadol metabolism to metabolites M1, M2, M3, and M5 are shown in Table 2. Under the incubation conditions selected, tramadol metabolism to either metabolite M3 or metabolite M5 was always ≤3.0% of total tramadol metabolism (i.e., the sum of formation of M1, M2, M3, and M5).
Tramadol metabolism to tramadol metabolites M1, M2, M3, and M5 in human liver microsomes
The linearity of 500 μM tramadol metabolism with respect to both incubation time and microsomal protein concentration was investigated using the pool I microsomal preparation. This substrate concentration was selected as being around 2 times the Kmvalue for tramadol O-demethylation (i.e., M1 formation) reported in a previous study (Paar et al., 1992). Time dependence was assessed with seven time points (0–20 min), whereas tissue concentration was assessed with five microsomal protein concentrations (0–1.5 mg of protein/incubation). Tramadol metabolism to both M1 and M2 was found to be essentially linear (data not shown) with respect to incubation time (up to at least 6 min) and protein concentration (up to at least 1.0 mg of protein/ml). In contrast, tramadol metabolism to the two secondary metabolites, namely, M3 and M5, exhibited poor linearity (data not shown). The linearity of tramadol metabolism to metabolites M1 and M2 was also investigated with the pool II microsomal preparation. The formation of M1 and M2, but not M3 and M5, was found to be linear with respect to incubation time and microsomal protein concentration, except that this preparation was less active than the pool I preparation (data not shown). The total CYP content of the pool I and II microsomal preparations was determined to be 0.72 and 0.51 pmol/mg of protein, respectively, whereas NADPH-cytochrome creductase activities were determined to be 356 and 348 nmol/min/mg of protein, respectively.
Kinetics of Tramadol Metabolism in Human Liver Microsomes.
The kinetics of the NADPH-dependent metabolism of 5 to 5000 μM tramadol to metabolites M1 and M2 was examined with both the pool I and pool II human liver microsomal preparations. Because both metabolites M3 and M5 each constituted ≤3.0% of total tramadol metabolism in human liver microsomes, it was not considered necessary to investigate the kinetics of formation of these two metabolites. Pooled, rather than individual, liver microsomal preparations were used for these studies, because the aim was to identify average Kmvalues to select a suitable substrate concentration for the reaction phenotyping studies, rather than to evaluate any interindividual variability in Km values for M1 and M2 formation. With both liver microsome pools, M1 and M2 were detected at all tramadol substrate concentrations examined (Fig.2). Figure 2 also demonstrates that while M1 is the major metabolite formed at low tramadol substrate concentrations, M2 formation predominates at high substrate concentrations. In keeping with the higher total CYP content, the pool I liver microsome preparation was more active than the pool II microsomal preparation in catalyzing M1 and M2 formation.

Metabolism of tramadol to tramadol metabolites M1 and M2 in human liver microsomes.
The metabolism of 5 to 5000 μM tramadol to M1 and M2 was studied with the pool I (A) and II (B) human liver microsomal preparations. Incubations were performed with 0.5 mg of microsomal protein for 5 min. Results are presented as the mean of a duplicate test and a duplicate blank incubation.
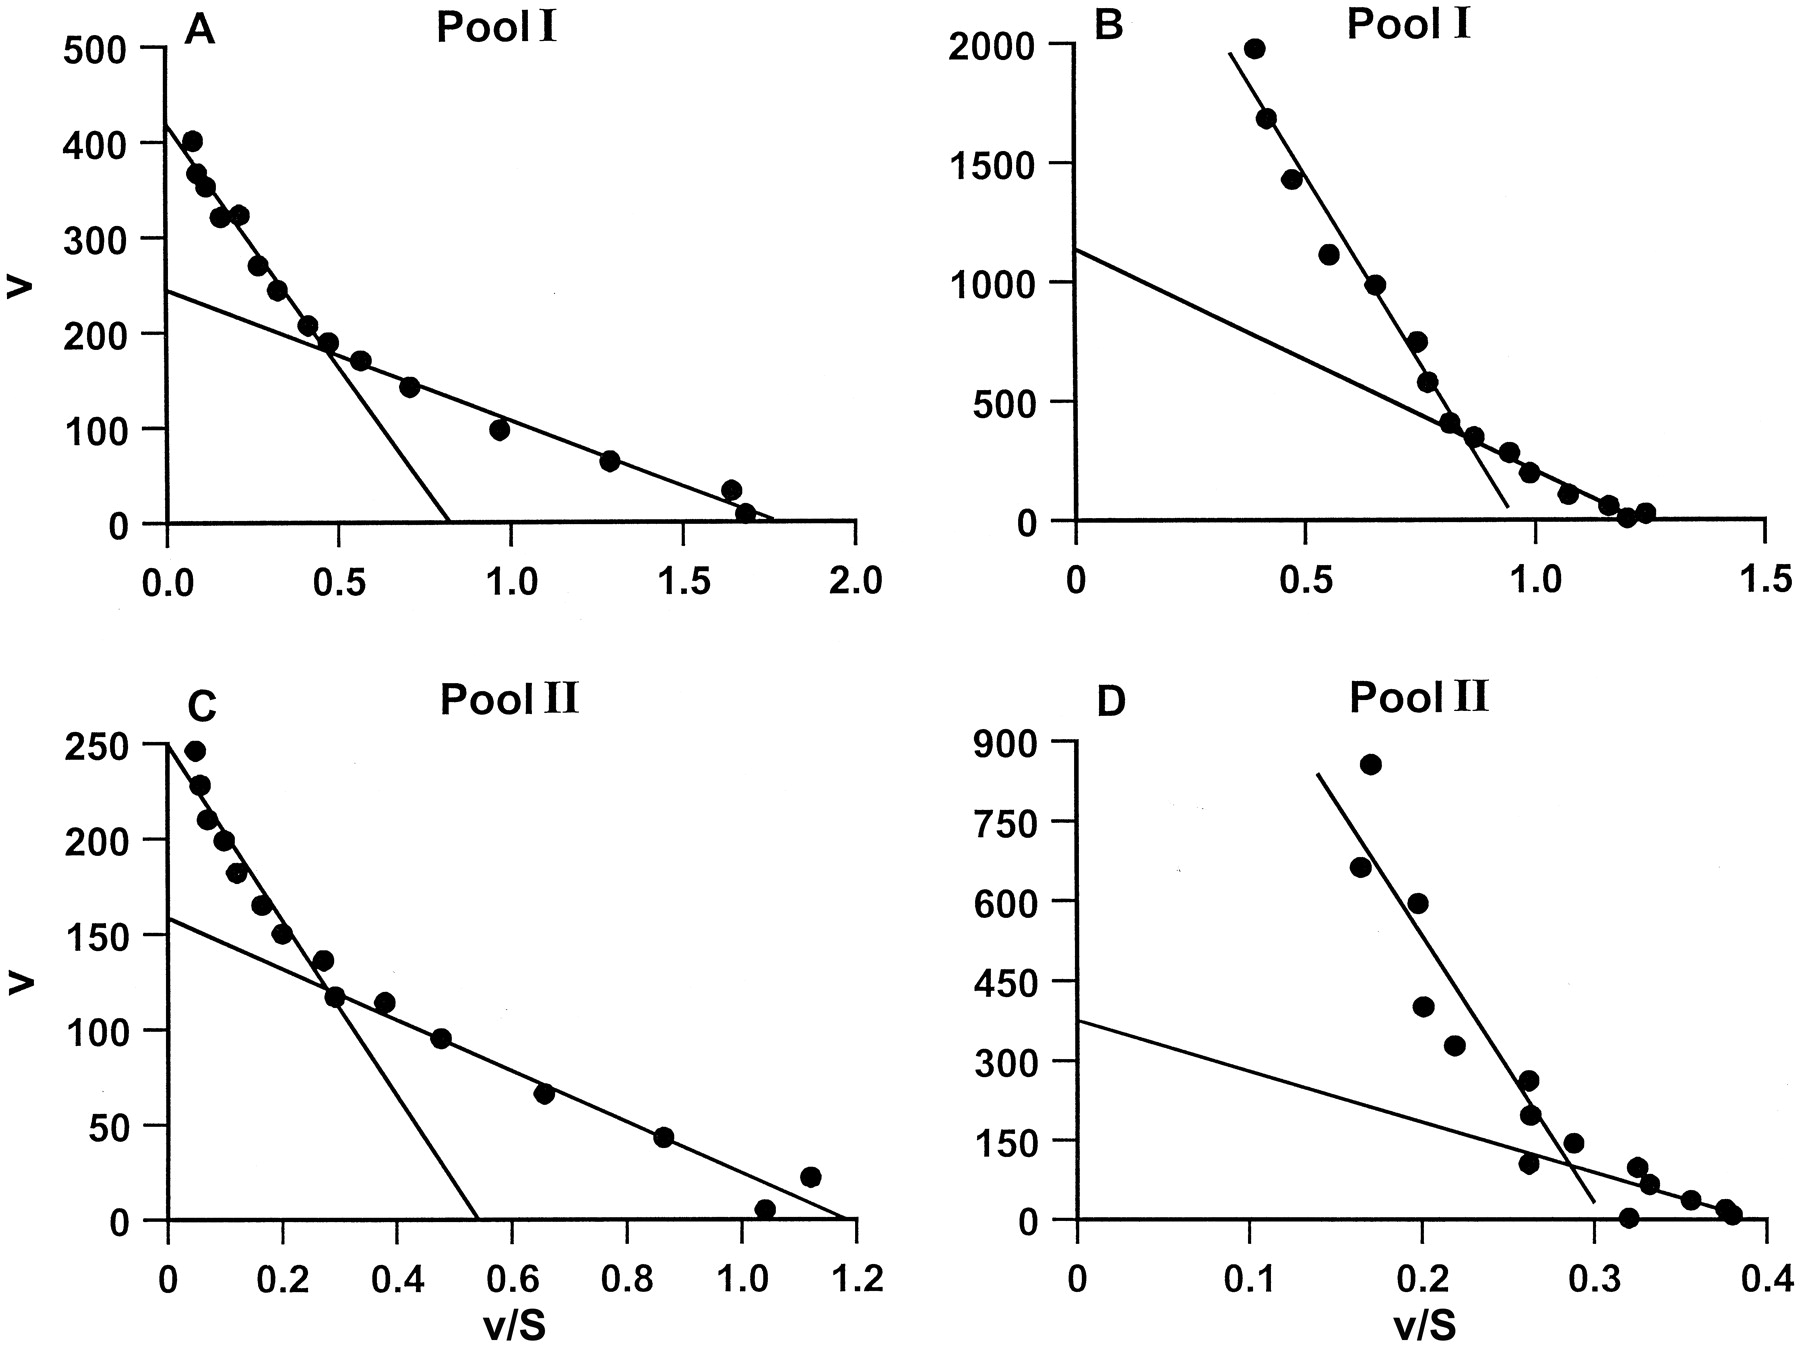
The kinetics of tramadol metabolism to M1 and M2 was examined by both Eadie-Hofstee and Michaelis-Menten plots. With both pools of human liver microsomes, analysis of Eadie-Hofstee plots revealed that multiple enzymes were involved in the metabolism of tramadol to metabolite M1 (Fig. 3, A and C) and to metabolite M2 (Fig. 3, B and D). However, Eadie-Hofstee plots of the corrected low-affinity enzyme data were not linear and hence noKm and Vmaxvalues could be calculated. As an alternative approach a modified Michaelis-Menten equation (see Experimental Procedures) was used to try to obtain estimates ofKm and Vmax. However, inspection of the plots obtained indicated that the low-affinity enzymes involved in M1 and M2 formation were not saturated over the range of tramadol substrate concentrations used. For the low-affinity enzymes involved in M1 and M2 formation CLint values were calculated (seeExperimental Procedures).

Kinetics of tramadol metabolism to tramadol metabolites M1 and M2 in human liver microsomes.
Eadie-Hofstee plots of 5 to 5000 μM tramadol metabolism to M1 (A and C) and M2 (B and D) was studied with the pool I (A and B) and II (C and D) human liver microsomal preparations. For other details see Fig. 2.
The results of the kinetic analysis of tramadol metabolism to M1 and M2 by the two pools of human liver microsomes examined are shown in Table3. For the high-affinity enzyme involved in M1 formation Km values of 105 and 126 μM were observed with the pool I and II liver microsomal preparations, respectively. These Km values are similar to the value of 210 μM reported by Paar et al. (1992) for a preparation of human liver microsomes obtained from a single donor. Overall, for both liver microsome pools, meanKm values of 116 and 1021 μM were calculated for the high-affinity enzymes responsible for M1 and M2 formation, respectively. For the high- and low-affinity enzymes involved in M1 and M2 formation, CLint values were 1.47 and 0.048 μl/min/mg of protein and 0.69 and 0.112 μl/min/mg of protein, respectively (Table 3).
Kinetic analysis of tramadol metabolism to tramadol metabolites M1 and M2 in two preparations of human liver microsomes
A tramadol substrate concentration of 250 μM was selected for the reaction phenotyping studies described below. This substrate concentration was selected as being approximately 2 times theKm value for M1 formation by the high-affinity enzyme (Table 3).
Tramadol Metabolism Correlations Analysis.
The metabolism of 250 μM tramadol to tramadol metabolites M1 and M2 was examined with a characterized panel of 16 human liver microsomal preparations. Although tramadol metabolism to the secondary metabolites M3 and M5 was not necessarily linear under the incubation conditions selected, the levels of these two minor tramadol metabolites were also quantified in the incubation extracts. Tramadol was metabolized to M1 and M2 by all 16 human liver microsomal preparations examined (Fig.4A). Compared with M1 and M2 formation, much smaller amounts of the secondary metabolites M3 and M5 were observed in 14 of the 16 human liver microsomal preparations examined (Fig. 4B).
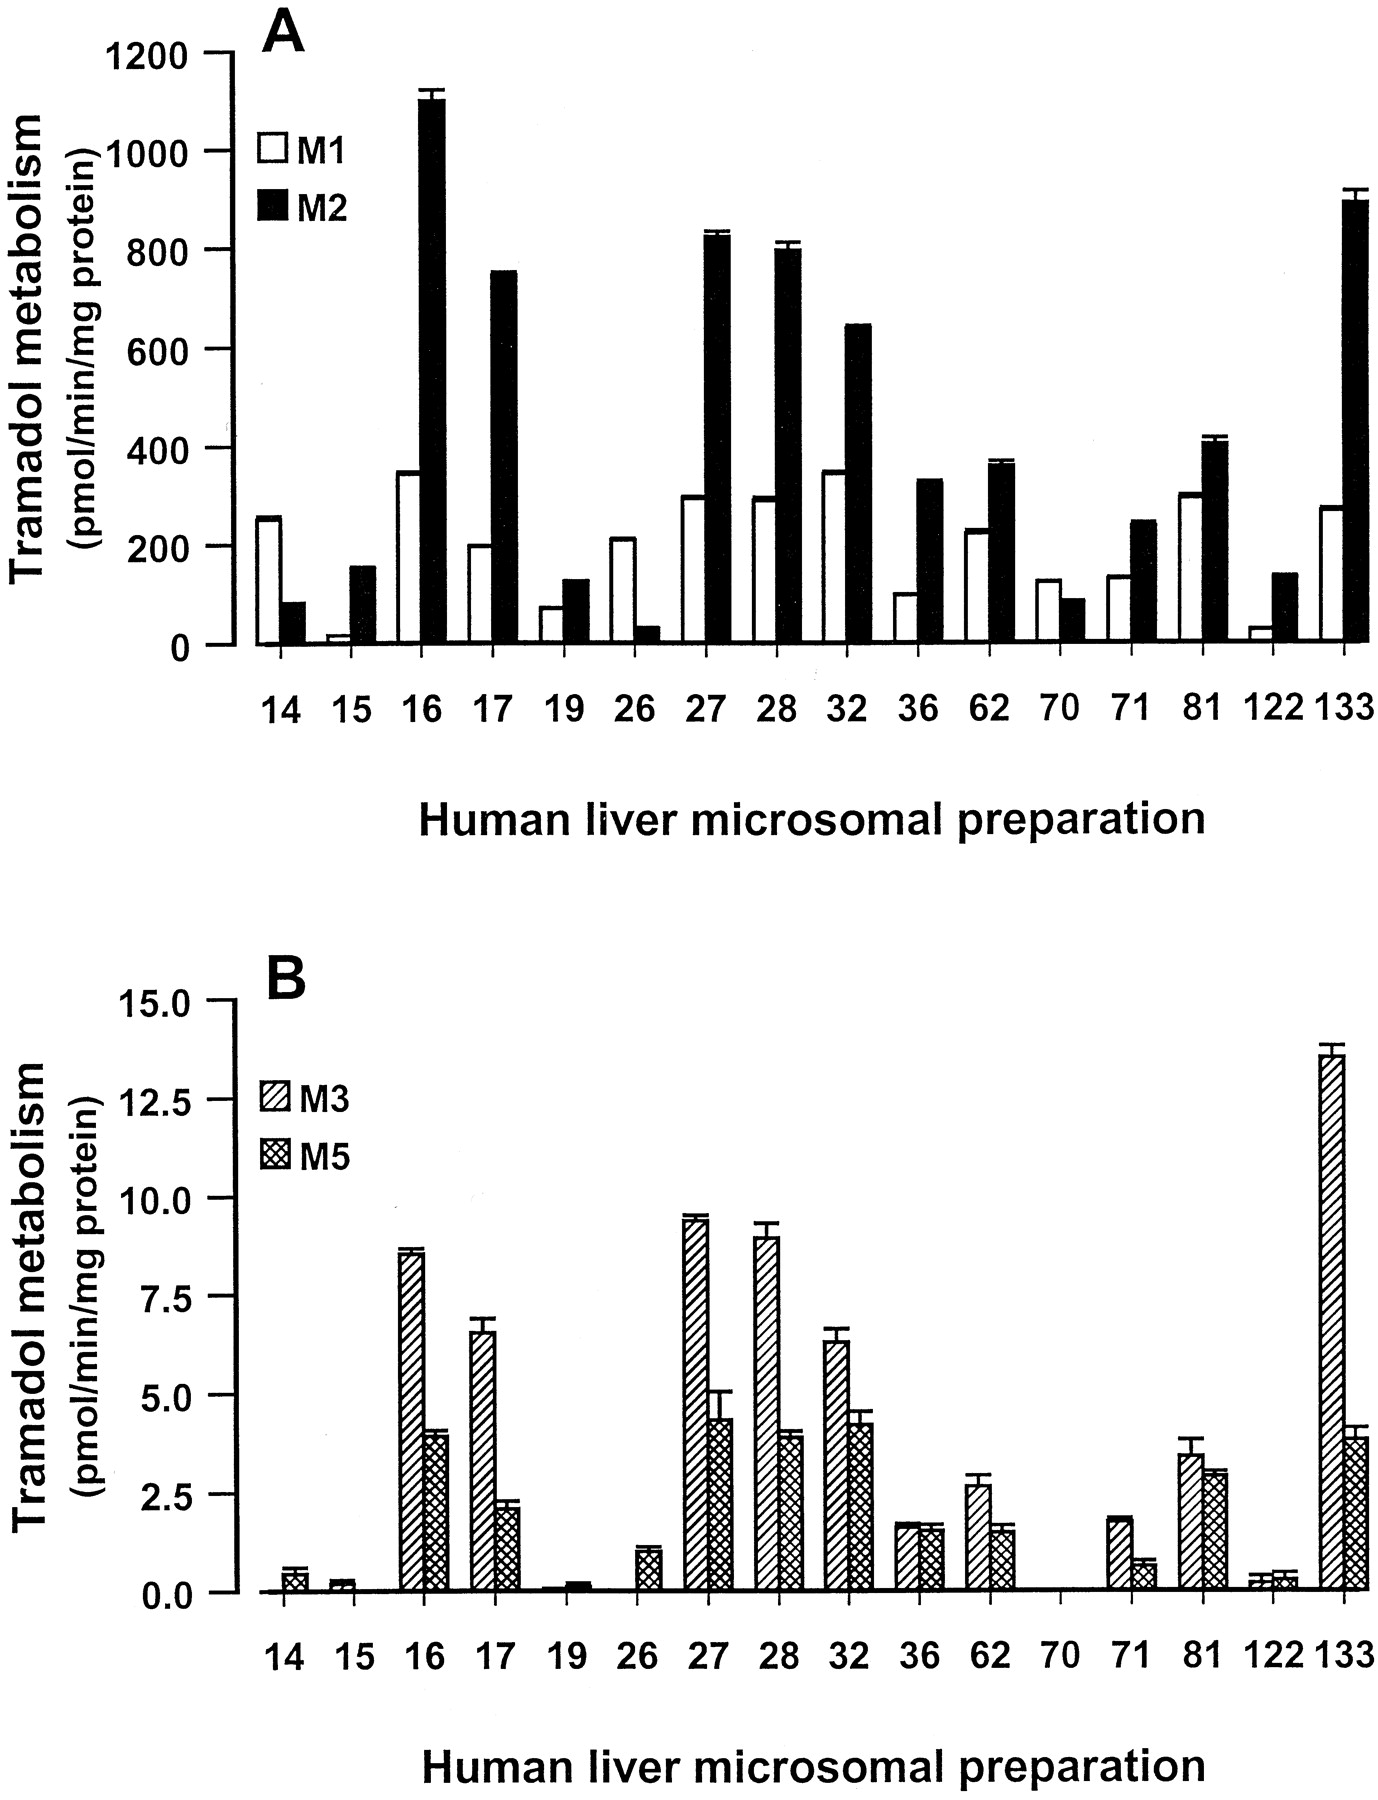
Metabolism of tramadol to tramadol metabolites M1, M2, M3, and M5 in a panel of 16 characterized human liver microsomal preparations.
The metabolism of 250 μM tramadol to M1 and M2 (A) and M3 and M5 (B) was studied. Incubations were performed with 0.4 mg of microsomal protein for 5 min. Results are presented as the mean ± S.E. of triplicate test incubations.
The rates of tramadol metabolism to M1, M2, M3, and M5 were correlated with data for total CYP content and a range of CYP isoform enzyme activities (Table 4). For tramadol metabolism to M1 the best correlation (r2 = 0.676) was observed with the CYP2D6 isoform marker dextromethorphan O-demethylase activity (Table 4). A lower correlation (r2 = 0.380) was observed with the CYP2B6 marker S-mephenytoin N-demethylase. In contrast, for M2 formation the best correlation (r2 = 0.748) was observed withS-mephenytoin N-demethylase activity. Lower correlations were observed with the CYP2C8 marker (r2 = 0.454) taxol 6α-hydroxylase and the CYP3A4 marker (r2 = 0.290) testosterone 6β-hydroxylase. For both M1 and M2 formation and total CYP content and CYP isoform markers for CYP1A2, CYP2A6, CYP2C9, CYP2C19, CYP2E1, and CYP4A9/11, r2values of 0.0004 to 0.217 were observed (Table 4). These enzyme activities comprised 7-ethoxyresorufin O-deethylase, coumarin 7-hydroxylase, diclofenac 4′-hydroxylase,S-mephenytoin 4′-hydroxylase, chlorzoxazone 6-hydroxylase, and lauric acid 12-hydroxylase. For the secondary tramadol metabolites M3 and M5 some apparent correlations (r2 = 0.357–0.601) were observed withS-mephenytoin N-demethylase and taxol 6α-hydroxylase activities (Table 4).
Correlation analysis for tramadol metabolism to tramadol metabolites M1, M2, M3 and M5 with various CYP isoform dependent enzyme activities in human liver microsomes
Metabolism of Tramadol by cDNA-Expressed CYP Isoforms.
The metabolism of 250 μM tramadol by B-lymphoblastoid cell microsomes containing cDNA-expressed CYP1A2, CYP2A6, CYP2B6, CYP2C8, CYP2C9, CYP2C19, CYP2D6, CYP2E1, and CYP3A4, together with microsomes from control cells (which contain native CYP1A1), was studied. Only trace amounts of tramadol metabolites were observed in incubations with the control cell microsomes (data not shown) and with the cDNA-expressed CYP2A6, CYP2C8, and CYP2E1 preparations (Fig.5). While tramadol metabolism to M1 was greatest with the cDNA-expressed CYP2D6 preparation, M2 formation was greatest with the cDNA-expressed CYP2B6 preparation (Fig. 5A). Tramadol was also metabolized to M1 by the CYP2B6 preparation and to M2 by the CYP2D6 and CYP3A4 preparations. Only low rates of tramadol metabolism to either M1 or M2 were observed with the cDNA-expressed CYP1A2, CYP2C9, and CYP2C19 preparations (Fig. 5A). Low rates of tramadol metabolism to M3 were observed with the CYP2B6 and CYP3A4 preparations, with a low rate of M5 formation being catalyzed by the CYP2D6 preparation (Fig. 5B).

Metabolism of tramadol to tramadol metabolites M1 and M2 by cDNA-expressed human CYP isoforms.
The metabolism of 250 μM tramadol by cDNA-expressed CYP isoforms to M1 and M2 (A) and M3 and M5 (B) was studied. Incubations were performed with 0.25 mg of B-lymphoblastoid cell microsomal protein for either 5 min (CYP2B6, CYP2D6, and CYP3A4) or 30 min (all other CYP isoforms). Results are presented as the mean of a duplicate test and a single blank incubation.
Inhibition of Tramadol Metabolism.
The effect of some human CYP isoform inhibitors and one CYP isoform substrate (S-mephenytoin) on the metabolism of 250 μM tramadol to metabolites M1 and M2 in human liver microsomes was studied. Because of the low rates of formation of M3 and M5, it was not possible to evaluate the effects of the test compounds on these two tramadol secondary metabolites. For the mechanism-based inhibitors (Newton et al., 1995) furafylline (CYP1A2), diethyldithiocarbamate (CYP2E1), and troleandomycin (CYP3A4), the compounds were preincubated for 30 min at 37°C with liver microsomes and NADPH prior to the addition of tramadol and a further aliquot of NADPH. In the studies with the inhibitors sulfaphenazole (CYP2C9) and quinidine (CYP2D6) and the substrate S-mephenytoin (CYP2C19), the compounds were preincubated with liver microsomes and NADPH for 10 min at 37°C prior to the addition of tramadol.
Tramadol metabolism to M1 was not markedly affected by 5 to 100 μM troleandomycin (Fig. 6A). While 5 to 50 μM furafylline and 5 to 100 μM diethyldithiocarbamate inhibited M1 formation to some extent at high concentrations, little effect was observed with low concentrations of these two inhibitors (Fig. 6A). The addition of 2 to 20 μM quinidine markedly inhibited tramadol metabolism to M1 to 14 to 23% of control (Fig. 6C). In contrast, neither 2 to 50 μM sulfaphenazole nor 50 to 500 μMS-mephenytoin had any marked effect on M1 formation (Fig.6C).

Inhibition of tramadol metabolism to tramadol metabolites M1 and M2 in human liver microsomes.
The effects of the mechanism-based inhibitors (A and B) 5 to 50 μM furafylline (●), 5 to 100 μM diethyldithiocarbamate (▾), and 5 to100 μM troleandomycin (♦), together with (C and D) 2 to 50 μM sulfaphenazole (▴), 50 to 500 μM S-mephenytoin (▪), and 2 to 20 μM quinidine (★) were evaluated on the metabolism of 250 μM tramadol to M1 (A and C) and M2 (B and D) in human liver microsomes. Incubations were performed with 0.5 mg of pool II microsomal protein for 5 min. Each point represents the mean of a duplicate test and a single blank incubation.
Tramadol metabolism to M2 was inhibited to 33 to 44% of control by 5 to 100 μM troleandomycin (Fig. 6B). In contrast, while 5 to 50 μM furafylline had no effect on M2 formation, 5 to 100 μM diethyldithiocarbamate resulted in some inhibition of high concentrations. While 2 to 50 μM sulfaphenazole inhibited M2 formation to some extent at high concentrations, neither 2 to 20 μM quinidine nor 50 to 500 μM S-mephenytoin had any marked effect on M2 formation (Fig. 6D).
Discussion
In this study the metabolism of cis-tramadol by human hepatic microsomal fractions and cDNA-expressed human hepatic CYP isoforms has been investigated. The formation of the major tramadol metabolites M1 and M2 was observed in two preparations of pooled liver microsomes and in 16 individual preparations. In addition, two minor secondary metabolites (each ≤3.0% of total metabolism), namely, M3 and M5 were also observed in the majority of the human liver microsomal preparations examined. Tramadol can thus be metabolized in human liver by either single or multiple O- andN-demethylations (Fig. 1).
For both M1 and M2 formation in human liver microsomes, biphasic Eadie-Hofstee plots were obtained, indicating the participation of more than one CYP isoform in these pathways of tramadol metabolism. The kinetic data were considered as biphasic plots with both high-affinity and low-affinity enzymes. Over a substrate concentration range of 5 to 5000 μM mean Km values of 116 and 1021 μM were obtained for the high-affinity enzymes responsible for M1 and M2 formation, respectively (Table 3). While the meanKm value of 116 μM for M1 formation is similar to the value of 210 μM reported by Paar et al. (1992) for metabolism of both (−)- and (+)-tramadol to M1, these studies only reported monophasic kinetics. However, in agreement with the present study, Paar et al. (1992) did observe biphasic kinetics for M2 formation although no Km values were reported. In the present study, the lowerKm value for the high-affinity component of M1 formation compared with M2 formation (i.e., 116 compared with 1021 μM) is in agreement with the observation that in most subjects larger quantities of M1 are formed after oral administration of tramadol (Lintz et al., 1981; Paar et al., 1997).
To identify the CYP isoform responsible for tramadol metabolism, “reaction phenotyping” was performed by correlation analysis with a panel of characterized microsomal preparations, chemical inhibition, and the use of cDNA-expressed human CYP isoforms. Acis-tramadol substrate concentration of 250 μM was selected as being approximately 2 times theKm for the high-affinity enzyme responsible for M1 formation.
The metabolism of cis-tramadol was examined in a panel of 16 characterized human liver microsomal preparations. Good correlations were obtained between M1 formation and dextromethorphanO-demethylase (r2 = 0.676) and between M2 formation and S-mephenytoinN-demethylase (r2 = 0.748). These two enzyme activities are considered to be markers for CYP2D6 and CYP2B6, respectively, in human liver microsomes (Heyn et al., 1996;Parkinson, 1996; Clarke, 1998; Pelkonen et al., 1998; Lewis et al., 1999). Some lower correlations between either M1 or M2 formation and enzymatic markers for CYP2C8 and CYP3A4 were also observed (Table 4).
The conclusions of the correlation analysis study are supported by the results of the chemical inhibition studies. Previous studies have demonstrated that furafylline, sulfaphenazole,S-mephenytoin, quinidine, diethyldithiocarbamate, and troleandomycin may be considered either inhibitors or substrates of CYP1A2, CYP2C9, CYP2C19, CYP2D6, CYP2E1, or CYP3A4, respectively (Newton et al., 1995; Ono et al., 1996; Parkinson, 1996; Clarke, 1998;Pelkonen et al., 1998; Rodrigues, 1999). Tramadol metabolism to M1 was inhibited to 14 to 23% of control by the CYP2D6 inhibitor quinidine, whereas M2 formation was inhibited to 33 to 44% of control by the CYP3A4 mechanism-based inhibitor troleandomycin (Fig. 6, B and C). In contrast, the inhibitors or substrate of CYP1A2, CYP2C9, CYP2C19, and CYP2E1 studied had no marked effect on tramadol metabolism to either M1 or M2. The effect of a chemical inhibitor of CYP2B6 was not evaluated in this study, although S-mephenytoin, which is metabolized to different products by CYP2B6 and CYP2C19 (Relling et al., 1989; Heyn et al., 1996; Parkinson, 1996; Clarke, 1998; Pelkonen et al., 1998), had no marked effect on either M1 or M2 formation. The lack of a marked effect of S-mephenytoin on CYP2B6-catalyzedcis-tramadol metabolism to M2 in this study is probably attributable to the Km value for CYP2B6-catalyzed S-mephenytoin N-demethylase. Other studies have demonstrated that while theKm value for CYP2C19-catalyzedS-mephenytoin 4′-hydroxylase in human liver microsomes is around 60 to 65 μM, the Km value for CYP2B6-catalyzed S-mephenytoin N-demethylase has been reported to be 805 μM (Relling et al., 1989; Heyn et al., 1996;Pelkonen et al., 1998). Thus, over the 50 to 500 μM concentration range studied, S-mephenytoin would not have been expected to have a marked effect on CYP2B6-catalyzed cis-tramadol metabolism to M2.
cis-Tramadol was metabolized to M1 and M2 by some of the cDNA-expressed human CYP isoforms examined. CYP2D6 was the major CYP isoform catalyzing M1 formation, whereas CYP2B6 and CYP3A4 were the major isoforms catalyzing M2 formation (Fig. 5). In contrast, cDNA-expressed CYP1A2, CYP2C9, and CYP2C19 only catalyzed low rates of M1 and M2 formation. For M2 formation the CYP2B6 preparation exhibited a higher specific activity than the CYP3A4 preparation. However, the levels of CYP3A4 in human liver microsomes have been reported to range from 44 to 250 pmol/mg of protein, whereas those for CYP2B6 have been reported to range from only 1 to 39 pmol/mg of protein (Lecoeur et al., 1994; Shimada et al., 1994; Imaoka et al., 1996; Rodrigues, 1999). Thus, assuming these two CYP isoforms have similar affinities (i.e.,Km values) for tramadol, M2 formation may be predominantly catalyzed by CYP3A4 in human liver microsomes.
This study demonstrates that multiple CYP isoforms are responsible forcis-tramadol metabolism in human liver. Clearly, tramadol metabolism to tramadol metabolite M1 is primarily catalyzed by CYP2D6 and this finding is in agreement with other in vivo and in vitro studies on tramadol metabolism and the effect of quinidine inhibition (Paar et al., 1992, 1997; Dayer et al., 1994; Poulsen et al., 1996). From the correlation analysis and cDNA-expressed CYP isoform data, CYP2B6 may have a minor role in M1 formation in human liver, with very low levels of activity being catalyzed by CYP1A2, CYP2C9, and CYP2C19. While CYP2D6 appears to be the high-affinity enzyme catalyzing M1 formation in human liver microsomes, additional studies would be required to identify the low-affinity enzyme(s) responsible for M1 formation.
Unlike M1, the major CYP isoforms involved in M2 formation appear to be CYP2B6 and CYP3A4. Additional kinetic studies would be required to identify the high-and low-affinity enzymes catalyzing M2 formation in human liver microsomes. From the present data CYP2B6 may constitute a high-affinity enzyme, whereas the high levels of CYP3A4 in human liver (Lecoeur et al., 1994; Shimada et al., 1994; Imaoka et al., 1996;Rodrigues, 1999) would imply that this CYP isoform would also contribute to M2 formation, particularly in subjects with either low or absent levels of CYP2B6 (Mimura et al., 1993; Code et al., 1997;Shimada et al., 1997). Based on the cDNA-expressed CYP isoform data, CYP2D6 may have a minor role in M2 formation, with very low levels of activity being catalyzed by CYP1A2, CYP2C9, and CYP2C19. While some correlation (r2 = 0.454) was observed between CYP2C8-catalyzed taxol 6α-hydroxylase activity and M2 formation, this finding was not supported by cDNA-expressed CYP isoform studies where only a very low rate of M2 formation was observed with the CYP2C8 preparation.
Some preliminary information was also obtained on the CYP isoforms involved in M3 and M5 formation. However, only tentative conclusions can be drawn from the present data because M3 formation is dependent on the amount of M2 produced and M5 formation is dependent on the production of both M1 and M2. In addition, under the incubation conditions used M3 and M5 formation was not necessarily linear with respect to incubation time and microsomal protein concentration. Based on the observations that CYP2D6 primarily catalyzes tramadolO-demethylation, whereas CYP2B6 and CYP3A4 primarily catalyze N-demethylation, CYP2D6 would be expected to participate in M5 formation from M2. In addition, CYP2B6 and CYP3A4 would be expected to participate in M1 metabolism to M5 and M2 metabolism to M3. Additional studies, including using M1 and M2 as substrates, would be required to fully elucidate the CYP isoforms involved in M3 and M5 formation.
In summary, cis-tramadol can be metabolized to tramadol metabolites M1, M2, M3, and M5 in human liver microsomal preparations. While M1 and M2 constitute major primary metabolites, M3 and M5 are only minor secondary metabolites. By kinetic analysis and the results of the reaction phenotyping studies, tramadol metabolism in human liver is catalyzed by multiple CYP isoforms. While CYP2D6 is primarily responsible for M1 formation, M2 formation is catalyzed by CYP2B6 and CYP3A4.
Footnotes
-
↵1 Present address: R. W. Johnson Pharmaceutical Research Institute, P.O. Box 300, Raritan, NJ 08869
-
This work was supported by a research grant from Purdue Pharma L.P., Ardsley, NY.
- Abbreviations used are::
- M1
- O-desmethyl-cis-tramadol
- M2
- N-desmethyl-cis-tramadol
- M3
- N,N-didesmethyl-cis-tramadol
- M4
- N,N,O-tridesmethyl-tramadol
- M5
- N,O-didesmethyl-cis-tramadol
- CYP
- cytochrome P-450
- +OR
- plus human NADPH-cytochrome P-450 reductase
- LC-MS-MS
- liquid chromatography-mass spectrometry-mass spectrometry
- DMSO
- dimethyl sulfoxide
- CLint
- intrinsic clearance
- Received February 26, 2001.
- Accepted May 7, 2001.
- The American Society for Pharmacology and Experimental Therapeutics


