


Abstract
Digoxin, a substrate of P-glycoprotein (Pgp) and cytochrome P450 3a (Cyp3a), was used to illustrate the inductive effects of pregnenolone-16α-carbonitrile (PCN), a ligand of the pregnane X receptor, on the absorption and disposition of [3H]digoxin in the vascularly perfused rat small intestine preparation. Although increased Cyp3a protein was observed with Western blotting analysis after PCN treatment, metabolism of digoxin to the digoxigenin bis-digitoxoside metabolite in the rat small intestine remained insignificant (<4% dose). PCN pretreatment significantly decreased blood perfusate [3H]digoxin concentrations for both systemic and intraluminal administrations of [3H]digoxin due to increased Pgp levels. The apical secretion by Pgp increased at 90 min with PCN treatment, from 11.2 ± 5.1% of dose to 20.1 ± 8.6% of dose after systemic administration of [3H]digoxin; this increase was, however, statistically insignificant (P = 0.13) because of the high variability among preparations. When the composite data for the control and PCN-treated preparations were fit to published physiologically based pharmacokinetic models: the traditional model and the segregated flow model, suboptimal parameters were obtained. The data were further fit to expanded models with a bilayer membrane compartment housing the Pgp adjacent to the apical membrane, or an unstirred water layer (UWL) external to the apical membrane. The models with the UWL yielded improved fits and reasonable parameters associated with digoxin absorption, suggesting that the UWL posed as a barrier for digoxin absorption. Similar results were obtained with the segmental models (the segmental traditional model and the segmental segregated flow model) using the UWL, when heterogeneous distributions of Pgp in the duodenum, jejunum, and ileum were considered.
The contribution of the gastrointestinal tract in first-pass metabolism is well documented. In addition to the liver, intestinal efflux and metabolism are recognized as important factors contributing to poor oral absorption and low bioavailability (Watkins, 1997; Kim et al., 1998; Suzuki and Sugiyama, 2000; Pang, 2003). Digoxin, one of the most studied compounds due to its narrow therapeutic index, is a well known substrate of P-glycoprotein (Pgp) and is also metabolized by cytochrome P450 3a (Cyp3a) by the rat liver (Salphati and Benet, 1999). In humans, Pgp is located on the bile canalicular surface of hepatocytes, the apical surface of proximal tubules in kidneys, the epithelium of the intestine, and capillary endothelial cells of brain and testis (Thiebaut et al., 1987). Pgp functions as a biological barrier by extruding toxic substances and xenobiotics out of cells (Su and Huang, 1996; Greiner et al., 1999; Lin et al., 1999; Sababi et al., 2001). CYP3A4 and Pgp are believed to play competing roles in drug absorption, metabolism, and elimination (Pang, 2003). Because many prototypic inhibitors and inducers affect both the enzyme and Pgp, significant drug-drug interactions for digoxin that involve one or both of these systems have been reported (Su and Huang, 1996; Greiner et al., 1999; Drescher et al., 2003; Funakoshi et al., 2003).
In the intestine, Pgp is capable of mediating substantial drug efflux of the absorbed drug back to the lumen, whereas CYP3A4 may metabolize the drug within the enterocytes, hence delimiting oral bioavailability in humans (Cummins et al., 2003; Drescher et al., 2003; Pang, 2003). Both Pgp and CYP3A4 are under regulation by the pregnane X receptor (Kliewer et al., 1998; Geick et al., 2001). Digoxin was chosen as the model drug in this study to investigate the inductive effect of pregnenolone-16α-carbonitrile (PCN), a ligand of the pregnane X receptor in the rat (Kliewer et al., 1998), on Pgp and Cyp3a levels and on the absorption and elimination of digoxin in the rat small intestine. The in situ vascularly perfused small intestine preparation was used to evaluate the intestinal absorptive, metabolic, and secretory functions (Doherty and Pang, 2000).
Because a quantitative view could be presented by modeling and fitting, data were fit to the physiologically based pharmacokinetic models of the small intestine: the traditional (physiological) model (TM), in which the intestinal blood flow perfuses the intestinal tissue as a whole (Doherty and Pang, 2000), and the segregated flow model (SFM), in which partial flow to the enterocyte region exists (Cong et al., 2000). These models encompass all the physiological variables: transporters for influx and efflux, metabolic enzymes, gastrointestinal transit, as well as partial blood flow to the absorptive, enterocyte layer facing the lumen (Cong et al., 2000). The SFM provides a better explanation for the greater extent of intestinal metabolism of morphine with oral over systemic dosing (Cong et al., 2000). These developed TMs and SFMs are further expanded to include a bilayer membrane compartment that houses the efflux transporter, Pgp, adjacent to the apical membrane, and an unstirred water layer (UWL) compartment external to the apical membrane that bars the absorption of this lipophilic drug. The slow partitioning of digoxin between the plasma and red blood cells in the vascular compartments is also considered (Liu et al., 2005). The data suggest that intestinal efflux is a major mechanism for digoxin elimination, and digoxin bioavailability and efflux were subject to changes with a Pgp inducer such as PCN. In addition, modeling results suggest that the UWL is a major deterrent of digoxin absorption. The segmental traditional model (STM) and segmental segregated flow model (SSFM) (Tam et al., 2003) were then used to illustrate the effects of the segmental heterogeneities of Pgp on digoxin absorption and removal.
Materials and Methods
Chemicals and Reagents. [3H]Digoxin (specific activity 9–37 Ci/mmol) was purchased from PerkinElmer Life Sciences Inc. (Boston, MA). The radiochemical purity of [3H]digoxin was >98%, as found by high performance liquid chromatography (HPLC). Unlabeled digoxin (Dg3), PCN, and bovine serum albumin in Tyrode's solution were obtained from Sigma Aldrich (Mississauga, ON, Canada). Digoxigenin bis-digitoxoside (Dg2), digoxigenin mono-digitoxoside (Dg1), and digoxigenin (Dg0) were gifts from Dr. Emil Lin, University of California, San Francisco. Dextrose 50% USP injection was obtained from Abbott Laboratories (Montreal, QC, Canada). Acetonitrile of HPLC grade was purchased from Fisher Scientific (Fair Lawn, NJ). All other reagents were of analytical grade or higher, and deionized distilled water was used in all experiments.
Animals and Treatment. Male Sprague-Dawley rats (Charles River Canada, St Constant, QC, Canada) were maintained in the housing facility (two rats/cage, 12-h light/dark cycle) with free access to animal chow and water. All the procedures for animal studies were in accordance with protocols approved by the University of Toronto Animal Committee. The rats were randomly assigned to the PCN treatment or control groups. PCN was suspended in corn oil (37.5 mg/ml) and used for intraperitoneal injection (50 mg/kg/day) for 4 days. Control rats received vehicle corn oil intraperitoneally (1.3 ml/kg/day) at the same schedule. On day 3 of treatment, rats were allowed free access to 2% glucose solution but were refrained from solid food for 2 days. On day 5, in situ small intestine perfusion was conducted.
Preparation of Enterocytes and Western Blot Analysis. Intestinal cells were prepared according to the method of Traber et al. (1991), with modifications (Cong et al., 2001). On day 5, the small intestine was removed under anesthesia and was divided into eight segments. Segment 1 (S1) encompassed the duodenum from the pyloric ring to the ligament of Treitz; segment 2 (S2) was the proximal jejunal segment of equal length distal from the ligament of Treitz. The remaining small intestine was then divided into six segments of equal lengths (S3–S8). The strips were quickly removed and placed in a Petri dish over ice, and the lumen was flushed with ice-cold PBS containing dithiothreitol. The segmental enterocytes were collected and suspended in an equal volume of PBS, and stored at –80°C.
After thawing of the cells over ice, the enterocytes, mixed with an equal volume of lysis buffer (2 mM EDTA, 4 mM EGTA, and 1 mM PMSF, 0.25 mM dithiothreitol, and 0.2 mM Na2CO3), pH 7.5, including protease inhibitor cocktail, were sonicated with a cell disruptor. The supernatant, obtained upon centrifugation of the cell lysate at 3000g (10 min), was centrifuged at 21,000g at 4°C for 60 min to yield a crude membrane preparation. This resultant pellet was suspended in PBS and used for analysis of Pgp protein. The microsome was used for analysis of Cyp3a. Total protein was assayed by the method of Lowry et al. (1951).
Intestinal crude membrane or microsomal proteins were resolved on 7.5% (20 μg for Pgp) or 10% (10 μg for Cyp3a) SDS-polyacrylamide gels overlaid with 4% acrylamide stacking gel; a liver sample, processed in similar fashion, was included in each gel as a positive control. The proteins were transferred to a nitrocellulose membrane (Pall Co., Pensacola, FL) after electrophoresis separation. The nitrocellulose membrane was incubated with anti-rat Pgp antibody (C219 from Signet Laboratories, Dedham, MA; 1:1000 dilution) or anti-rat Cyp3a2 antibody (Daiichi Pure Chemicals Co., Ltd., Tokyo; 1:1500 dilution) in 5% (w/v) nonfat milk-Tris-buffered saline containing 0.1% Tween 20, overnight at 4°C. After three 15-min washes in Tris-buffered saline-0.1% Tween 20, the blots were incubated with the secondary antibody, peroxidase-labeled anti-mouse IgG (H+L) (Vector Laboratories, Inc., Burlingame, CA; 1:2000) or goat anti-rabbit IgG (H+L)-horseradish peroxidase conjugate (Bio-Rad Laboratories, Hercules, CA; 1:2000) for 1 h at room temperature. Immunoreactive bands were visualized by enhanced chemiluminescence (GE Healthcare Bio-Sciences, Piscataway, NJ) and quantified by the NIH Image Software. The relative Pgp/Cyp3a levels were expressed as the ratio of integrated optical density of Pgp/Cyp3a to that of β-actin and were further normalized to that of the liver sample.
Vascular Perfusion of the Rat Small Intestine. Male Sprague-Dawley rats were used as intestine donors. The surgical procedure and perfusion apparatus were identical to those described previously (Cong et al., 2001). Briefly, rats were anesthetized with an intraperitoneal dose of sodium pentobarbital (65 mg/kg). The small intestine was perfused in situ with recirculation of the blood perfusate, at 37°C. Perfusate entered via the superior mesenteric artery and exited through the portal vein at the flow rate of 8 ml/min. The perfusate consisted of bovine erythrocytes (20%), freshly obtained and washed (a kind gift of Ryding-Regency Meat Packers Ltd., Toronto, ON, Canada), 2% bovine serum albumin, and 0.3% glucose in Krebs-Henseleit bicarbonate (KHB) solution buffered to pH 7.4. The perfusate was oxygenated with 95% oxygen-5% carbon dioxide (BOC Gases, Division of BOC Canada Ltd., Brampton, ON, Canada). Two reservoirs were used in each study: reservoir 1 for equilibration of the intestine and reservoir 2 for the experiment. Reservoir 2 contained a tracer amount of [3H]digoxin (initial dose 34.8 ± 7.8 × 10⁶ dpm or 0.52 ± 0.12 nmol digoxin) for systemic administration. For intraluminal administration, reservoir 2 contained blank perfusate only, and a known bolus dose of [3H]digoxin (34 ± 6 × 10⁶ dpm or 0.84 ± 0.02 nmol in about 0.2 ml of physiological saline solution) was injected into the proximal duodenum. Perfusate (1 ml) was retrieved from reservoir 2 at 0, 2.5, 7.5, 12.5, 17.5, 22.5, 27.5, 35, 45, 55, 65, 75, 90, and 120 min after initiation of administered digoxin. The total sampling volume was less than 7% of the original volume of 200 ml. At the end of the experiment, the intestine was emptied of its luminal contents and washed twice with 3 ml of ice-cold saline. The intestine was isolated from the carcass, gently blotted and weighed, and kept at –20°C until assay. Viability of the in situ vascularly perfused intestine preparation was measured by the perfusion pressure, hematocrit, and perfusate volume recovery (Cong et al., 2001).
Analytical Procedures. Digoxin (Dg3) and its metabolites, digoxigenin bis-digitoxoside (Dg2), digoxigenin mono-digitoxoside (Dg1), and digoxigenin (Dg0), were quantified by the modified HPLC procedure (Liu et al., 2005). Briefly, a Shimadzu HPLC system consisting of a C18 reverse-phase column (Alltech Associates, Deerfield, IL; 4.6 × 250 mm, particle size, 10 μm) and guard column (Waters Bondapak C18/Corasil 37–55 μm) was used for the separation of digoxin and its metabolites at 220 nm. A binary gradient consisting of acetonitrile (18–28%) and water was used at a flow rate of 1 ml/min. Data acquisition and integration was performed with the Star-Chrom LITE HPLC Data System Software (D-Star Instruments, Manassas, VA). The outflow was collected continuously into minivials by a Gilson FC 204 fraction collector (Gilson, Inc., Middleton, WI) at 1-min intervals, and the radioactivities of Dg3 and its metabolites were determined by liquid scintillation spectrometry (Beckman Coulter Canada, Inc., Mississauga, ON, Canada; model 5801) upon addition of 5 ml of scintillation fluor (Ready Safe; Beckman Coulter Canada). The emerging radiolabeled peak was compared with those of the authentic standards. Typical retention times were 30, 23, 17, and 15 min for unlabeled Dg3, Dg2, Dg1, and Dg0 standards, respectively.
The total radioactivity in blood perfusate was analyzed with use of a calibration curve. A series of 25-μl [3H]digoxin standards, prepared by diluting a [3H]digoxin stock solution with methanol, were mixed with 400 μl of blank blood, whereas another 25 μl was counted directly. Blood samples containing Dg3 and metabolites were treated in the same way as the standard, with addition of 25 μl of methanol instead of the [3H]digoxin standards. After admixture of 1200 μl of acetonitrile, the contents were mixed well to precipitate protein and centrifuged at 9000 rpm for 10 min. Then, 1300 μl of supernatant was transferred into 20 ml of glass vials, and 1.5 ml of H2O and 16 ml of cocktail (Ready Safe, Beckman Coulter, Canada) were added for scintillation counting. The calibration curve was based on the direct counts versus the counts recovered in the supernatant. Tissue and luminal fluid samples were analyzed in a similar fashion, and blank blood was replaced by blank intestinal homogenate or blank luminal fluid in the preparation of calibration curves. Samples of the intestine containing total Dg3 and its metabolites were obtained upon homogenization of the intestine with a 3-fold volume of ice-cold KHB solution; an aliquot of the homogenate was then taken for analysis.
Digoxin and its metabolites in 120-min blood perfusate, luminal fluid, and intestinal tissue samples were separated by HPLC. An aliquot (200 μl to 3 ml) of blood perfusate, luminal fluid, or tissue homogenate sample and unlabeled digoxin (50 nmol in 100 μl as internal standard) were placed into a 1.5- or 12-ml polypropylene tube and added to a 3-fold excess of acetonitrile. After thorough vortex and centrifugation, a volume of the supernatant was transferred into a new tube and evaporated under nitrogen. The residue was dissolved in 200 μl of mobile phase (18:82 v/v of acetonitrile/H2O). The reconstituted sample was centrifuged, and 75 μl of supernatant was injected into the HPLC. The elution fractions were collected and counted. The fractions of Dg3 and its metabolites were expressed as the respective ratios of the radioelution divided by the summed dpm of Dg3 and its metabolites. The contents of Dg3 and its metabolite(s) in the sample were estimated by the fractions of the species obtained from HPLC, times the total count of the same sample assayed from the calibration curve.
Binding to Enterocyte Proteins. Tissue binding was studied by ultrafiltration (Geng et al., 1995) to determine the digoxin unbound fraction (ft) in the S9 fraction of the enterocyte. Enterocytes were freshly prepared as described and pooled. The pelleted enterocytes were suspended in 3 volumes of ice-cold KHB, and a 3.5-ml aliquot was homogenized with a cell disruptor (Vibra Cell, Sonics and Materials Inc., Danbury, CT). The homogenate was centrifuged at 9000g (M2-J Centrifuge; Beckman Coulter, Canada) for 20 min at 4°C. After centrifugation, 2 ml of supernatant (S9) was removed and added to 20 μl of [3H]digoxin in KHB, and 500 μl of the S9 mixture containing [3H]digoxin was used for ultrafiltration (Centricon Amicon YM-3, 3000 molecular weight cutoff; Millipore Corporation, Bedford, MA) at 1000g for 20 min at 25°C. It was assumed that the binding constants obtained reflect those at 37°C. Leakage of enterocyte protein to the ultrafiltrate was less than 1% of the initial concentration.
To correct for the nonspecific binding of [3H]digoxin to the Amicon centrifuge device, KHB was added with a known count of [3H]digoxin (without protein), and the sample was centrifuged during the time of the binding study. The correction factor for nonspecific binding, i.e., ratio of drug concentrations in the KHB (CKHB) and corresponding ultrafiltrate (CKHB,filtrate), was incorporated into the estimate of tissue unbound fraction of the diluted tissue sample, (ft,diluted), as in eq. 1  where CS9,filtrate is the drug concentration in the ultrafiltrate after centrifugation of the S9 sample containing [3H]digoxin, and CS9 is the concentration of the drug in the S9 before centrifugation. The values for binding from the diluted homogenate were back-converted to values corresponding to the original protein concentration in the enterocytes based on the assumption of linear binding: 4.04 × (Cbound/Cunbound)diluted = (Cbound/Cunbound)undiluted since the dilution factor was 4.04 (Kurz and Fichtl, 1983). The unbound tissue fraction of the undiluted tissue, ft, was
Pharmacokinetic Analysis.Noncompartmental Analysis. Noncompartmental methods were used to estimate the clearance (CL) and volume of distribution (Vdss) after the systemic administration of digoxin. The elimination rate constant (k) was estimated from the slope of the terminal phase of the semilogarithmic blood concentration versus time plot (last 5 points). The half-life (t1/2) was given by 0.693/k. The area under the curve (AUCiv 0-∞) of Dg3 in blood perfusate was calculated by the trapezoidal rule and extended to time infinity, and AUMCiv 0-∞ was the area under the moment curve of the drug concentration curve from zero to infinity 
 where Clast was the concentration (percentage dose/ml) at last sampling point tlast. CL was calculated as the intravenous dose divided by the AUCiv 0-∞, and Vdss was determined as follows:
Modeling: TM and SFM. Two previously developed, physiologically based pharmacokinetic models for the intestine, the traditional model (TM) (Doherty and Pang, 2000) and the segregated flow model (SFM) (Cong et al., 2000), were expanded to include the partitioning of Dg3 in red blood cells (rbc), plasma protein, and intestinal tissue binding, as we did for digoxin handling by the liver (Liu et al., 2005). A separate bilayer membrane that housed the Pgp adjacent to the apical membrane and an unstirred water layer (UWL) external to the apical membrane that may retard the diffusion of digoxin were included as additional models to fit the data of digoxin (Fig. 1). Common features of these models included the transporters for absorption and efflux, passive diffusion, metabolic enzyme(s), and gastrointestinal transit (Cong et al., 2000; Doherty and Pang, 2000). Only the unbound species of digoxin in plasma underwent equilibration with those in rbc and in the intestine tissue. The unbound fractions of digoxin in rbc, plasma, and tissue were described as frbc, fp, and ft, respectively. The on- and off-rate constants, kpr and krp, for movement of unbound digoxin from plasma to rbc, and from rbc to plasma, respectively, were obtained from previous studies (Liu et al., 2005). Inasmuch as the binding of digoxin to rbc was uncertain, a modified rate constant, krp′, that equals the product of frbc× krp, was used (Liu et al., 2005).
For the TMs, there was only one tissue compartment (int), and the influx and efflux clearances of Dg3 into the intestinal tissue compartment from blood and out of the intestinal tissue into blood were characterized by the transport clearance parameters, CL1 and CL2, (Fig. 1A). For TM(I), once Dg3 enters the tissue, Dg3 was subject to metabolism to form Dg2 with the intestinal metabolic intrinsic clearance, CL7, or was effluxed at the apical membrane into the lumen (denoted by the secretory intrinsic clearance CL5). The absorption intrinsic clearance of Dg3 from the intestinal lumen was described by CL6. For TM(II), there was the additional presence of a bilayer membrane that housed Pgp, and the exchange intrinsic clearances of Dg3 between the bilayer membrane and tissue were CL9 and CL10, respectively. For TM(III), an unstirred water layer was described, and CL4 and CL3 denoted the diffusion clearances of digoxin between the luminal fluid and the unstirred water layer, respectively. In both TM(II) and TM(III), the absorption intrinsic clearance and efflux clearances were the same as for TM(I) and were denoted as CL6 and CL5, respectively. In all of the TMs, the intestinal motility or the transit clearance was described by CLg.
The three submodels of the SFM were identical to those of the TM, and the distinction of the SFM (Fig. 1B) from the TM was that only a fraction (fQ) of the intestinal blood flow (Q) perfused the enterocyte layer of the mucosa tissue where both Cyp3a and Pgp resided. The remaining blood flow of the intestine, (1 – fQ)Q, perfused the serosa and other structures. When fQ was unity, the SFM simplified to the TM. In all the SFMs, substrate in the serosal blood (sb) and mucosal blood equilibrated with their respective perfused tissues. The tissue volumes were also divided according to fQ, as fQ× total tissue volume was assigned as the volume of the enterocyte region of the mucosal tissue, and the remaining fraction, (1 – fQ) × total tissue volume, as the serosal tissue volume (see Table 2). Thus, the volumes of enterocyte layer (Ven) and enterocyte blood (Venb), as well as those for the serosal tissue (Vs) and serosal blood (Vsb) were dependent on the value of fQ that was estimated from fitting. All clearance terms in the SFMs had the same meaning as those for the TMs. The mass-balance relationships developed previously (Cong et al., 2000; Doherty and Pang, 2000) were expanded to include the partitioning of Dg3 in rbc and plasma protein (Liu et al., 2005), the tissue binding, and the influx/efflux intrinsic clearances of the bilayer membrane or unstirred water layer (see Appendix).
Parameters used for simultaneous fit of systemic and intraluminal data of [3H]digoxin

Intestinal absorption, metabolism, and excretion of digoxin given systemically or intraluminally in the recirculating, vascularly perfused rat small intestine preparation. Schematic presentation of the traditional physiological models, TMs (A) and the segregated flow models, SFMs (B) with one of the possible, appended subcompartment schemes, (I), (II), or (III), is shown. These models consist of the reservoir (R), intestinal blood (intb, enb, and sb), intestinal tissue (int, en, and s), bilayer membrane (mb), or unstirred water layer (w), lumen (l), plasma (p), and red blood cell (rbc) compartments, and an exudate compartment for collection of contents leaving the intestine at the ileocecal cannula. Dg2en was the total Dg2 formed in blood, intestinal tissue, and luminal fluid. The rbc partitioning parameters, krp′ and kpr, and protein and tissue unbound fractions, fp and ft, were integrated into the models for fitting and simulation. See text for details.
Fitting to the TM and SFM. The TM and SFM were used for the simultaneous fitting of the systemic and intraluminal data. Only first-order transport and removal processes were considered. The assumption was valid since the concentration of digoxin used was very low. Since low levels of metabolites and lack of difference in metabolism were observed between the PCN and control preparations, the total amount of Dg2 formed was used for fitting. Only the change of the Pgp level was considered between the data sets of PCN treatment and control. Hence, the parameter associated with Pgp efflux (CL5,pcn) was allowed to change, whereas all other parameters were kept constant for fitting in PCN treatment data. Fitting was performed with the program, Scientist version 2 (MicroMath Scientific Software, Salt Lake City, UT). Initial values were assigned randomly; then, least-squares optimization was performed on data of the systemic and intraluminal administration of tracer of digoxin. The model selection criterion (MSC), a modified Akaike information criterion, and the sum of squared residuals were used as a discriminator for the optimal model. Various weighting schemes (no weighting, 1/predicted, and 1/predicted2) were tested to reach optimized fits; the weighting of unity furnished the best fit.
Simulation. The parameters obtained from the best fitted models, TM(III) and SFM(III) (Table 3), were used for simulations to understand the effects of the Pgp (CL5) and the unstirred water layer (CL4 and CL3) on the bioavailability, F, estimated as  where AUCpo and AUCiv were the areas under the simulated concentration-time curves (from time 0 to infinity) after oral (dosepo) and intravenous doses (doseiv). The doses were assigned a value of 100%. The amounts versus time profiles of Dg3 in perfusate, lumen, and the total Dg2 formed were simulated. The inhibition and induction of efflux transporter Pgp were considered, but the effect of Cyp3a was not considered here inasmuch as metabolism was a very small component of the total intestinal clearance of digoxin. Two parameters: CL4 and CL3, were changed proportionally for simulation of the UWL effect.
Parameters obtained upon simultaneous fitting of systemic and intraluminal data of digoxin with TM and SFM
The optimal weight scheme was unity.
To address the effects of Pgp heterogeneity and induction on bioavailability, a second set of simulations was performed to examine whether the heterogeneous distribution of Pgp exerted an effect on digoxin absorption. The segmental traditional (STM) and the segmental segregated flow (SSFM) models were used (Tam et al., 2003). Since the simpler TM(III) and SFM(III) were found to best fit the digoxin data, the extended models [STM(III) and SS-FM(III)] also contained the UWL. The whole small intestine was subdivided into three segments: duodenum (S1), jejunum (S2–S7), and ileum (S8), as in the experimental design on enterocyte collection. The segmental volume of the intestinal lumen and tissue, as well as segmental intestinal blood flow, were assumed to be the product of the fractional length of the intestinal segment: for the duodenum (based on S1, f1 = 0.08), the jejunum (based on S2–S7, f2 = 0.78), and the ileum (based on S8, f3 = 0.14), multiplied to the volume or flow of the entire intestine. The segmental clearances were subdivided into three portions according to the above fractions. The activity of the Pgp was assumed to correlate with the band intensity of Western blotting, and the total intrinsic secretory clearance of Pgp, CL5, was the summed band intensity. Thus, the Pgp activity in duodenum (S1 only), jejunum (sum of S2 to S7), or ileum (S8) was estimated by the respective Pgp fractional intensity × CL5. These fractions were 0.05, 0.80, and 0.15 for the duodenum, jejunum, and ileum of the control rats, and were 0.04, 0.78, and 0.18 for the PCN-treated rats.

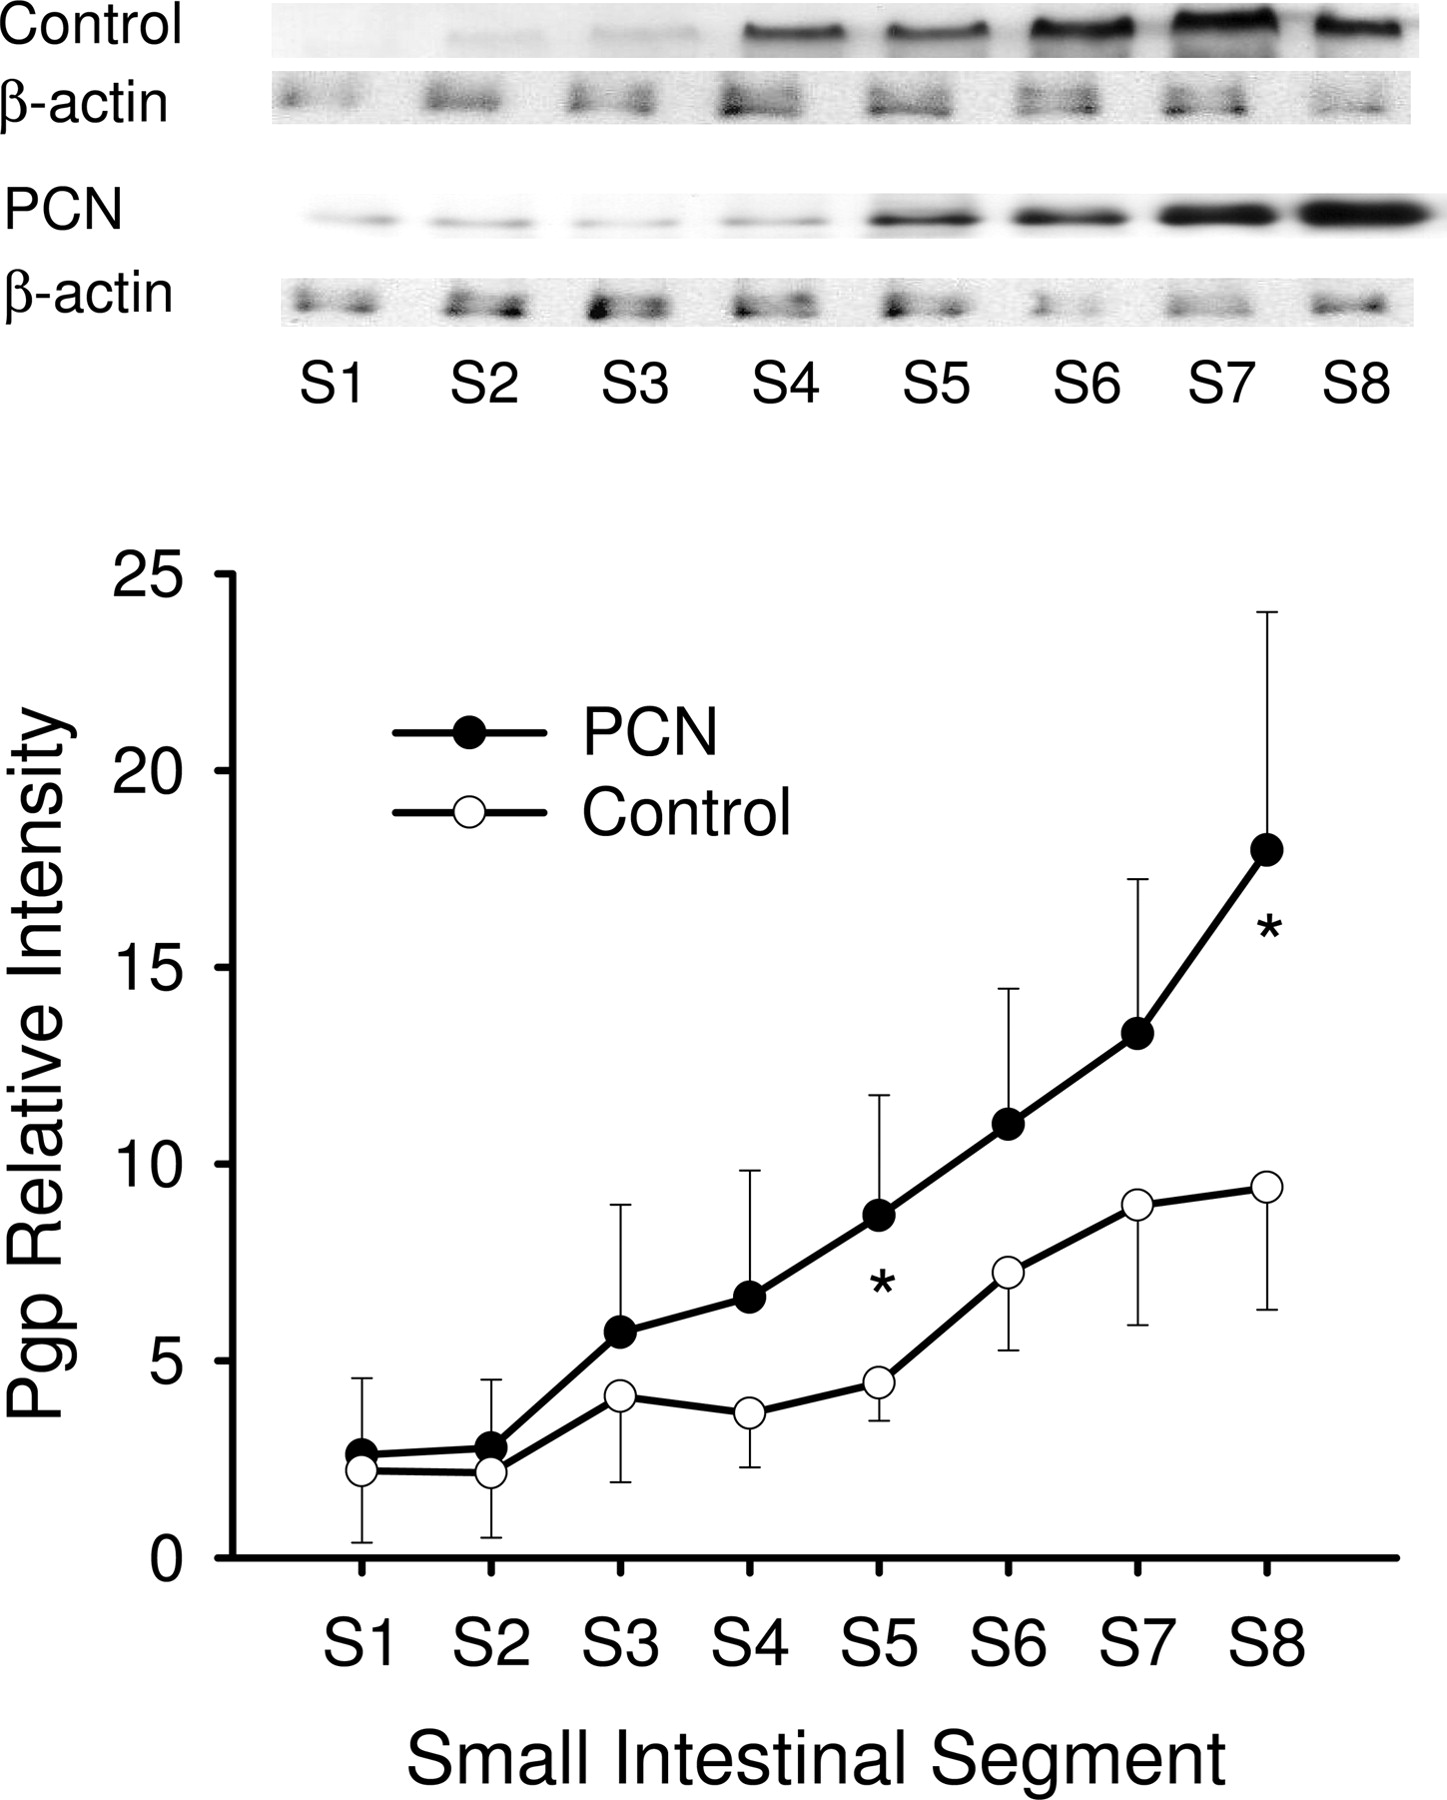
Western blot analysis of Pgp protein expression in enterocytes among segments 1 to 8 (S1–S8) in the small intestine of rat treated with PCN (•) or vehicle (○) for 4 days. Protein fractions from enterocytes, prepared according to the method of Traber et al. (1991), from duodenum (S1) to ileum (S8), were obtained from rats, with and without PCN treatment (mean ± S.D., n = 4). The samples loaded were 20 μg of protein. *, statistically different from control for that segment, P < 0.05.
Statistical Analysis. Data are presented as mean ± S.D.; Student's t test was used, and it was considered to be statistically significant when P < 0.05. For model discrimination, the F test was used to compare the sums of squared differences (WSS) between fits (Boxenbaum et al., 1974).
Results
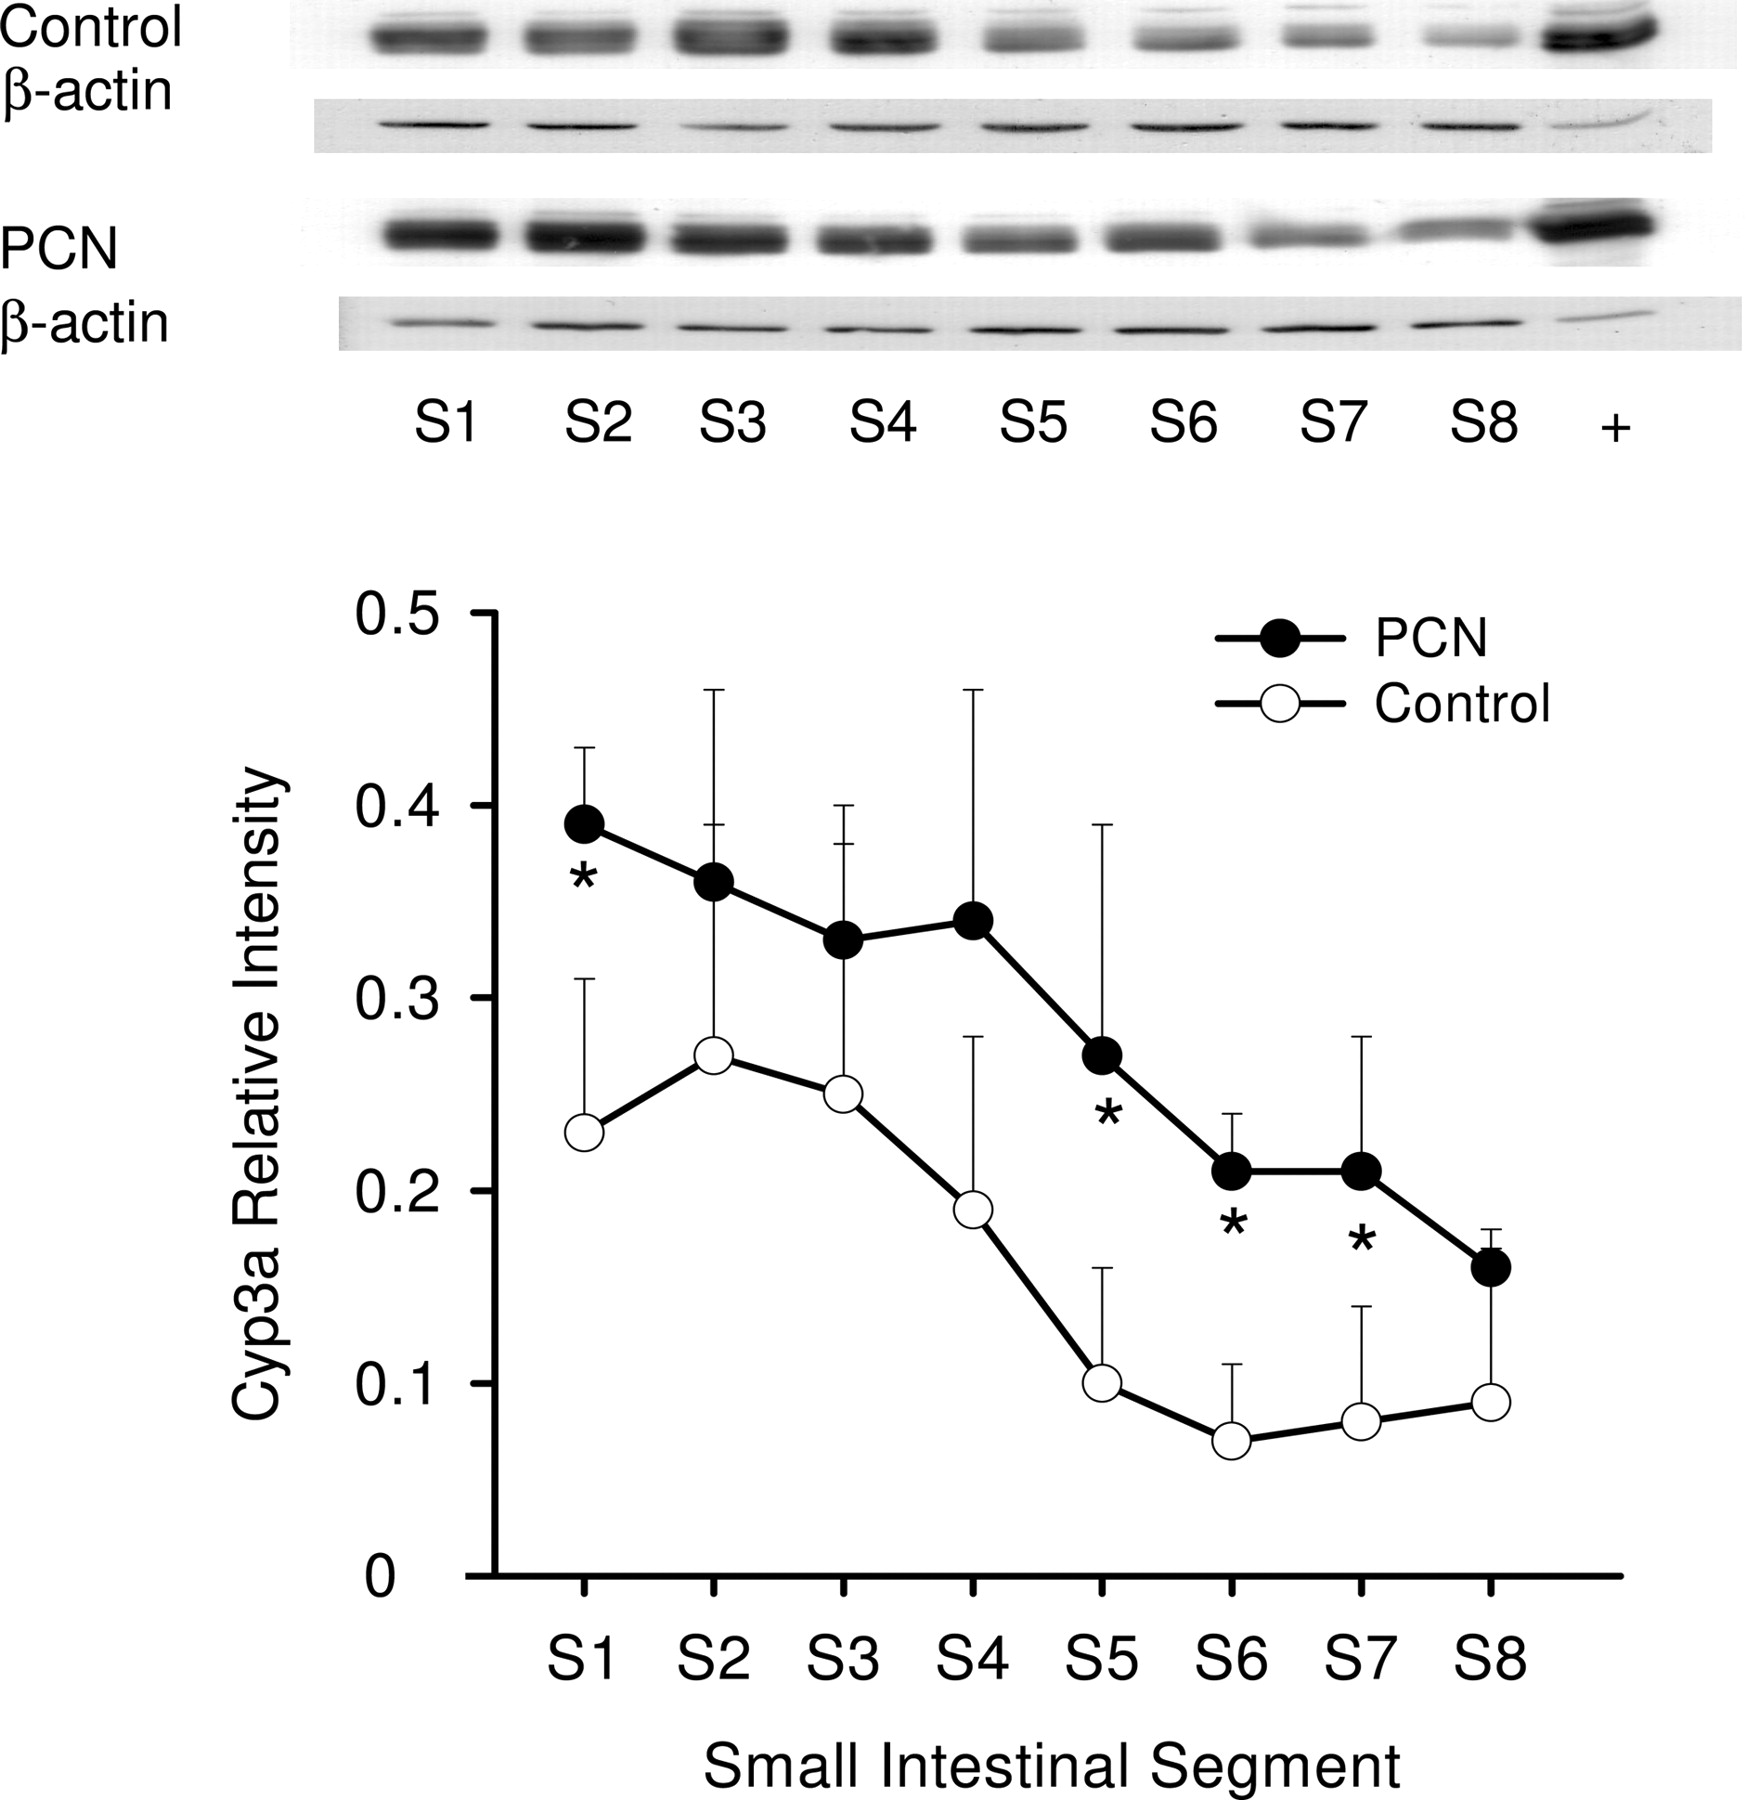
Western Blot Analysis. Western blot analysis showed that the segmental distribution patterns of Pgp (Fig. 2) and Cyp3a (Fig. 3) were not uniform along the small intestine of rat. There was a distal enrichment of Pgp but a proximal abundance of Cyp3a among the intestinal segments, as observed in human intestine (Paine et al., 1997; Mouly and Paine, 2003). With PCN induction, Pgp protein expression in the small intestine increased approximately 1.5-fold of the control, and protein levels of S5 and S8 showed significant increases (Fig. 2). PCN treatment also increased the Cyp3a protein expression (average of 2-fold) along the small intestine (Fig. 3).
Lack of Significant Intestinal Metabolism of [3H]Digoxin. Perfusate levels at the end of the study (120 min) showed that Dg2 was present only at very low amounts for both systemic (<0.7% dose) and intraluminal (<0.1% dose) administration of Dg3. The amounts of Dg1 and Dg0 were even lower or absent. PCN treatment did not change the metabolic profile of digoxin in the blood, luminal fluid, or intestinal tissue compared with that of controls, and [3H]digoxin was the major component in all the samples for systemic and intraluminal administration. Thus, the contribution of metabolites in the blood was negligible in the present study, and total radioactivity rather than specific measurement of [3H]digoxin was used for fitting and modeling.

Western blot analysis of Cyp3a protein expression in enterocytes among segments 1 to 8 (S1–S8) in the small intestine of rat treated with PCN (•) or vehicle (○) for 4 days. Protein fractions from enterocytes, prepared according to the method of Traber et al. (1991), from duodenum (S1) to ileum (S8), were obtained from rats, with and without PCN treatment (mean ± S.D., n = 4). The samples loaded were 10 μg of protein. *, statistically different from control for that segment, P < 0.05.
Systemic Administration of Digoxin. After systemic administration of a tracer dose of [3H]digoxin into the reservoir of the recirculating small intestine preparation, a biexponential decay profile was observed for Dg3 concentrations in the blood perfusate. The amounts of [3H]digoxin and the total Dg2 formed in blood perfusate and luminal fluid are shown in Fig. 4. Approximately 11.2 ± 5.1% of the dose of digoxin was secreted into the lumen, and little metabolite was found. A short distribution phase, followed by a prolonged terminal decay, was observed (Fig. 4). Within the first 15 min of perfusion, digoxin decayed relatively rapidly, and then with a clearly defined but very prolonged half-life (t1/2) of 1440 ± 1570 min, yielding a clearance of 0.22 ± 0.17 ml/min in control rats (Table 1). With PCN treatment, the terminal decay of digoxin in blood perfusate was comparatively faster, yielding a much shorter t1/2 (380 ± 190 min) (Fig. 4) and a higher clearance of 0.47 ± 0.24 ml/min (Table 1). However, due to the high variability, no statistical difference was found for these pharmacokinetic parameters (Table 1). Values of the steady-state volume of distribution, Vdss, were similar: 215 ± 12 ml for control and 215 ± 6 ml for PCN treatment (P > 0.05). The loss of drug from blood perfusate was recovered from the lumen and the intestinal tissue. PCN-treated livers showed lesser amounts of Dg3 in perfusate (58.3 ± 9.0 versus 66.1 ± 7.6% dose) and higher amounts being secreted into the lumen (20.1 ± 8.6 versus 11.2 ± 5.1% dose) at 120 min compared with the controls. The intestinal tissue retained similar amounts of [3H]digoxin (4.2–5.3% of the dose), regardless of PCN treatment or no treatment.
Pharmacokinetics of digoxin after systemic and intraluminal administration of tracer [3H]digoxin from noncompartmental analysis (mean ± S.D.)
Intraluminal Administration of Digoxin. The absorption of a tracer dose of [3H]digoxin after an intraluminal bolus injection was incomplete within the 120-min period for both control and PCN-treated intestinal preparations (Fig. 5). The extent of digoxin absorption was lower in the PCN-treated rats (6.7 ± 3.2% of the dose) compared with control (9.2 ± 2.0% of the dose) at 120 min. The accumulation of drug in the intestinal tissue was similar (4.9–8.7% of the dose), and a major proportion of the dose was recovered from the lumen (84 ± 24 versus 95 ± 27% of the dose, respectively).

Fits to the systemic (i.v.) data of digoxin (Dg3) and its major metabolite of digoxigenin bis-digitoxoside (Dg2), to the TMs and SFMs in Fig. 1, from simultaneous fitting of the composite i.v. and p.o. data, with and without PCN treatment. Open symbols were for control data and solid symbols for PCN-treated data: circle, blood samples in reservoir; triangle, Dg3 in luminal fluid; and square, total Dg2 formed. Lines were for fitted results: short-dashed lines for control and solid lines for PCN treatment. *, statistically different from control in blood samples, P < 0.05.
Tissue Binding of Digoxin. The intracellular binding of digoxin, based on repeated experiments with the S9 preparation from rat enterocytes (n = 3), yielded an average unbound fraction of 0.781 ± 0.069, after proper correction for nonspecific binding and the dilution factor (eq. 2). This value was assigned to both fitting and simulation procedures.
Fitting of Digoxin Data. The input parameters for simultaneous fitting of the systemic and intraluminal data of Dg3 and the total amount of Dg2 formed in blood and lumen to the TM or SFM are summarized in Table 2; the optimized parameters obtained from fitting are summarized in Table 3. Both TM(I) and SFM(I) were able to reveal the PCN-inductive effects on the Pgp efflux intrinsic clearance, CL5 (2.5- and 1.3-fold increase), which was much larger than the metabolic intrinsic clearance, CL7 (Table 3). However, the fit to TM(I) was suboptimal, since an unreasonably low absorptive intrinsic clearance (CL6) was obtained for digoxin, a lipophilic compound, in comparison with those for blood to tissue partitioning (CL1 and CL2). The fit to SFM(I) for the intravenous data was poor, and the model suggests that intestinal blood flow to the enterocyte layer was 6% of the total intestinal flow (Table 3).
Hence, we extended the above models to include the bilayer membrane that houses Pgp (model II) or an UWL (model III) that bars digoxin from entering (Fig. 1). Upon fitting, we found that the submodels (II) and (III) of the TM and SFM were able to detect the increase in Pgp efflux capacity (1.3- to 2.8-fold over control). The estimates of the gastrointestinal transit clearance (CLg) were 0.031 to 0.049 ml/min for the TMs and 0.030 to 0.054 ml/min for the SFMs, and were similar to the value experimentally determined, 0.031 ml/min, calculated from the volume of exudate over the time of collection (120 min). Inclusion of the bilayer membrane (II models) failed to improve over TM(I) and SFM(I), and suboptimal fits were again obtained. However, inclusion of the unstirred water layer into the modeling dramatically improved the fits and the estimation of parameters. Both TM(III) and SFM(III) provided good fits to the intravenous and oral data of digoxin and detected the changes of Pgp with PCN induction, attesting to a role for the unstirred water layer in the intestinal absorption. The values of CL1 for digoxin partitioning into tissue were 2.8 and 14.9 ml/min for TM(III) and SFM(III), respectively, and were comparable to the value of blood flow (8 ml/min), and translated to 0.58 and 3.06 ml/min/g for TM(III) and SFM (III), respectively (for average tissue weight of 4.86 g). The absorptive intrinsic clearances, CL6, were 4.6 and 1.7 ml/min, values comparable to those of CL1 and CL2 (Table 3). The fractional flow to the enterocyte layer, 20% of the total intestinal flow for SFM(III), was a reasonable estimate, since this mucosal flow was reported to be in the range of 5 to 30% of the intestinal flow rate (Cong et al., 2000, 2001). The bioavailability, F, was calculated from the fitted profile and was similar for both TM(III) and SFM(III): 0.131 to 0.132 for control and 0.105 to 0.110 for PCN treatment, respectively.

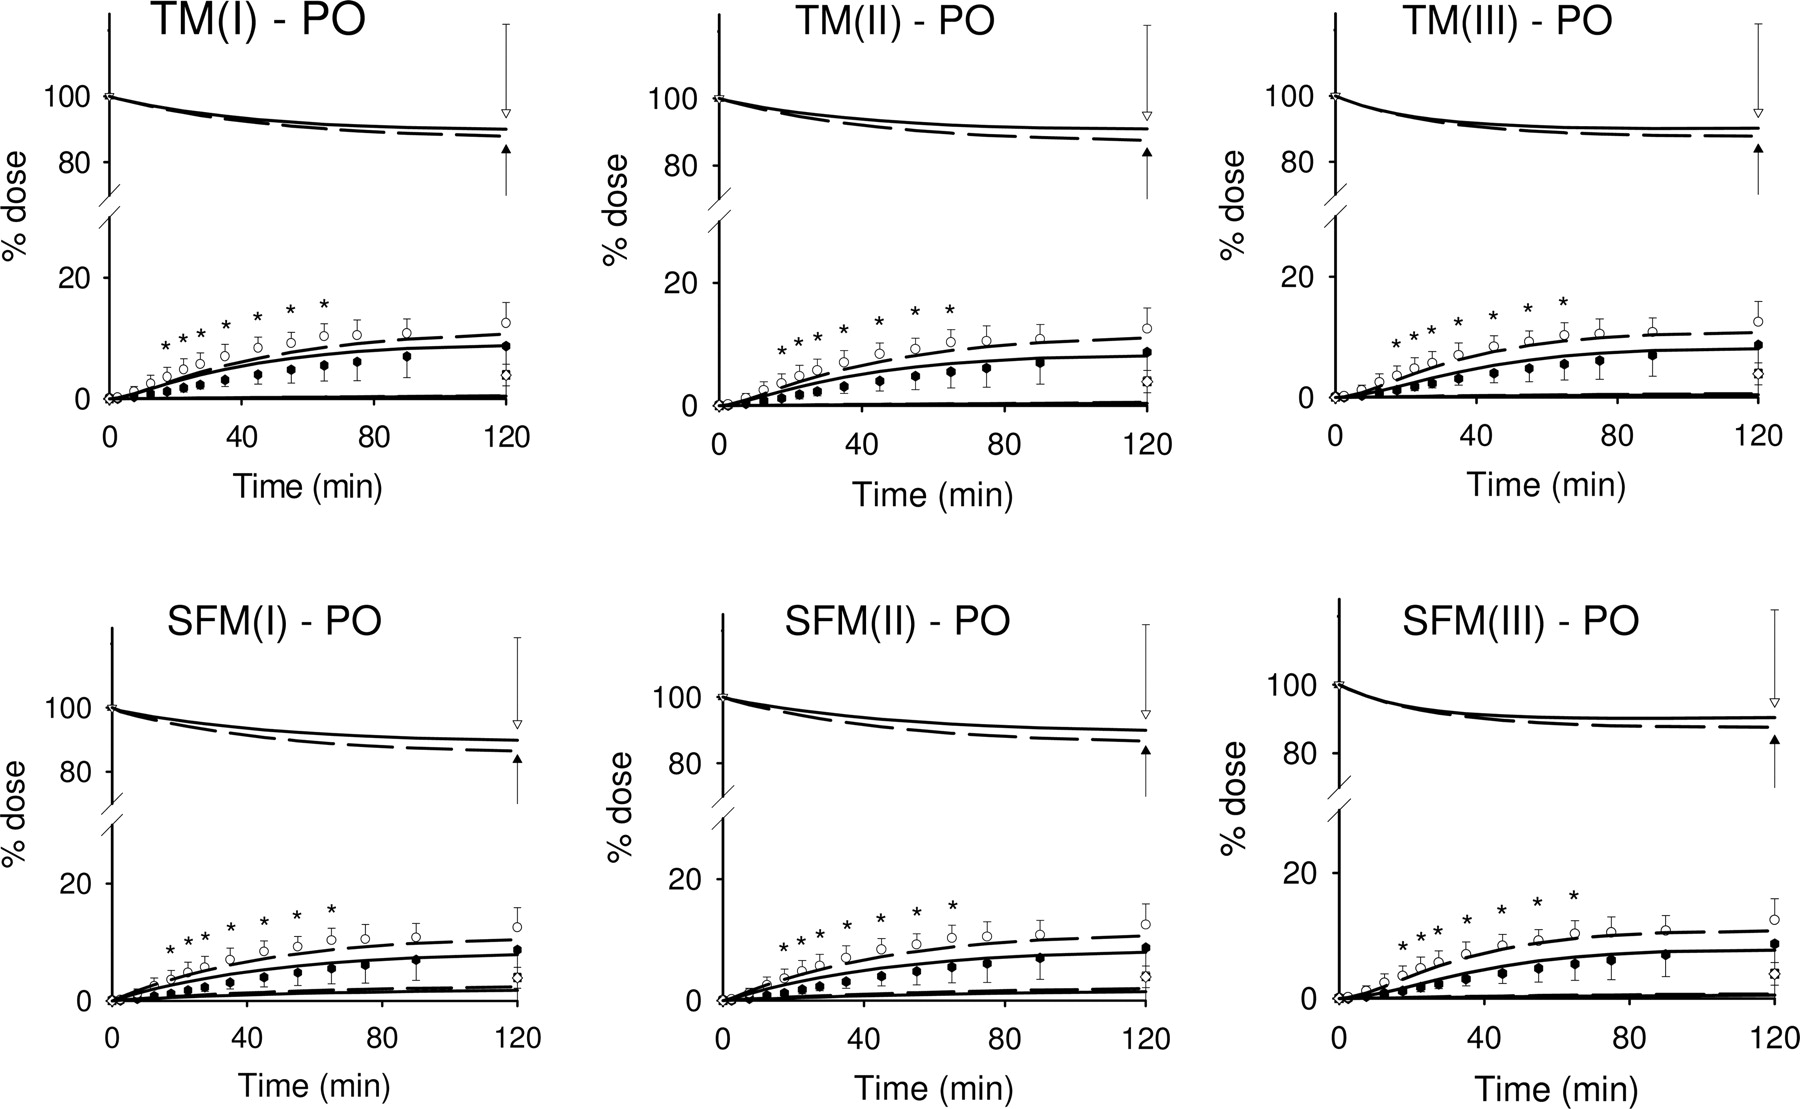
Fits to the intraluminal (p.o.) data of digoxin (Dg3) and its major metabolite of digoxigenin bis-digitoxoside (Dg2), to the TM and SFM in Fig. 1, from simultaneous fitting of the composite i.v. and p.o. data, with and without PCN treatment. Open symbols were for control data and solid symbols for PCN-treated data: circle, blood samples in reservoir; triangle, Dg3 in luminal fluid; and square, total Dg2 formed. Lines were for fitted results: short-dashed lines for control and solid lines for PCN treatment. *, statistically different from control in blood samples, P < 0.05.
The F test was further used to compare the sums of squared differences (WSS) of fits between TM(I) and other models (Table 3). The calculated F values for TM(II) and SFM(I) and SFM(II) were not significantly different from those of TM(I), but the F values of TM(III) and SFM(III) were significantly different from those of TM(I) at the 5% level. The results of the F test, the model selection criterion (MSC), and sum of squared residuals from the fit were all consistent: TM(III) and SFM(III) consisting of the UWL were the best models to describe the disposition of digoxin in the small intestine, since the fits were associated with the smallest sum of squared residuals, the largest MSC (the greater the number, the better the fit), and reasonable absorptive intrinsic clearance CL6.
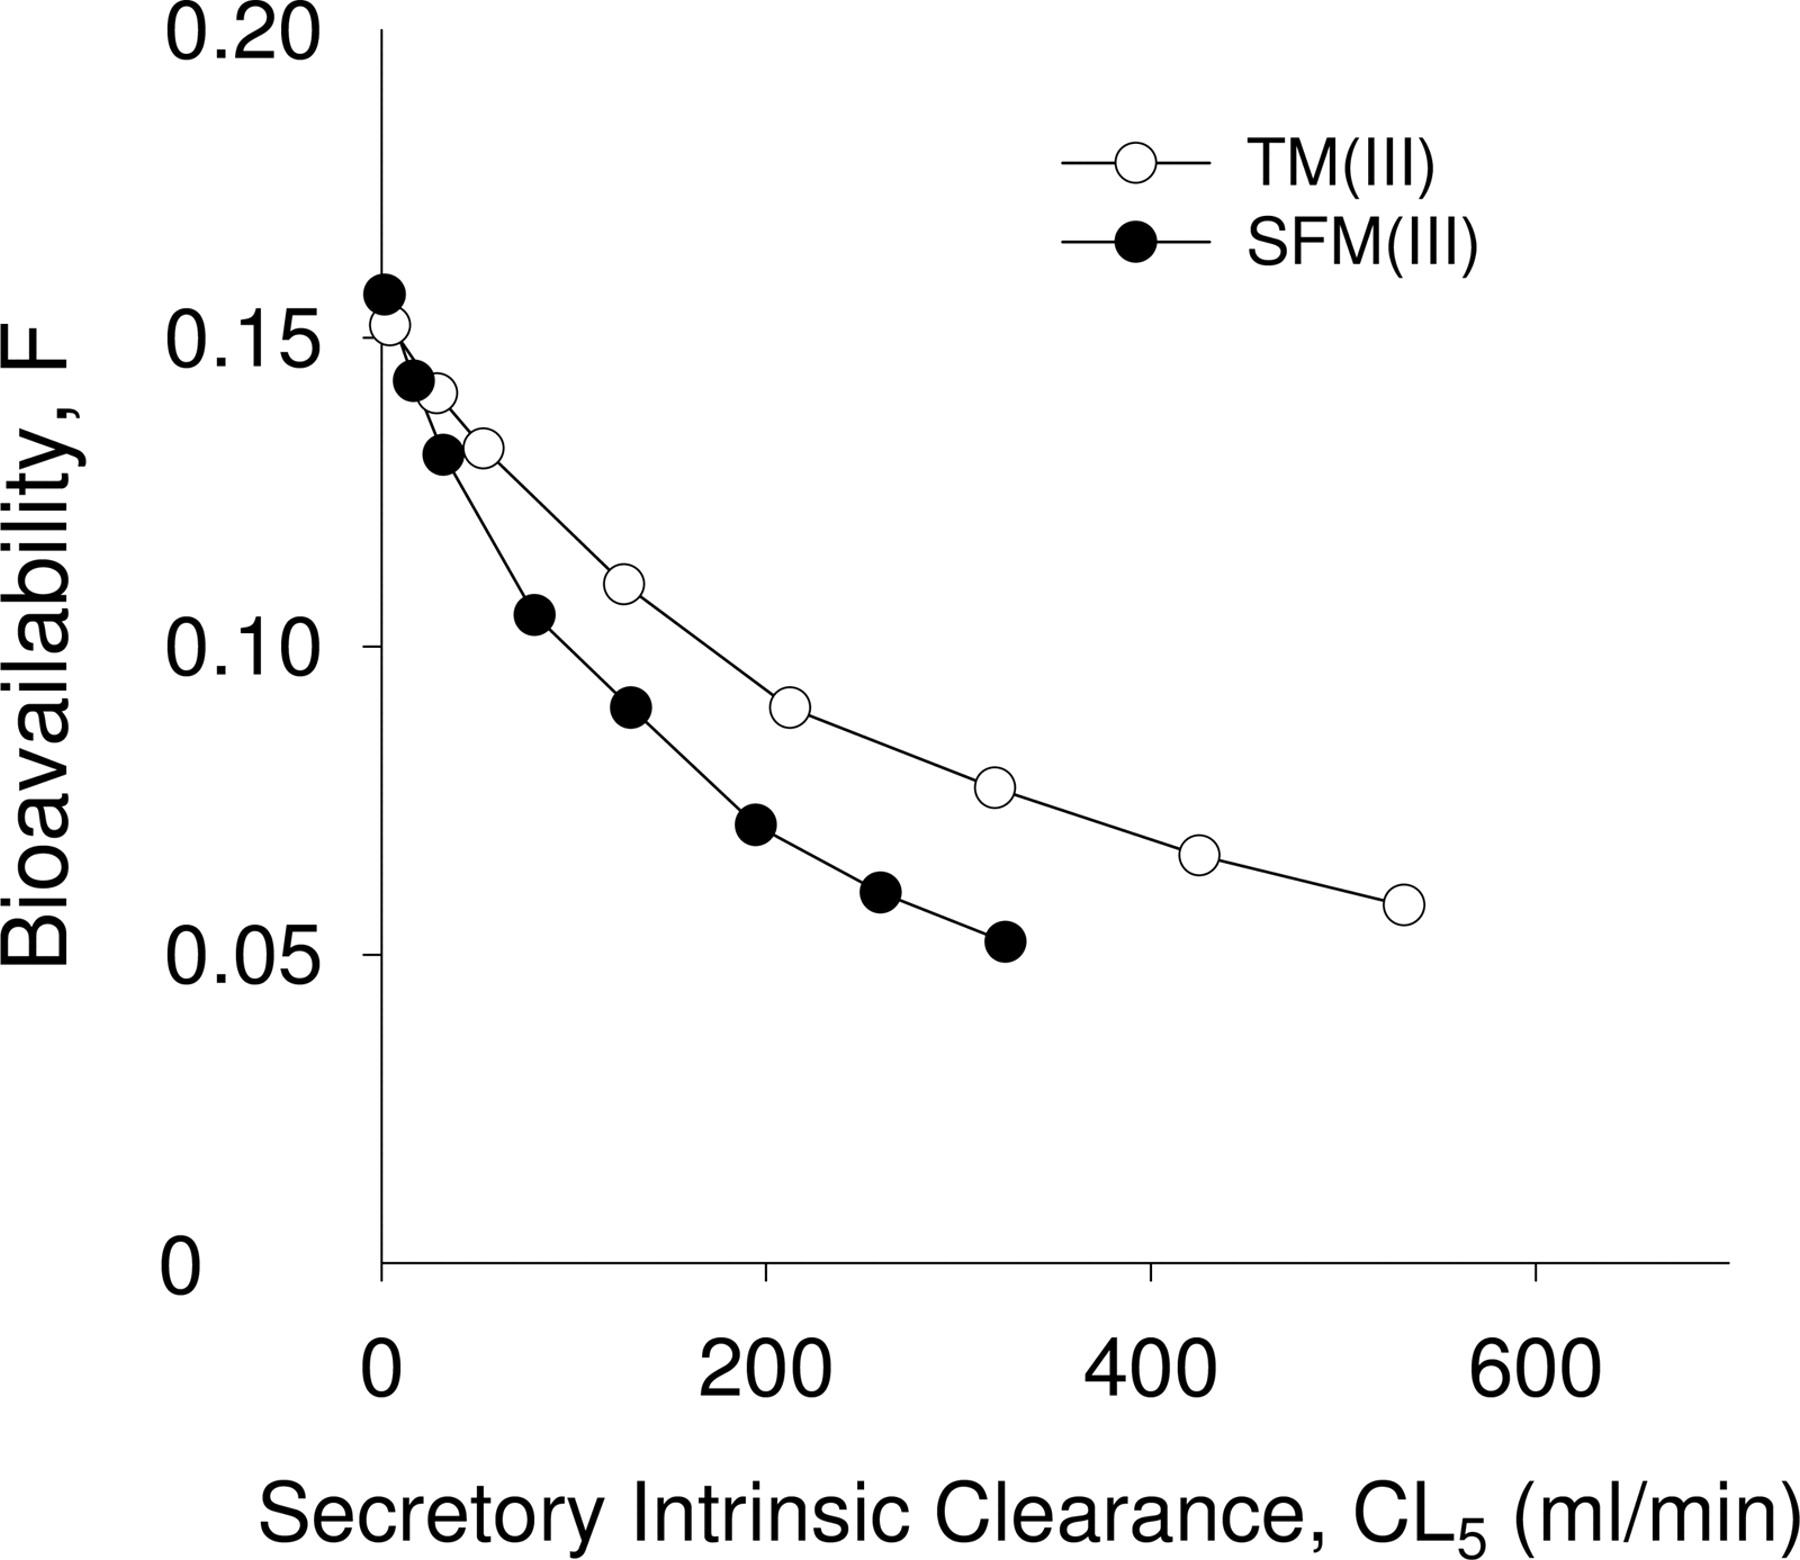
Simulation. The TM(III) and SFM(III) were used to further simulate the effects of efflux transporter Pgp (secretory intrinsic clearance CL5) and the UWL (diffusion clearances CL4 and CL3) on bioavailability using the parameters obtained from fitting (Table 3). A decrease in CL5 (inhibition of P-glycoprotein) resulted in increased F (Fig. 6). When Pgp was completely inhibited by assigning the secretory intrinsic clearance, CL5, equal to the absorptive intrinsic clearance CL6, F increased by 17 and 19% for TM(III) and SFM(III), respectively, whereas induction of Pgp resulted in a decrease of F. With a 10-fold induction of Pgp, the bioavailability of F decreased by 56 and 61% for TM(III) and SFM(III), respectively.
Figure 7 shows the simulated results on the effect of the diffusion clearances (CL3 and CL4) of digoxin across the UWL on the bioavailability, F. Three cases were examined. In the first case, CL3 and CL4, the diffusion clearances to/from the bulk and from/to UWL, were much less than the absorptive intrinsic clearance, CL6. The simultaneous increase of CL4 and CL3, achieved by reducing the thickness of the UWL, increased F linearly and showed that the rate of solute diffusion through the UWL was the rate-limiting barrier. In the second case, CL4, the diffusion clearance from bulk to UWL was close to or exceeded CL6, the absorptive intrinsic clearance. F was found to be independent on CL4, and there was no influence from the UWL since the UWL was thin enough and the diffusion through it was not a rate-limiting step. In the third case, CL4 was approaching CL6. The diffusion clearances across both the UWL (CL4 and CL3) and the membrane (CL6) all played roles in determining F in this scenario. In our perfusion experiment, it appeared that the UWL effect was similar to the first scenario because CL4 was much smaller than CL6 (Table 3), and a slight change of the UWL thickness may significantly influence the bioavailability.

Other simulations were also conducted to examine the effect of Pgp heterogeneity on digoxin disposition. TM(III) and SFM(III) were expanded to include three segmental regions: the duodenum, the jejunum, and the ileum, as shown by Tam et al. (2003). In these simulations of STM(III) and SSFM(III), we used the parameters obtained from the fits of TM(III) and SFM(III) (Table 3) and the segmental fractional activities calculated from the observed Pgp distribution (Fig. 2). The predictions showed good matches to the experimental data, although there was a systematic trend for the residuals of the oral data with PCN treatment (Fig. 8). F was similar for both TM(III)/STM(III) and SFM(III)/SSFM(III) in control (0.132/0.135 and 0.131/0.134) and with PCN induction (0.110/0.113 and 0.105–0.107) when considering the heterogeneity of Pgp. The similar bioavailability between TM(III)/SFM(III) and STM(III)/SSFM(III) suggests that Pgp heterogeneity was not important. The sum of squared residuals (SSR) was 172 for STM(III) and 167 for SSFM(III), slightly larger than those for TM(III) (164) and SFM(III) (158).

Simulated effect of the unstirred water layer (diffusion clearances, CL4 and CL3) on bioavailability, F. Simulations were based on parameter values in Table 3 for TM(III) (open circle) and SFM(III) (solid circle). The diffusion efflux clearance of CL3 from the UWL to the lumen was proportionally changed with CL4.
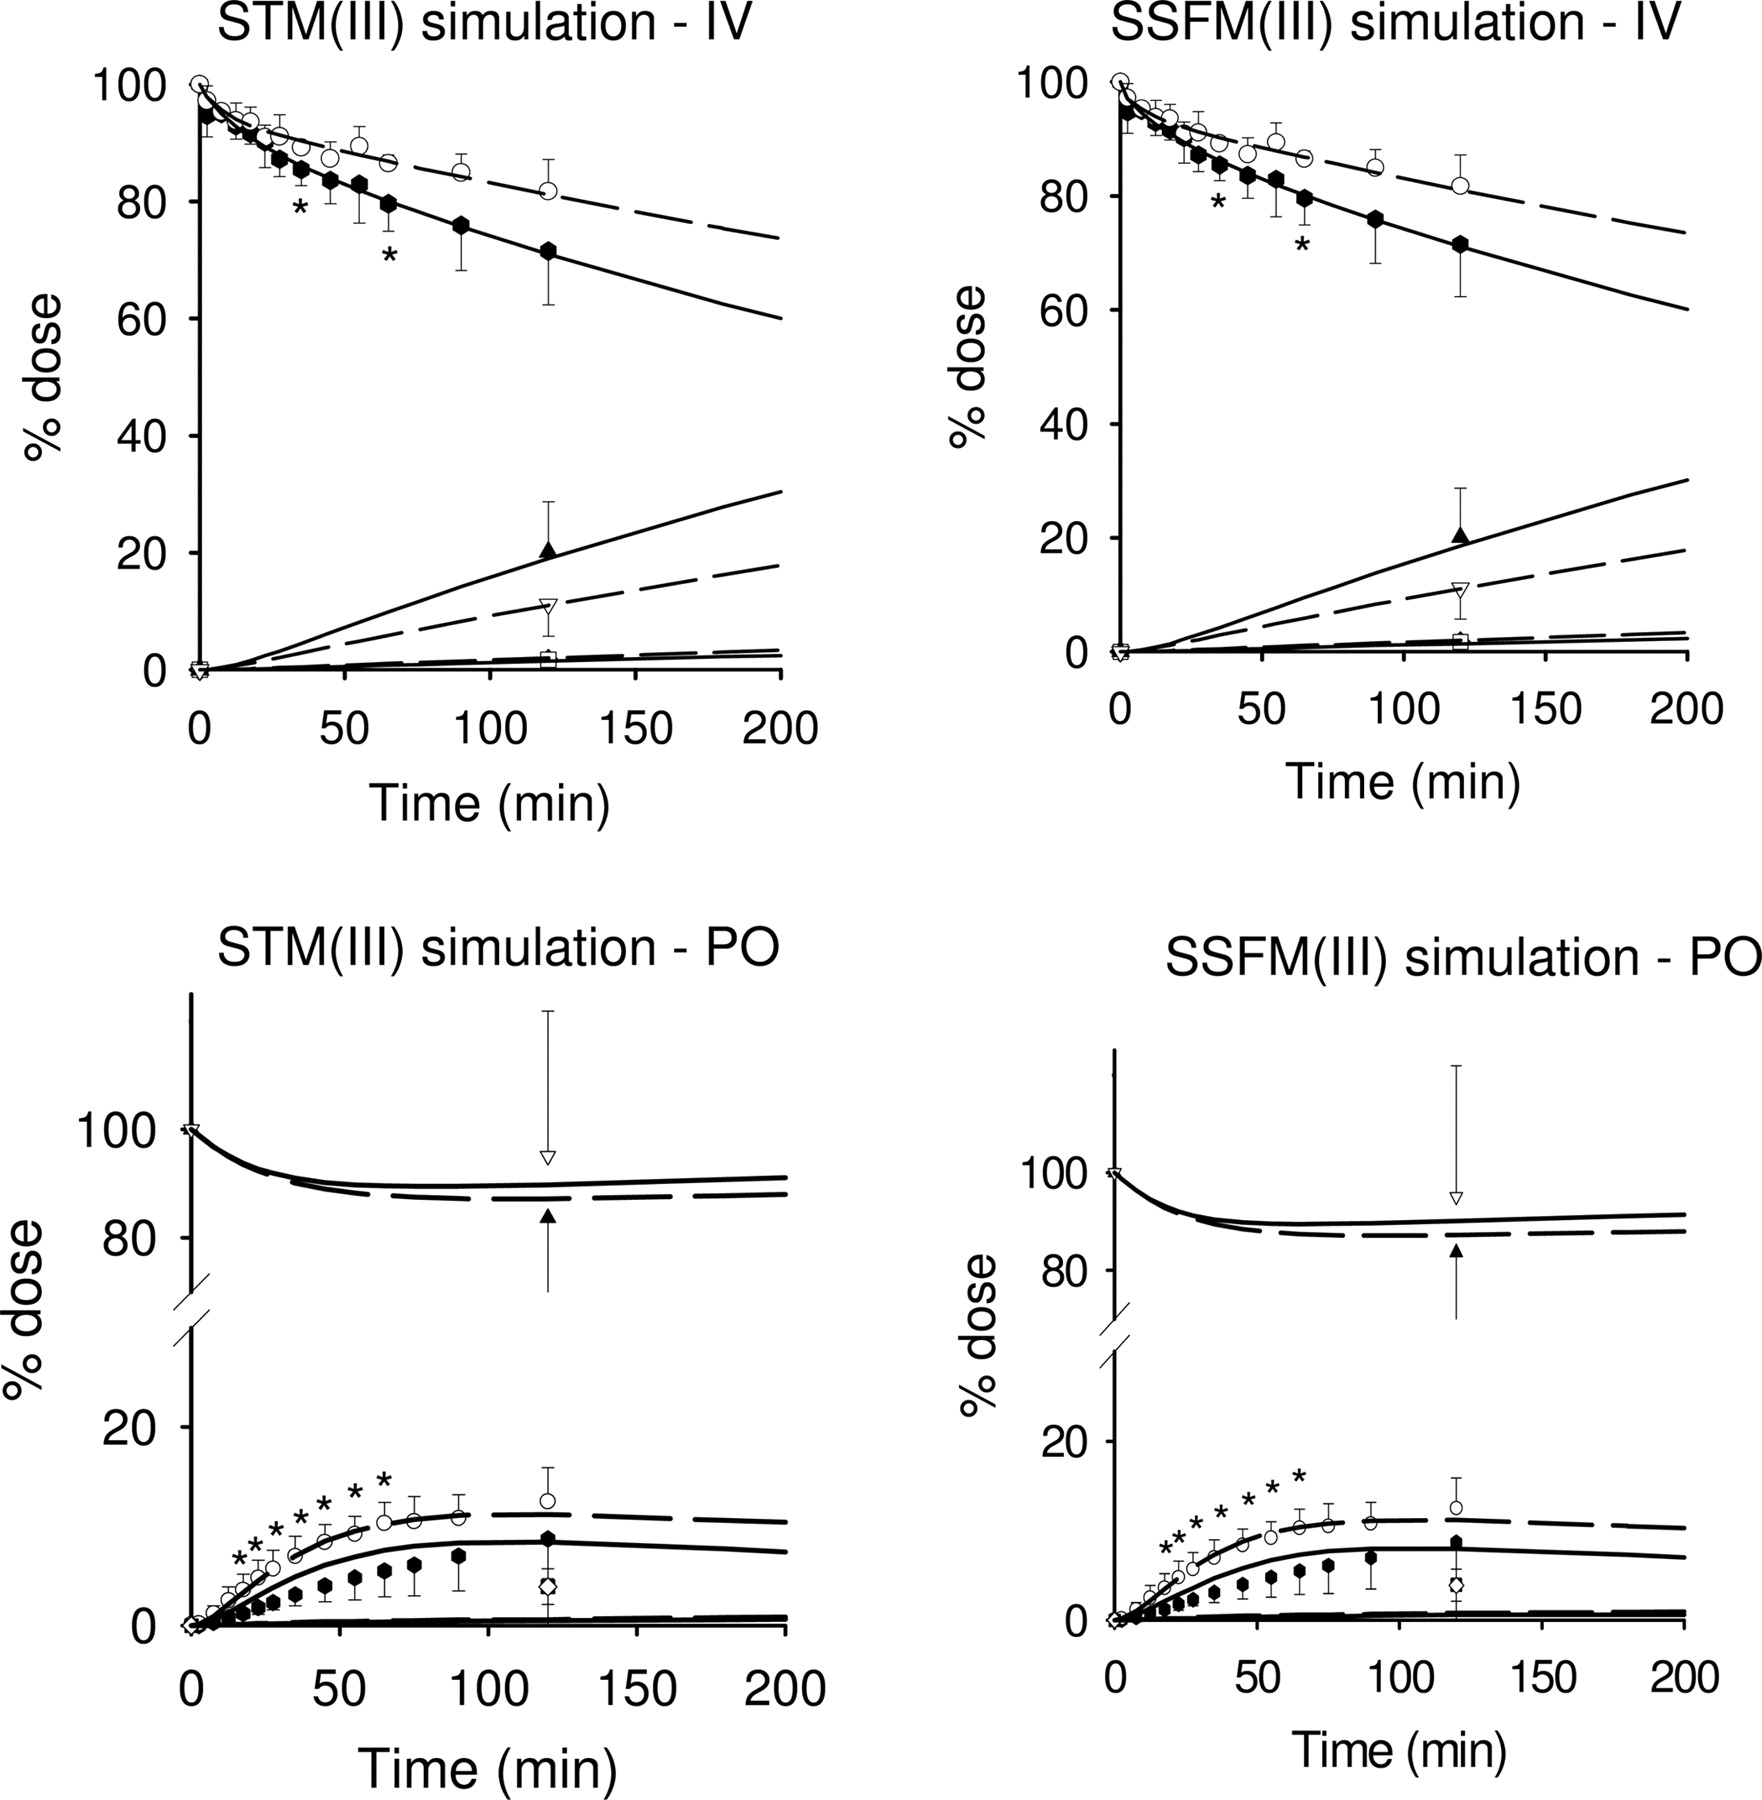
Simulations based on the STM(III) and SSFM(III) with an unstirred water layer. The intestine was subdivided into three segments: duodenum, jejunum, and ileum (based on Tam et al., 2003), with parameters obtained from fitting digoxin data to TM(III) and SFM(III). The heterogeneity of Pgp distribution along the small intestine was considered. The predictions (lines) for the STM(III) and SSFM(III), shown as short-dashed lines for control and solid lines for PCN treatment, matched well with the experimental data (symbols).
Discussion
In the present study, we investigated the binding, absorption, metabolism, distribution, and excretion of [3H]digoxin in the vascularly perfused rat small intestine preparation. It is well accepted that both intestinal transport and drug metabolism are important determinants of first-pass elimination of orally administered drugs (Drescher et al., 2003; Pang, 2003). Efflux via Pgp is the critical determinant of the bioavailability of digoxin in humans. The same was found for cyclosporin and paclitaxel, other prototypic substrates of the intestinal efflux MDR1 or Pgp pump (Drescher et al., 2003). The rate-limiting step in drug absorption is not uptake for digoxin, since the drug is lipophilic, and apical efflux is the major pathway of elimination of digoxin for the rat intestine. Digoxin intestinal clearance doubled (0.47 ± 0.24 ml/min) with PCN-treated rats compared with those of controls (0.22 ± 0.17 ml/min), although no statistically significant change was noted (P = 0.129, n = 4). Our observation is similar to those found in mice and humans (Mayer et al., 1996; Drescher et al., 2003). In humans, the average elimination of digoxin into the gut lumen exceeded 11% within 3 h (Drescher et al., 2003). Moreover, digoxin absorption was significantly reduced after intraluminal administration of [3H]digoxin in the rat intestinal preparation (Fig. 5), a consequence consistent with increased Pgp expression with PCN treatment (Fig. 2). Thus, the small intestine is an important excretion tissue for digoxin elimination in humans, mice, and rats, and the Pgp-mediated efflux reduced the entry of digoxin into the enterocytes.
Intestinal metabolism is another important determinant of bioavailability. Most of the drug-metabolizing enzymes present in the liver are also found in the small intestine, despite the fact that the levels are generally much lower in the small intestine (Lin et al., 1999). Digoxin is metabolized in the rat (Wirth and Frölich, 1974; Harrison and Gibaldi, 1976; Salphati and Benet, 1999), with approximately 60% of the total body plasma clearance (5.77 ml/min) being attributed to biotransformation (Harrison and Gibaldi, 1976) by Cyp3a (Salphati and Benet, 1999). Hepatic metabolism (Salphati and Benet, 1999; Liu et al., 2005) must have accounted for most of the biotransformation since in vitro incubations of digoxin with rat intestinal tissue showed that digoxin was not metabolized by rat enterocytes to any significant extent (Sababi et al., 2001). In the present study with the perfused rat small intestine, little metabolism in the small intestine was observed, and PCN treatment failed to change the metabolic profiles. These results suggest that intestinal Cyp3a protein, though present and induced by PCN treatment (Fig. 3), failed to affect digoxin removal. Intestinal Cyp3a protein, though induced, was a poor reflector of digoxin metabolism in rat small intestine inasmuch as digoxin is a poor substrate. For all intents and purposes, the inductive effect of PCN on digoxin metabolism by Cyp3a was ignored.
In this small intestine preparation, the volume of distribution of digoxin at steady state (215 ml) was only marginally larger than the reservoir blood volume (200 ml), suggesting a lack of concentrative effect of digoxin into rat enterocytes. The observation was consistent with the low tissue binding (intestinal tissue unbound fraction, 0.781), such that the tissue volume (Vtfb/ft) was almost the same as the physiological volume of the intestinal tissue (Vt), since the unbound fractions in blood (0.64) (Liu et al., 2005) and tissue (0.78) are similar. This contrasted with other results on the distribution of digoxin in tissues that uncovered high concentrations of digoxin in the heart, kidney, and liver (Doherty et al., 1967), contributing to the large apparent volume of distribution of digoxin (Harrison and Gibaldi, 1976).
The decay of digoxin was associated with a very long t1/2. The sampling duration was much shorter than the estimated terminal half-lives in both groups (Table 1), and it may be argued that the parameter had not been estimated correctly, since sampling was not followed beyond two half-lives, the recommended regimen for proper determination of the t1/2 or elimination rate constant of digoxin. Hence, errors may be incurred in the estimation clearance and volume of distribution, parameters calculated with either the rate constant or the half-life. The intestinal perfusion system might be less reliable for pharmacokinetic estimates for drugs with very long half-lives. But because distribution equilibrium was reached by 20 min of perfusion (Fig. 4), the terminal t1/2 was clearly defined and the error was minimized.
Recognizing that proper interpretation could be attained with modeling, we used the previously developed TM and SFM that considered all the physiological parameters for fitting (Cong et al., 2000; Doherty and Pang, 2000). Both TM(I) and SFM(I) were able to predict the PCN induction effect on the Pgp efflux intrinsic clearance CL5 (2.5- and 1.4-fold increase), and the increase matched the Western blotting results well (1.5-fold increase in Pgp expression). However TM(I) was considered suboptimal since the absorptive intrinsic clearance (CL6) was unreasonably low in comparison with the blood to tissue partitioning clearance (CL1). The SFM(I) rendered poor fits to the systemic data, although a more reasonable CL6 was obtained. Upon modeling with a bilayer membrane for Pgp (model II), the estimate of CL6 remained low in TM(II) (Table 3) and the fitting to the systemic data was poor in SFM(II) (Fig. 4). With an UWL (model III) for slow entry of digoxin (Fig. 1), however, good fits to the intravenous and oral data of digoxin were obtained by TM(III) and SFM(III). Reasonable estimates of CL6 for absorption and appropriate CL5 that described the changes (2.4-fold for both) in Pgp with PCN induction were obtained with TM(III) and SFM(III). These results assert a role of the unstirred water layer in the intestinal absorption of digoxin. The estimated fractional flow to the enterocyte layer (20%) was reasonable (Cong et al., 2000, 2001). The present data, however, precluded discrimination between TM(III) and SFM(III) as to which was the better model, since model discrimination necessitated the presence of metabolite data. By contrast, assignment of SFM(I) as a better model over TM(I) for morphine absorption and metabolism by the perfused rat intestine preparation was possible because morphine 3β-glucuronide data were available. When the segmental heterogeneity of Pgp was considered in the model III versions of the STM and SSFM, the simulations matched well with the experimental data (Fig. 8). Because of the lack of significant change, regardless of whether or not heterogeneity of Pgp was considered, differences in Pgp levels among the duodenal, jejunal, and ileal segments were deemed to be unimportant in digoxin bioavailability.
The presence of the UWL, together with the Pgp, compounded the problem in lowering F. The UWL, with a thickness estimated at 100 to 800 μm or less, has long been recognized as a potential barrier for intestinal absorption of compounds (Lewis and Fordtran, 1975; Ho et al., 1983; Chiou, 1994). Permeation of drugs within the UWL was modeled as a simple diffusion process in a water layer. For hydrophilic molecules, the membrane constitutes the rate-limiting barrier in the transport process, whereas for lipophilic molecules such as digoxin, the UWL constitutes the rate-limiting barrier. Thus, thinning of the UWL will increase solute absorption if the rate of solute diffusion through the UWL is slower than its rate of membrane transport (Lewis and Fordtran, 1975; Ho et al., 1983; Kou et al., 1991; Tsutsumi et al., 2003). In situ luminal perfusion studies showed that several factors contributed to the change of the absorption rate: perfusion flow rate, absorbing area, effective unstirred layer thickness (Winne, 1979), and various physiochemical properties of compounds (Amidon et al., 1981). The physiologically relevant physical models, which considered the physicochemical properties and transport mechanisms, can provide useful information to the relationships of intestinal length, flow rate, pH, and permeabilities of the aqueous boundary layer and membrane (Amidon et al., 1981; Ho et al., 1983). Our simulation results with the UWL (Fig. 7) confirmed the relative effects of the UWL (CL4/CL3) and the intestinal membrane (CL6/CL5) on the bioavailability of digoxin. Diffusion of digoxin through the UWL, the intestinal membrane, or both could be the rate-limiting step(s), depending on the relative values between CL4 (CL3) and CL6 (CL5). When the roles of Pgp efflux and the unstirred water layer (UWL) were compared in simulations, the role of the UWL was much more prominent in reducing F of digoxin (Figs. 6 and 7). The effect of Pgp is lessened for digoxin since reabsorption of this lipophilic drug readily occurs.
In summary, the rat in situ intestinal perfusion preparation has proven to be a useful tool for investigating the mechanism of drug transport (absorption and excretion), enzymes (metabolism), and induction/inhibition. For digoxin, the contribution of the intestinal metabolism to the overall first-pass metabolism in rats is unimportant, regardless of PCN induction and administered route. The TM(III) and SFM(III) with the unstirred water layer explained and predicted the roles of P-glycoprotein and the unstirred water layer for digoxin absorption and disposition. We were able to identify the intestinal P-glycoprotein, which was enhanced by PCN induction, as a major determinant for digoxin intestinal clearance and absorption from the rat intestinal tract. The unstirred water layer posed as a substantial barrier for digoxin absorption.
Appendix
The traditional model TM(III) and the segregated flow model SFM(III), with the unstirred water layer, were shown in Fig. 1. The difference in the models lies in the segregation of blood flow for perfusion of the enterocyte region and the serosal region for the SFM.
Mass-Balance Equations for TM(III). For the rates of change of amounts of digoxin (Dg3) in perfusate blood (subscript R), red blood cell (subscript rbc,R), and plasma (subscript p,R) in reservoir, 


For the rates of change of amounts of digoxin (Dg3) in the rbc (subscript rbc,intb) and plasma (subscript p,intb) of intestinal blood, 

For the rates of change of amounts of digoxin (Dg3) and digoxigenin bis-digitoxoside (Dg2) in the intestinal tissue compartment (subscript int), 
 With PCN induction, the above equation containing CL5 was changed to pCL5.
For the rate of change of amount of digoxin (Dg3) in the unstirred water layer compartment (subscript w),  With PCN induction, the above equation containing CL5 was changed to pCL5.
For the rates of change of amounts of digoxin (Dg3) in the intestinal lumen (subscript l) and exudates (subscript e) compartments, 

Mass-Balance Equations for SFM(III). For the rates of change of amounts of digoxin (Dg3) in the reservoir blood (subscript R), red blood cell (subscript rbc,R), and plasma (subscript p,R), 


For the rates of change of amounts of digoxin (Dg3) in the red blood cell (subscript rbc,sb) and plasma (subscript p,sb) of the serosal blood compartment, 

For the rate change of digoxin amount (Dg3) in the serosal (subscript, s) compartment 
For the rates change of amounts of digoxin (Dg3) in the rbc (subscript rbc,enb) and plasma (subscript p,enb) of the enterocyte blood compartment, 

For the rates of change of amounts of digoxin (Dg3) and metabolite of Dg2 in the intestinal enterocyte (subscript, en) compartment, 

With PCN induction, the above equation containing CL5 was changed to pCL5.
For the rate change of amount of digoxin (Dg3) in the unstirred water layer compartment (subscript, w)  With PCN induction, the above equation containing CL5 was changed to pCL5.
For the rate change of digoxin amount (Dg3) in the intestinal lumen (subscript l) and exudate (subscript e) compartments, 

Footnotes
-
This work was supported by the Canadian Institute for Health Research, Grant MOP64350.
-
Article, publication date, and citation information can be found at http://dmd.aspetjournals.org.
-
doi:10.1124/dmd.105.008227.
-
ABBREVIATIONS: Pgp, P-glycoprotein; PCN, pregnenolone-16α-carbonitrile; Dg3, digoxin; Dg2, digoxigenin bis-digitoxoside; Dg1, monodigitoxoside; Dg0, digoxigenin; HPLC, high-performance liquid chromatography; TM, traditional model; SFM, segregated flow model; STM, segmental traditional model; SSFM, segmental segregated flow model; UWL, unstirred water layer; S1–S8, small intestinal segments 1 to 8; PBS, phosphate-buffered saline; KHB, Krebs-Henseleit bicarbonate; CL, clearance; AUC, area under the curve; rbc, red blood cells; MSC, model selection criterion; WSS, sum of squared differences; SSR, sum of squared residuals; Hct, hematocrit.
- Received November 5, 2005.
- Accepted May 31, 2006.
- The American Society for Pharmacology and Experimental Therapeutics


