


Abstract
Unbound IC50 (IC50,u) values of 15 drugs were determined in eight recombinantly expressed human cytochromes P450 (P450s) and human hepatocytes, and the data were used to simulate clinical area under the plasma concentration-time curve changes (δAUC) on coadministration with prototypic CYP2D6 substrates. Significant differences in IC50,u values between enzyme sources were observed for quinidine (0.02 μM in recombinant CYP2D6 versus 0.5 μM in hepatocytes) and propafenone (0.02 versus 4.1 μM). The relative contribution of individual P450s toward the oxidative metabolism of clinical probes desipramine, imipramine, tolterodine, propranolol, and metoprolol was estimated via determinations of intrinsic clearance using recombinant P450s (rP450s). Simulated δAUC were compared with those observed in vivo via the ratios of unbound inhibitor concentration at the entrance to the liver to inhibition constants determined against rP450s ([I]in,u/Ki) and incorporating parallel substrate elimination pathways. For this dataset, there were 20% false negatives (observed δAUC ≥ 2, predicted δAUC < 2), 77% correct predictions, and 3% false positives. Thus, the [I]in,u/Ki approach appears relatively successful at estimating the degree of clinical interactions and can be incorporated into drug discovery strategies. Using a Simcyp ADME (absorption, metabolism, distribution, elimination) simulator (Simcyp Ltd., Sheffield, UK), there were 3% false negatives, 94% correct simulations, and 3% false positives. False-negative predictions were rationalized as a result of mechanism-based inhibition, production of inhibitory metabolites, and/or hepatic uptake. Integrating inhibition and reaction phenotyping data from automated rP450 screens have shown applicability to predict the occurrence and degree of in vivo drug-drug interactions, and such data may identify the clinical consequences for candidate drugs as both “perpetrators” and “victims” of P450-mediated interactions.
Inhibition of cytochrome P450 (P450) metabolism is recognized as one of the more prevalent mechanisms of clinical drug-drug interactions (DDIs) and may result in serious clinical and toxicological consequences (Nelson, 2002). During the past 2 decades, both in vitro and in vivo assessments of the P450 inhibition potential and disposition of drugs have led to a relatively thorough appreciation of the underlying reasons for certain drug combinations resulting in significant clinical outcomes. Application of this knowledge has led researchers to propose strategies that assess the potential of new chemical entities to cause clinical DDIs via inhibition of P450 metabolism. As a result, in the past decade or so, in vitro screens that determine the degree of P450 inhibition have become commonplace in drug discovery screening cascades. These screens are used to evaluate and optimize potential candidate drugs and to prioritize and design suitable clinical studies.
In vitro-in vivo extrapolation (IVIVE) strategies used for P450 inhibition-mediated DDIs range from simple but useful “rule of thumb” alerts, such as if inhibition constant (Ki) of <1 μM, DDIs are probable; Ki between 1 and 10 μM, DDIs are possible; and Ki > 10 μM, DDIs are unlikely (Lin and Pearson, 2002; Obach et al., 2005), to more quantitative approaches. There exists a broad consensus as to the common principles underlying predicting the magnitude of an in vivo DDI from in vitro data. The increase in the area under the plasma concentration-time curve (δAUC) of a substrate when coadministered in the presence of an inhibitor of the substrates' elimination pathway is a function of the ratio of inhibitor concentration ([I]) to inhibition constant (Ki) (Ito et al., 1998; Rostami-Hodjegan and Tucker, 2004; Brown et al., 2005; Shou, 2005; Obach et al., 2006; Einolf, 2007).
Although the basic tenets of IVIVE for P450 inhibition-mediated DDIs are widely accepted, the specific methodology used can vary. The “unbound drug hypothesis” is a widely accepted fundamental principle of pharmacokinetics, and there is increasing support for the use of unbound maximum inhibitor concentration entering the liver after p.o. administration ([Iin,u]) as the most appropriate surrogate for inhibitor concentration at the enzyme active site (Ito et al., 2002; McGinnity et al., 2005; Obach et al., 2006). Use of [I]total rather than [I]u has been proposed, usually for pragmatic reasons, to retrospectively account for observed interactions (Venkatakrishnan et al., 2003; Brown et al., 2006) or as a cautious strategy in early drug discovery to avoid underestimation of in vivo interactions (Ito et al., 2002; McGinnity et al., 2005). The impact of nonspecific binding on estimating unbound Ki is increasingly understood (Grime and Riley, 2006), and the sensitivity of IVIVE predictions to both the absorption rate constant of the inhibitor (ka) and fraction metabolized by the inhibited pathway (fm) of the substrate has been exemplified (Brown et al., 2005; McGinnity et al., 2005). The wide array of input parameters applied to the retrospective IVIVE of clinical DDI studies in the literature somewhat obfuscates a comprehensive and systematic ab initio IVIVE approach for new chemical entities.
Estimating Ki values of inhibitors traditionally used human liver microsomes, but more recently recombinant human P450s (rP450s) CYP1A2, CYP2B6, CYP2C8, CYP2C9, CYP2C19, CYP2D6, CYP3A4, and CYP3A5 have been frequently used. Clinical interactions are usually classified as being dependent on one of the individual P450 enzymes, and indeed this is appropriate for the more selective substrates. As part of a more systematic and holistic approach to IVIVE and with the appropriate assays now available, it is possible to propose an integrated assessment of the inhibitory potential of the perpetrator against all eight P450s while similarly evaluating the contribution of individual P450s to the elimination of the victim substrate.
The aims of this work were first to assess the contribution of individual P450s toward the total clearance of classic CYP2D6 substrates imipramine, desipramine, tolterodine, propranolol, and metoprolol and to estimate Ki values for a range of marketed drugs in all eight rP450s. Human hepatocytes, the closest in vitro model to human liver, were evaluated as an alternate P450 source. This article provides further assessment of the Iin,u/Ki,u approach for the in vivo prediction of P450-mediated DDIs from in vitro data and highlights both successes and limitations of this method within a drug discovery setting.
In addition, the use of the Simcyp ADME (absorption, metabolism, distribution, elimination) simulator (Simcyp Ltd., Sheffield, UK) to simulate clinical AUC changes (δAUC) of drugs when coadministered with P450 inhibitors was also evaluated. Simcyp incorporates a physiologically based method that simulates the change in inhibitor and substrate concentrations over time, the generation of inhibitory metabolites, the inhibition of gastrointestinal metabolism, active uptake of the inhibitor into the liver, and the impact of population variability.
Materials and Methods
Materials. Amitriptyline, chlorpromazine, cimetidine, desipramine, diltiazem, diphenhydramine, (±) fluoxetine, imipramine, labetalol, (±) metoprolol, mexiletine, (±) norfluoxetine, propafenone, propranolol, quinidine, ritonavir, tolterodine, verapamil, β-NADPH, and trichloroacetic acid were purchased as the highest grade available from Sigma-Aldrich Chemical (Gillingham, UK). Fluconazole and sertraline were purchased from Sequoia Research Products Ltd. (Oxford, UK). Omeprazole was synthesized at AstraZeneca R&D (Wilmington, DE). Dimethyl sulfoxide and acetonitrile were purchased from Fisher Scientific (Loughborough, UK), and methanol was purchased from Romil Ltd. (Cambridge, UK).
rP450s and Human Hepatocytes. Bactosomes prepared from Escherichia coli cells coexpressing recombinant human NADPH-P450 reductase and human P450s (CYP1A2LR, CYP2B6LR, CYP2C8R, CYP2C9R, CYP2C19R, CYP2D6LR, CYP3A4LR, and CYP3A5LR) were purchased from Cypex (Dundee, UK). Fresh human hepatocytes were prepared from an isolated lobe of human liver (obtained from local hospitals with ethical approval) using a procedure described previously (McGinnity et al., 2004). For convenience, human hepatocytes were cryopreserved and thawed before use (McGinnity et al., 2004). Briefly, aliquots (20 ml) of hepatocyte suspension buffer (with no added albumin) were prewarmed to 37°C. Cryopreserved cells were removed from liquid N2 and immediately immersed in a water bath that had been preheated to 37°C. The vials were shaken gently until the contents were completely free of ice crystals and were then emptied into the prewarmed hepatocyte suspension buffer. The cells were centrifuged at 40g for 5 min at 19°C; the supernatant was removed by aspiration; and the resultant pellet was suspended in hepatocyte suspension buffer. The concentration and viability (≥85%) of the hepatocytes were determined using trypan blue exclusion, and the cells were resuspended at a concentration of 2 million cells/ml.
Inhibition Assays. Inhibition assays using rP450s were performed on a robotic sample processor (RSP) (Genesis RSP 150, Tecan, Reading, UK). Bufuralol 1-hydroxylation (Weaver et al., 2003) was used as a probe reaction for CYP2D6 based on methods previously described. The P450 isoform selectivity of bufuralol (Weaver et al., 2003) has been previously established. All the reactions were conducted under conditions shown to be linear with respect to time and protein concentration. IC50 determination was based on seven and five inhibitor concentrations for the rP450s and human hepatocytes, respectively.
Determination of IC50 Using Bufuralol 1′-Hydroxylase Activity and rCYP2D6. The assay was carried out as described by Weaver et al. (2003). Using bufuralol as a substrate, the product of the reaction is 1′-hydroxybufuralol, which is separated from the incubation mixture using high-performance liquid chromatography (HPLC). Interaction with CYP2D6 by an inhibitor will result in a decrease in the amount of 1′-hydroxybufuralol produced. Assays were performed at a substrate concentration equivalent to the apparent Km (10 μM) of the CYP2D6-dependent bufuralol 1′-hydroxylase activity. The amount of rCYP2D6 used in the bufuralol 1′-hydroxylation assay was 5 pmol/ml (0.015 mg protein/ml of incubate; one batch of rCYP2D6 was used for all the experiments). The following volumes are used in each incubation well: 20 μl of 10 mM NADPH in 0.1M phosphate buffer, pH 7.4, 178 μl of P450/substrate, and 2 μl of the predilution stocks of inhibitor were spiked directly into the incubation microtiter plate. The final incubation volume was 200 μl, giving 100-fold dilutions of the solvent stocks of the inhibitor generated in the predilution microtiter plate and a final concentration of 1 mM NADPH. The dilution of test compounds for a 7-point IC50 determination by the RSP was programmed as follows: the primary stock of each compound (e.g., 5 mM) was prepared manually in dimethyl sulfoxide and serially diluted by the RSP (using dimethyl sulfoxide) to give six secondary solutions (e.g., 5 mM to 20 μM). Each of these secondary solutions was further diluted 1:5 in 100 mM phosphate buffer, pH 7.4, to generate tertiary solutions (e.g., 1 mM to 4 μM). Finally, 10 μl of each of the tertiary solutions was spiked into the incubation mix (200 μl of total volume to give final concentrations; e.g., 50 to 0.2 μM). An incubation-containing vehicle alone allowed calculation of control activity. The final organic solvent concentration in all the incubations was 1% (v/v).
Incubations were conducted for 15 min, and reactions were quenched with the addition of 200 μl of methanol. Samples were chilled at –20°C for 2 h, spun at 3500 rpm for 15 min at 4°C, and the supernatants transferred to vials for analysis as described below.
Determination of IC50 Using Bufuralol 1′-Hydroxylase Activity and Human Hepatocytes. This assay was performed using manual pipetting in a shaking water bath at 37°C. An appropriate amount of bufuralol (final assay concentration 10 μM) was aliquoted, and the solvent was evaporated under nitrogen to dryness before resuspension in hepatocyte suspension buffer [2.2 g of NaHCO3, 2.34 g of Na HEPES, 1 liter of powder equivalent of Dulbecco's modified Eagle's medium (Sigma, Gillingham, UK) diluted in 1 liter of water and adjusted to pH 7.4 with 1 M HCl] to give a concentration of 200 μM. Drug stocks were prepared in dimethyl sulfoxide at 100-fold incubation concentration (e.g., 5000, 1500, 100, 15, and 5 μM). Ten microliters of this ×100 stock was added to a vial containing 490 μl of hepatocyte suspension buffer containing substrate. A 7-ml glass bijou vial containing 250 μl of hepatocytes at a concentration of 2 million cells/ml was preincubated for 5 min in a shaking (80 oscillations/min) water bath at 37°C along with the vial containing the drug/buffer/substrate mix. Reactions were started by adding 250 μl of drug/buffer/substrate mix to the 250 μl of hepatocytes giving, in the example shown, final inhibitor concentrations of 50, 15, 1, 0.15, and 0.05 μM. The final concentration of organic solvent in all the incubations was 1% (v/v). The samples were incubated for 30 min and quenched with an equivalent volume of ice-cold methanol before being frozen for 2 h at –20°C and then centrifuged for 3500 rpm for 15 min at 4°C. The supernatants were removed and transferred into vials and analyzed as described below. Assays were performed in triplicate.
P450 Intrinsic Clearance Determination. P450 intrinsic clearance (CLint) determination assays were performed using an RSP as described previously (McGinnity et al., 2000). In brief, the primary stock of all the substrates was prepared in dimethyl sulfoxide at ×100 the final incubation concentration. The final concentration of organic solvent in the incubation was 1% v/v. All the substrates were incubated at 1 μM. Compound stocks were prediluted in 100 mM potassium phosphate buffer, pH 7.4, and eight rP450s (CYP1A2, CYP2B6, CYP2C8, CYP2C9, CYP2C19, CYP2D6, CYP3A4, and CYP3A5) were added to separate incubation tubes (100 pmol P450/ml final) located in a 96-well block at 37°C. A subaliquot was removed to produce a 0-min time point, and the assay was initiated via addition of NADPH (1 mM final). Aliquots (50 μl) were removed at 5, 10, 15, and 20 min and quenched in 100 μl of acetonitrile. Samples were subsequently frozen for 2 h at –20°C and then centrifuged at 3500 rpm at 4°C for 15 min. The supernatants were removed and transferred into vials and analyzed as described below.
Determination of Unbound Fraction in Plasma and Unbound Fraction in Incubation in rCYP2D6 and Human Hepatocytes. Human blood was obtained from volunteers at AstraZeneca R&D Charnwood after local ethical approval and written informed consent. The extent of binding of compounds to rCYP2D6, human plasma, and human hepatocytes was determined using equilibrium dialysis at 37°C as described by Austin et al. (2005). Briefly, plasma was prepared by centrifugation of the blood, stored in EDTA tubes, at 350g for 15 min. The amount of rCYP2D6 used was the same as for the bufuralol and dextromethorphan inhibition assays (0.015 and 0.06 mg protein/ml, respectively, in 100 mM phosphate buffer, pH 7.4). The amount of human hepatocytes used was the same as for the inhibition assays [1 million cells (left to die for 24 h before use)/ml hepatocyte suspension buffer]. Plasma and microsomal binding are normally independent of compound concentration at typical therapeutic levels (0.1–50 μM) (Austin et al., 2005), and so binding was determined at a single concentration (10 μM for plasma and 1 μM for rP450 and hepatocytes). Compounds were solubilized in dimethyl sulfoxide, and the final organic solvent concentration was 1% (v/v). Plasma was dialyzed against Dulbecco's phosphate-buffered saline, pH 7.4 (Sigma), rP450 against 0.1 M phosphate buffer, pH 7.4, and hepatocytes against hepatocyte suspension buffer overnight at 37°C. Samples were quantified using HPLC/mass spectrometry (MS) as described below. The free fraction of each compound was determined from the ratio of buffer to sample concentrations, each interpolated from a 6-point calibration curve.
HPLC/MS. All the HPLC/MS used electrospray ionization and multiple reaction monitoring conducted on a Micromass Quattro Ultima triple quadrupole and an Alliance HT Waters 2790 HPLC system (Waters, Milford, MA). Aliquots (30 μl) were analyzed by HPLC/tandem MS (MS/MS) for 1′-hydroxybufuralol appearance. A Devosil C30 column (Phenomenx, Cheshire, UK) and mobile phases of 0.1% formic acid in water (A) and 0.1% formic acid in methanol (B) were used for the chromatography. The gradient was as follows: 97% A (0–0.3 min), 5% A (0.55–1.55 min), and 97% A (1.6 min). The stop time was 2.5 min; the flow rate was 1.2 ml/min; and column temperature was 40°C. All the other analyses were performed using a Symmetry C8 (5 μm × 3.9 mm × 20 mm column; Waters) and a gradient of 1% acetonitrile/99% 0.05% aqueous ammonium acetate to 99% acetonitrile/1% 0.05% aqueous ammonium acetate at a flow rate of 2 ml/min over 3.5 min and a column temperature of 40°C.
Data Analysis. Microsoft Excel (Redmond, WA) was used to calculate IC50 estimates by linear transformation of the raw data. The data were corrected for both background and control activities.
All the rP450 assays were performed at a substrate concentration equivalent to the Km of the CYP2D6 reaction as under these conditions, irrespective of the type of reversible inhibition, IC50 should be within 2-fold of the Ki (Cheng and Prusoff, 1973). For hepatocytes, inhibition assays were performed at a bufuralol concentration of 10 μM to ensure selectivity for CYP2D6 (apparent Km of the CYP2D6 reaction in human hepatocytes was 100 μM; data not shown) as under these conditions IC50 should be within 2-fold of the Ki for competitive, noncompetitive, and linear mixed-type inhibition and only differ significantly for uncompetitive inhibition (Cheng and Prusoff, 1973), which is a rare inhibition type for P450s (Zhang and Wong, 2005). The inhibition type has not been fully elucidated for all the inhibitors studied in this work; therefore, in the absence of this information, Ki = IC50/2 was uniformly applied. As a generic strategy, this is appropriate because in the drug discovery environment, IC50 rather than Ki values are generated initially, and the precise type of reversible inhibition is usually defined later.
The theoretical basis underlying the quantitative predictions of drug interactions associated with reversible inhibition has been covered comprehensively in the literature (Ito et al., 1998; Rostami-Hodjegan and Tucker, 2004; Brown et al., 2005; Shou, 2005; Obach et al., 2006; Einolf 2007). In brief, the ratio change of AUC in the presence or absence of a P450 inhibitor can be approximated by eq. 1, according to the “well stirred model” (Ito et al., 1998). In clinical situations, the substrate concentration is usually much lower than the Km; therefore, eq. 1 is valid for competitive and noncompetitive inhibitors. It does not account for P450 inhibition in the gastrointestinal tract (less significant in this dataset because of the lack of CYP3A substrates) and disregards the change in inhibitor concentration during the dosing interval.  where fmx is the fraction of substrate clearance mediated by P450x, Kix is the inhibition constant for P450x, and Iin,u is maximum unbound hepatic input concentration.
[I]in,u was estimated as follows:  where [I]av is the average inhibitor concentration {[I]av = (D/τ)/(CL/F)}; D and τ are the dose and the dosing interval of the inhibitor, respectively; ka is the absorption rate constant; Fa is the fraction absorbed from the gastrointestinal tract; Qh is hepatic blood flow; and fub is the fraction unbound in blood. Blood/plasma ratios have been sourced for several of the compounds, and the value is included in the predictions. For those compounds where the blood/plasma ratio has not been collated, a value of 1 has been used.
Simcyp ADME Simulator. Relative to the approach described by eq. 1, the Simcyp ADME Simulator (Simcyp Ltd.) is a more physiologically based DDI prediction method (Rostami-Hodjegan and Tucker, 2004; Einolf, 2007). In addition to the considerations incorporated into eq. 1, the Simcyp approach uses a physiological-based pharmacokinetic model and so incorporates the change in inhibitor and substrate concentrations over time, the generation of inhibitory metabolites, the inhibition of gastrointestinal metabolism, the ability to simulate active uptake of the inhibitor into the liver, and the impact of population variability. Therefore, whereas the approach outlined via eq. 1 can only predict a mean outcome, Simcyp can simulate the expected variability within a population and importantly identify those individuals at most risk (Rostami-Hodjegan and Tucker, 2004). Simulations were generated for substrates desipramine, imipramine, and metoprolol using the default input parameters that were within the existing library that is supplied with the program, and for propranolol using the CLint and relative contribution of the individual rP450s toward the oxidative metabolism determined in these studies. All the input parameters for the inhibitors were as detailed under Results.
Literature in Vivo Drug Interaction Data. All the literature clinical interaction studies used a crossover design and between 5 and 24 subjects and were at steady state for inhibitor with the exception of Bergstrom et al. (1992) and at steady state for substrate except for the following studies: Brøsen and Gram (1989), Hamelin et al. (2000), Johnson and Burlew (1996), Tateishi et al. (1989), and Spina et al. (1993), in which the interaction was determined following a single dose. CYP2D6 poor metabolizers were excluded via either genotyping or phenotyping assessment except in the following studies in which CYP2D6 status was not determined: Bergstrom et al. (1992), Donn et al. (1984), Keech et al. (1986), Kirch et al. (1982, 1984), Kowey et al. (1989), Hermann et al. (1992), Henry et al. (1987), Hunt et al. (1990), Murdoch et al. (1991), Vestal et al. (1979), Tateishi et al. (1989), and von Moltke et al. (1998).
Results
Determination of Unbound IC50 Values for Probe Inhibitors in rP450s.Table 1 shows the mean unbound IC50 (IC50,u) values against the eight major human hepatic P450s (rCYP1A2, rCYP2B6, rCYP2C8, rCYP2C9, rCYP2C19, rCYP2D6, rCYP3A4, and rCYP3A5) for a selection of compounds that have been investigated in clinical studies as perpetrators of DDIs against predominantly CYP2D6 substrates. The in vitro CYP2D6 potency ranged from 20 nM for propafenone and quinidine to 91 μM for cimetidine. All the compounds were also assessed for time-dependent inhibition of CYP2D6, and none was observed (data not shown).
Determination of IC50,u of individual human P450s for probe inhibitors
Results are expressed as the mean IC50 of duplicate determinations. The IC50 measurements were carried out as described under Materials and Methods. Because of the very low protein concentration used in the assays (∼0.01 mg/ml), fuinc approached unity for all the compounds (>0.8).
P450 Reaction Phenotyping of Prototypic CYP2D6 in Vivo Substrates.Table 2 shows the CLint of eight individual human rP450s to the oxidative metabolism of desipramine, imipramine, tolterodine, propranolol, and metoprolol. Substrates were incubated at a low substrate concentration of 1 μM with rCYP1A2, rCYP2B6, rCYP2C8, rCYP2C9, rCYP2C19, rCYP2D6, rCYP3A4, and rCYP3A5, respectively, as described under Materials and Methods. The range of P450 CLint determined was 0.01 to 10 μl/min/pmol P450. The contributions of individual P450s toward oxidative metabolism of compounds in human liver were estimated (Table 3), considering the average percentage content of the eight major isoforms in human hepatic microsomes as outlined under Materials and Methods. Desipramine was estimated to be predominantly cleared by CYP2D6 (fraction metabolized by CYP2D6, 0.97) and to a small extent by CYP2C19 (0.03); imipramine by CYP2D6 (0.55), CYP2C19 (0.31), CYP3A4 (0.09), and CYP1A2 (0.02); tolterodine by CYP2D6 (0.79), CYP2C19 (0.08), CYP2C8 (0.02), CYP2B6 (0.01), and CYP3A5 (0.01); propranolol by CYP2D6 (0.73), CYP2C19 (0.15), and CYP1A2 (0.12); and metoprolol was metabolized exclusively by CYP2D6 (1.00). Up to 10% of the clearance of metoprolol is via renal elimination (Regårdh and Johnsson, 1980); therefore, the value of fmP450 used for metoprolol was 0.9. The other substrates were assumed to be cleared exclusively by hepatic P450 (i.e., fmP450 = 1), although the fmP450 of propranolol may be somewhat less than unity owing to the contribution of glucuronidation to overall clearance (Tateishi et al., 1992).
Determination of P450 CLint of individual human P450s to oxidative metabolism
Estimation of fraction metabolized by individual major human hepatic P450s
The fraction metabolized by P450s in human liver is estimated by accounting for the mean fraction abundance of each individual P450 human liver as determined by Rowland Yeo et al. (2004) (CYP1A2 0.11, CYP2B6 0.07, CYP2C8 0.07, CYP2C9 0.17, CYP2C19 0.026, CYP2D6 0.02, CYP3A4 0.38, and CYP3A5 0.03).
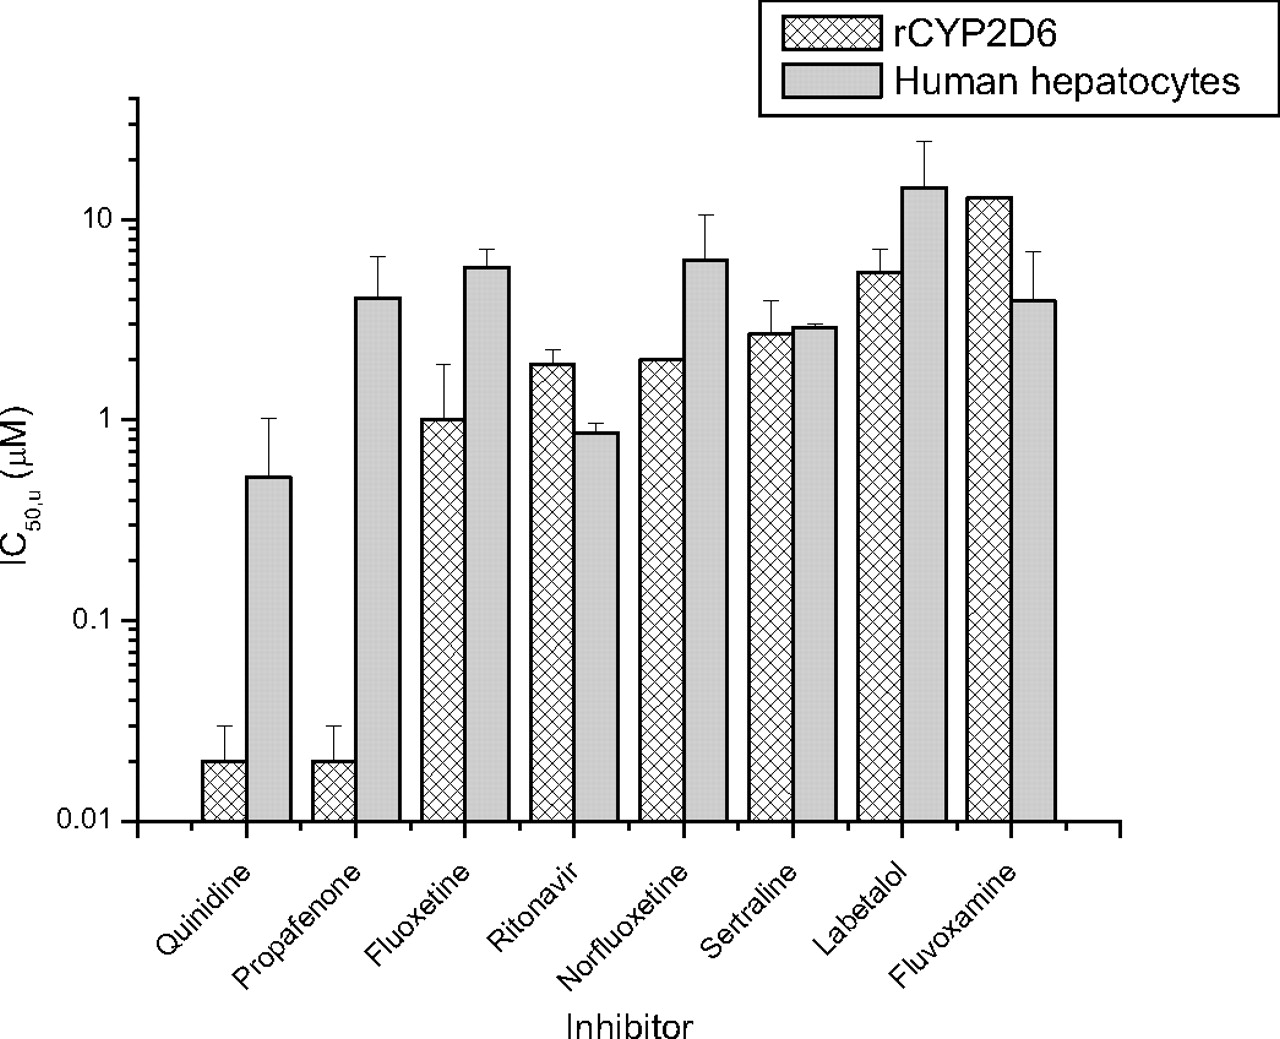
Comparison of IC50,u Values in Human Hepatocytes and rCYP2D6.Figure 1 shows the IC50,u values determined using bufuralol 1′-hydroxylase activity in human hepatocytes and rCYP2D6 for seven compounds. IC50,apparent values were converted to IC50,u values, correcting for the unbound fraction determined in the appropriate milieu (fuinc). For fluoxetine, norfluoxetine, fluvoxamine, ritonavir, sertraline, and labetalol, the IC50,u values determined in human hepatocytes were within 6-fold of the value determined in rCYP2D6. More significant differences in IC50,u values between the rP450s and hepatocytes were observed for quinidine (mean IC50,u ± S.D. was 0.02 ± 0.01 μM in rCYP2D6 versus 0.5 ± 0.4 μMin human hepatocytes) and propafenone (0.02 ± 0.01 versus 4.1 ± 2.4 μM).
Predicting the Magnitude of Clinical DDIs from in Vitro IC50Values. The success of predicting clinical δAUC changes of desipramine, imipramine, tolterodine, propranolol, or metoprolol when coadministered with other drugs via IC50 values using rP450s was evaluated (Table 4). From clinical studies, the dosing size and interval of potential DDI perpetrators were recorded, and the relevant human pharmacokinetic parameters (clearance, CL; bioavailability, F; half-life, t1/2; absorption rate constant, ka; fraction absorbed, Fa) were collated for all the inhibitors. [I]in values, estimates of inhibitor concentrations at the entrance to the liver, were calculated using eq. 2. Fraction unbound in plasma (fup) for all the inhibitors was determined as described under Materials and Methods and, together with [I]in values, used to estimate [I]in,u.
Summary of data inputs and outputs for δAUC predictions for a set of P450-mediated DDIs
Dose size/interval and observed δAUC were retrieved from the listed references. Human pharmacokinetics parameters (CL, F, t1/2, ka, and oral Fabs) were sourced from several key compendiums including Goodman and Gilman's The Pharmacological Basis of Therapeutics, 9th and 10th eds (Hardman et al. 1996); Dollery's Therapeutic Drugs, 2nd ed (1999); Taeschner and Vozeh's Drug Data Handbook, 3rd ed (1998), and Bertz and Granneman (1997).
The predicted in vivo δAUC was determined using the [I]in,u/Ki approach (eq. 1 and by inputting the appropriate values for the inhibitor and substrate into the Simcyp ADME simulator. Figure 2 shows the plot of predicted δAUC, using eq. 1, versus observed δAUC, based on Ki values estimated from rP450s (A) and human hepatocytes (CYP2D6 activity only) (B). Several inhibitors—amitriptyline, chlorpromazine, cimetidine, diltiazem, diphenhydramine, labetalol, mexiletine, omeprazole, sertraline, and verapamil—were correctly predicted by both the [I]in,u/Ki method and Simcyp to cause insignificant DDIs (predicted and observed δAUC < 2). Of the significant interactions (defined as observed δAUC > 2), using rP450 as the enzyme source, the interaction of quinidine with desipramine, metoprolol, and imipramine (observed δAUC values of 7.5, 3.2, and 1.5, respectively) was correctly identified yet systematically overestimated using the [I]in,u/Ki method (predicted δAUC was 29, 9.1, and 2.3, respectively). Simcyp similarly overestimated the quinidine interaction with desipramine and imipramine [observed versus simulated δAUC 7.5 versus 19 (range 11–34) and 1.5 versus 4.8 (range 1.8–10), respectively] but estimated well the degree of interaction with metoprolol [3.2 versus 3.5 (1.9–6.5)]. The interaction of propafenone with propranolol (observed δAUC of 2.1) was correctly identified but overestimated using the [I]in,u/Ki method (δAUC 5.5) compared with Simcyp [δAUC 2.6 (1.6–4.6)]. The interaction of fluvoxamine with imipramine (observed δAUC 3.6) was underpredicted using the [I]in,u/Ki method (δAUC 1.7) but was correctly classified if still underpredicted using Simcyp (δAUC 2.1, range 1.7–2.8). The interaction of ritonavir with desipramine (observed δAUC 2.5) was somewhat underpredicted using [I]in,u/Ki (δAUC 1.4) and Simcyp (δAUC 1.2, range 1.1–1.5), whereas the interaction of fluoxetine with all the substrates was significantly underpredicted using [I]in,u/Ki (Table 4). Using Simcyp to simulate the in vivo contribution of the major human metabolite of fluoxetine, norfluoxetine, by inputting the rP450 Ki values (Table 1), the mechanism-based inhibition of CYP3A4 and CYP2C19 by fluoxetine (Mayhew et al., 2000; McGinnity et al., 2006), and using the maximum active uptake factor of 1000 of both drug and metabolite into the liver resulted in a good estimation of the degree of interaction with imipramine [observed δAUC 3.3 versus simulated δAUC 3.8 (2.0–7.7)], but the interaction with desipramine was still somewhat underestimated (Table 4).

IC50,u comparisons using bufuralol as a CYP2D6 substrate in recombinant enzyme and human hepatocytes. The IC50,apparent values were corrected for fu determined in rCYP2D6 (hashed bars) and human hepatocytes (solid bars) to generate IC50,u values as outlined under Materials and Methods. The bar height represents the mean value from three separate determinations, and the error bar represents the standard deviation from the mean.
The measured IC50,u values of fluoxetine, norfluoxetine, fluvoxamine, ritonavir, labetalol, or sertraline for CYP2D6 did not significantly alter between rP450 and cryopreserved human hepatocytes. However, the IC50,u for propafenone determined in hepatocytes was higher (human hepatocytes, 4.1 ± 2.4 μM versus rCYP2D6, 0.02 ± 0.01 μM), resulting in a closer prediction of the interaction with propranolol (using [I]in,u/Ki method predicted δAUC, 1.9 versus observed δAUC, 2.1). Similarly for quinidine, the CYP2D6 IC50,u determined in hepatocytes was higher than in rP450 (0.5 ± 0.4 versus 0.02 ± 0.01 μM, respectively), resulting in a closer prediction of the interaction with metoprolol (predicted δAUC 3.2 versus observed δAUC 3.2), desipramine (6.2 versus 7.5, respectively), and imipramine (2.0 versus 1.5, respectively).
Discussion
The prediction of DDIs mediated via reversible P450 inhibition typically relies on the use of the [I]/Ki ratio. By using rP450s as the enzyme source in the determination of IC50 or Ki values, very low protein levels are afforded, and typically fuinc approaches 1 and the experimentally generated IC50,apparent values approach IC50,u. The need to determine the unbound rather than apparent parameter such as Km, CLint, IC50, and therefore Ki has been recently re-emphasized (Rostami-Hodjegan and Tucker, 2004; Grime and Riley, 2006). This was the case with the P450 inhibitors studied in this work; therefore, the term included in the [I]in,u/Ki expression equates essentially to Ki,u. The use of apparent or total in vitro and in vivo parameters and the failure to incorporate parallel substrate elimination pathways confound the IVIVE theory of DDI. Similarly, in the absence of supporting data, the use of theoretical maximum values of absorption rate (ka) and extent (Fa) for potential DDI perpetrators (Brown et al., 2005), although potentially useful to avoid false-negative predictions in drug discovery, obfuscates assessing the potential of IVIVE methodology to make quantitative predictions based on pharmacokinetic principles and not empirical observations alone. In this analysis, values of ka, Fa, and blood/plasma partitioning, where available, were applied. However, the [I]in,u/Ki approach disregards the change in inhibitor concentration during the dosing interval, does not incorporate the effect of inhibitory metabolites, and cannot easily assess population variability. Therefore, a prediction software tool that offers an integrated population-based solution to P450-mediated DDIs (Simcyp; Rostami-Hodjegan and Tucker, 2007) was also evaluated. Simcyp incorporates physiological, genetic, and epidemiological information, which, together with in vitro data, facilitates the modeling and simulation of the time course and fate of drugs in representative virtual patient populations. This allows prediction of outcomes in those individuals at most risk from a DDI, not just a single value in an “average human,” a limitation of the [I]/Ki approach outlined in this work.
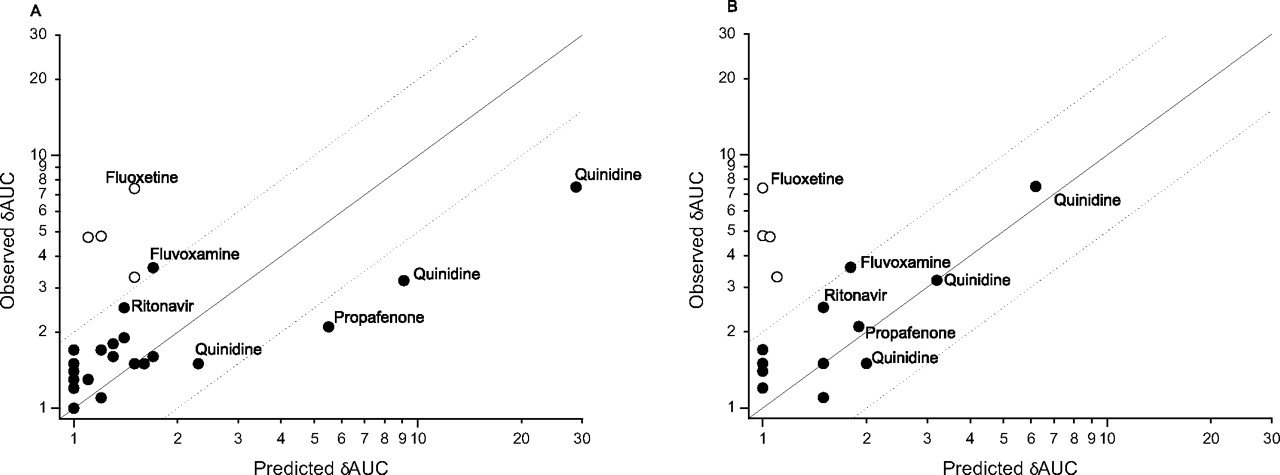
Plot of observed versus predicted δAUC values using the Iin,u/Ki approach shown in Table 4 using Ki values generated in rP450s (A) or using CYP2D6 Ki values generated in human hepatocytes (B). For B, the Ki values from rP450s except CYP2D6 were included in eq. 1. Predicted or observed δAUC ≥ 2 data points are labeled with the name of the inhibitor. The open circles represent fluoxetine values. The solid line equals unity. The dashed lines signify 2-fold errors.
The IC50,u values against the eight major human hepatic P450s (rCYP1A2, rCYP2B6, rCYP2C8, rCYP2C9, rCYP2C19, rCYP2D6, rCYP3A4, and rCYP3A5) were determined (Table 1). Some of the more potent CYP2D6 inhibitors (propafenone, quinidine, and chlorpromazine) were relatively selective for CYP2D6 over the remaining seven P450s, whereas the majority of inhibitors, including fluoxetine (and its active metabolite norfluoxetine), ritonavir, sertraline, amitriptyline, fluvoxamine, omeprazole, diltiazem, verapamil, mexiletine, and cimetidine, showed similar or indeed greater inhibitory potency toward a range of P450s. Because none of the compounds showed time-dependent inhibition against CYP2D6, the assumption was that the interaction of all the compounds and CYP2D6 was of a competitive, reversible nature.
The CLint and relative contribution of the individual rP450s toward the oxidative metabolism of desipramine, imipramine, tolterodine, propranolol, and metoprolol were estimated (Tables 2 and 3, respectively) considering the average content of the eight major isoforms in human liver (Rowland Yeo et al., 2004). This laboratory has previously shown the kinetic parameters (including Km and Vmax) of the E. coli–derived rP450 to be similar to their human liver counterparts and the application of these recombinant enzymes in estimating the enzymology of human P450 metabolism (McGinnity et al., 1999, 2000). Desipramine was cleared predominantly by CYP2D6 (CYP2D6 » CYP2C19), whereas the metabolism of imipramine was less dependent on one isoform (CYP2D6 > CYP2C19 > CYP3A4 > CYP1A2) as was tolterodine (CYP2D6 > CYP2C19 > CYP2C8 ∼ CYP2B6 ∼ CYP3A5) and propranolol (CYP2D6 > CYP2C19 > CYP1A2). Metoprolol was metabolized exclusively by CYP2D6, albeit the fmP450 of total clearance was estimated at 0.9 as a result of the minor renal component of human clearance (Regårdh and Johnsson, 1980). The fm estimates for CYP2D6 determined using rP450s were in broad agreement with those recently calculated from independent in vitro and in vivo methods, thus providing additional confidence to this approach (Ito et al., 2005; Gibbs et al., 2006).
The value of the [I]/Ki approach as an adjunct to “rule of thumb” alerts, based on inhibition constant alone, is exemplified by chlorpromazine and CYP2D6. Chlorpromazine is a relatively potent inhibitor of CYP2D6 (IC50,u = 0.3 μM) (Table 1), and yet because of the estimated low unbound inhibitor concentration at the entrance to the liver (Iin,u = 0.04 μM), the predicted and observed in vivo δAUC are low (1.2 and 1.7, respectively) (Table 4). The need to incorporate parallel pathways of drug elimination and define the enzymology of P450 metabolism has been recently recognized as an important consideration for IVIVE (Rodrigues et al., 2001; Yao and Levy, 2002; Rostami-Hodjegan and Tucker, 2004; Ito et al., 2005; Obach et al., 2006). Indeed, the CYP2D6-mediated DDIs of desipramine, metoprolol, and imipramine, substrates cleared to varying extents by CYP2D6, exemplify this concept. When coadministered with the selective CYP2D6 inhibitor quinidine (200 mg), desipramine, with the highest fmCYP2D6 of 0.97, generated the highest δAUC using the [I]in,u/Ki prediction (29) and observed (7.5) values. Quinidine (100 mg) and metoprolol (fmCYP2D6 0.90) generated the next highest predicted δAUC (9.1) and observed (3.2) interaction, whereas quinidine (200 mg) and imipramine (with the lowest fmCYP2D6 0.55) had the lowest predicted (2.3) and observed (1.5) interaction (Table 4; Fig. 2A). This is consistent with the analysis performed by Ito et al. (2005), in which incorporation of fm for CYP2D6 interactions improved the identification of true positive and negative DDIs from 54 to 84%. Although the ranking of the quinidine interactions with alternate substrates is correct, the magnitude is somewhat overpredicted (Table 4; Fig. 2A). This contrasts somewhat with a previous report (Grime and Riley, 2006), which estimated correctly the in vivo magnitude of the quinidine interaction with desipramine, metoprolol, and imipramine using an external database (Ito et al., 2004). Interrogation of the two datasets indicates that a minor (∼2-fold) difference in both fub and Ki values results in the ∼4-fold difference in δAUC prediction. In addition, compared with the [I]in,u/Ki method, the physiologically based Simcyp approach allows the simulation of the both the magnitude and range of an interaction within a defined population. Together these aspects advocate that databases and algorithms used for IVIVE should record variances of both in vitro and in vivo measurements and, via error propagation steps, provide estimates of the confidence intervals for predicted pharmacokinetic parameters, which are functions of variability in both in vitro and in vivo data and physiological factors.
For this data set, using rP450s to derive inhibition parameters and the [I]in,u/Ki approach, there were 6 (20%) false-negative results (observed δAUC ≥ 2, predicted δAUC < 2), 23 (77%) correct predictions, and 1 (3%) false-positive finding. Simcyp simulations resulted in 1 (3%) false-negative result, 27 (94%) correct predictions, and 1 (3%) false-positive finding. The extent of the interactions of fluoxetine with desipramine (predicted δAUC 1.5 versus observed δAUC 7.4), imipramine (1.5 versus 3.3), and tolterodine (1.1 versus 4.8) was significantly underestimated using the [I]in,u/Ki method (Table 4). There are several reports of underpredicting fluoxetine DDIs (Ito et al., 1998; Grime and Riley, 2006; Obach et al., 2006), but the reason(s) are as yet unclear. It is noteworthy that the use of [I]in,total/Ki,u predicts the fluoxetine interactions well (data not shown), albeit perhaps coincidentally. Fluoxetine is a mechanism-based inhibitor of both CYP3A4 (Mayhew et al., 2000) and CYP2C19 (McGinnity et al., 2006) but not CYP2D6 (Bertelsen et al., 2003). In addition, the major human metabolite norfluoxetine is approximately equipotent against CYP2D6 (Table 3), although the reported unbound plasma concentrations of norfluoxetine seem unlikely to account for the reported interactions (Jannuzzi et al., 2002). The total liver concentrations of fluoxetine (and norfluoxetine) are reported to be ∼30-fold higher than plasma (Vermeulen, 1998), and this information has been used to make a successful retrospective prediction of the fluoxetine clinical interaction with CYP2D6 substrate mexiletine (Hara et al., 2005). Simcyp was used to simulate the contribution of mechanism-based inhibition, norfluoxetine inhibition, and hepatic uptake of both fluoxetine and metabolite to the clinical interaction. This resulted in a good approximation of the fluoxetine/imipramine interaction [observed δAUC 3.3 versus Simcyp δAUC 3.8 (2.0–7.7)], but the observed magnitude of the fluoxetine/desipramine interaction could still not be simulated (Table 4). Despite the challenges, simulating and understanding such complex interactions will facilitate the future ability to make a priori predictions of compounds with analogous properties.
Primary hepatocytes provide the closest in vitro model to human liver and as such may afford advantages when predicting clinical DDI. Similar to a set of CYP2C9 inhibitors (McGinnity et al., 2005), the majority of compounds (fluoxetine, norfluoxetine, fluvoxamine, ritonavir, sertraline, and labetalol) showed comparable IC50,u values for CYP2D6 whether the enzyme source was rP450s or human hepatocytes. However, there were significant differences in IC50,u values for quinidine (0.02 ± 0.01 μM in rCYP2D6 versus 0.5 ± 0.4 μMin human hepatocytes) and propafenone (0.02 ± 0.01 versus 4.1 ± 2.4 μM, respectively). Interestingly, propafenone and quinidine are both high affinity P-glycoprotein substrates (Schmid et al., 1999; Neuhoff et al., 2003). Compounds such as these that may be actively transported by P-glycoprotein into the bile in vivo may be sequestered out of the suspended hepatocytes into the media, thus reducing the free concentration inside the cell and raising the apparent IC50,u value in hepatocytes versus that observed for rP450. Such a hypothesis is worthy of further investigation, as is the predictive power of hepatocytes versus rP450s or microsomes for substrates of hepatic efflux and uptake transporters. In these examples, the apparent IC50,u values generated in hepatocytes did appear to better simulate the clinical interaction of quinidine and propafenone with CYP2D6 substrates (Fig. 2B).
Fluoxetine and fluvoxamine have been shown to extensively partition in the liver, but there was no evidence of these compounds having higher unbound hepatocellular concentrations using this protocol, a result consistent with these compounds exhibiting similar unbound Ki values in rat hepatocytes and microsomes (Brown et al., 2007). The observed drug accumulation in the liver may simply result from intracellular binding or sequestration for these lipophilic bases (Brown et al., 2007). However, in a drug discovery setting, P450 inhibition in intact hepatocytes may still be warranted for late-stage clinical candidates, especially for compounds that concentrate in the liver as a result of cellular transport. In addition, as hepatocytes contain a comprehensive set of cofactors and drug-metabolizing enzyme pathways, metabolites of one pathway may lead to inhibition of another, a phenomenon indiscernible using single rP450s. However, the lack of a regular supply of good quality fresh human tissue likely precludes the routine use of human hepatocytes for such a purpose in many drug metabolism laboratories.
The incorporation of inhibition and reaction phenotyping data from simple and rapid rP450 screens may identify the clinical consequences for candidate drugs as “perpetrators” and/or “victims” of P450-mediated interactions and provide the basis for DDI avoidance strategies in our laboratory. The [I]in,u/Ki approach appears relatively successful at estimating the degree of such clinical interactions and can be readily incorporated into early drug discovery. The commercially available software Simcyp has been shown to be the most predictive model in this work (Einolf, 2007) and is becoming a useful simulation tool for use within drug discovery, development, and in the rationale and design of clinical DDI studies. Furthermore, evaluation of human hepatocytes as the enzyme source and mechanistic analysis of erroneous predictions should facilitate further refinements to in vitro DDI assays and IVIVE strategies.
Acknowledgments
We thank Anthony Atkinson and Matt Soars for technical assistance.
Footnotes
-
Article, publication date, and citation information can be found at http://dmd.aspetjournals.org.
-
doi:10.1124/dmd.108.020446.
-
ABBREVIATIONS: P450, cytochrome P450; DDI, drug-drug interaction; IVIVE, in vitro-in vivo extrapolation; AUC, area under the plasma concentration-time curve; [I]in,u, unbound maximum hepatic input concentration; rP450, recombinant cytochrome P450; δAUC, area under the plasma concentration-time curve change; RSP, robotic sample processor; HPLC, high-performance liquid chromatography; CLint, intrinsic clearance; MS, mass spectrometry; MS/MS, tandem mass spectrometry; fmx, fraction of total clearance metabolized by P450x; ka, absorption rate constant; IC50,u, unbound IC50; fuinc, unbound fraction in incubation; [I]in, maximum hepatic input concentration; fup, unbound fraction in plasma.
-
↵1 Current affiliation: Metabolism and Pharmacokinetics Group, Novartis Institute for Biomedical Research, Horsham, West Sussex, UK.
- Received January 14, 2008.
- Accepted March 17, 2008.
- The American Society for Pharmacology and Experimental Therapeutics


