


Abstract
The purpose of the study was to elucidate mechanisms of metformin absorptive transport to explain the dose-dependent absorption observed in humans. Apical (AP) and basolateral (BL) uptake and efflux as well as AP to BL (absorptive) transport across Caco-2 cell monolayers were evaluated over a range of concentrations. Transport was concentration-dependent and consisted of saturable and nonsaturable components (Km ∼ 0.05 mM, Jmax ∼ 1.0 pmol min-1 cm-2, and Kd, transport ∼ 10 nl min-1 cm-2). AP uptake data also revealed the presence of saturable and nonsaturable components (Km ∼ 0.9 mM, Vmax ∼ 330 pmol min-1 mg of protein-1, and Kd, uptake ∼ 0.04 μl min-1 mg of protein-1). BL efflux was rate-limiting to transcellular transport of metformin; AP efflux was 7-fold greater than BL efflux and was not inhibited by N-(4-[2-(1,2,3,4-tetrahydro-6,7-dimethoxy-2-isoquinolinyl)ethyl]-phenyl)-9,10-dihydro-5-methoxy-9-oxo-4-acridine carboxamide (GW918), a P-glycoprotein inhibitor. AP efflux was trans-stimulated by metformin and prototypical substrates of organic cation transporters, suggesting that a cation-specific bidirectional transport mechanism mediated the AP efflux of metformin. BL efflux of intracellular metformin was much less efficient in comparison with the overall transport, with BL efflux clearance accounting for ∼7 and ∼13% of the overall transport clearance at 0.05 and 10 mM metformin concentrations, respectively. Kinetic modeling of cellular accumulation and transport processes supports the finding that transport occurs almost exclusively via the paracellular route (∼90%) and that the paracellular transport is saturable. This report provides strong evidence for a saturable mechanism in the paracellular space and provides insight into possible mechanisms for the dose dependence of metformin absorption in vivo.
Metformin is an oral antihyperglycemic agent that has been widely used in the management of non-insulin-dependent diabetes mellitus. The oral bioavailability of metformin ranges between 40 and 60%; it is primarily excreted unchanged in the urine, with negligible metabolism (Tucker et al., 1981; Scheen, 1996); ∼20 to 30% of the dose is recovered in the feces unchanged (Tucker et al., 1981; Vidon et al., 1988). The oral absorption of metformin is high considering its hydrophilic nature (e.g., calculated log D of -6.13 at pH 7) (Saitoh et al., 2004) and net positive charge at intestinal pH values (pKa 13.8) (Fig. 1). It is believed to be predominantly absorbed in the upper part of the intestine, and estimated time for its complete absorption is approximately 6 h (Tucker et al., 1981; Scheen, 1996). The elimination half-life after oral administration of metformin is more likely a reflection of the rate of absorption than true elimination of the drug (Tucker et al., 1981). In other words, metformin exhibits flip-flop kinetics, where the slow absorption of metformin is the rate-limiting factor in its disposition.
Clinical trials with metformin have demonstrated decreased bioavailability at higher doses, suggesting saturable intestinal absorption (Noel, 1979; Tucker et al., 1981; Sambol et al., 1996; Scheen, 1996). When metformin was coadministered orally with the histamine H2-receptor antagonist cimetidine, metformin plasma concentrations were increased and renal tubular secretion was decreased, implying a role of the organic cation transporters in metformin elimination (Somogyi et al., 1987). However, in the same study, a significant change in metformin absorption due to cimetidine coadministration was not observed, as determined by total urinary recovery of metformin, suggesting no interactions associated with their intestinal absorption. Recent work with single-pass intestinal perfusion in rats with metformin showed that permeability in the duodenum was concentration-dependent, suggesting the involvement of a carrier-mediated saturable mechanism (Song et al., 2006). Conversely, other researchers concluded that there was a dose-independent linear absorption of metformin in rats (Choi et al., 2006), although the doses used in this study were high (50–200 mg/kg), thus potentially saturating any carrier-mediated absorption over the dose range examined. It is clear that the mechanisms responsible for the dose-dependent absorption of metformin in humans need to be better understood.
Metformin is a substrate for organic cation transporters (OCTs) in both the kidney (OCT2) (Kimura et al., 2005a,b; Terada et al., 2006) and the liver (OCT1) (Wang et al., 2002; Kimura et al., 2005a). Oct1 also was implicated in the intestinal secretion of metformin after i.v. administration in mice (Wang et al., 2002). Detectable message levels for hOCT1, hOCT2, hOCT3, hOCTN1, and hOCTN2 have been found in human intestinal tissue (Ming et al., 2005; Müller et al., 2005; Englund et al., 2006; Seithel et al., 2006). In addition, metformin has been identified as a substrate for the multidrug and toxin extrusion (MATE) antiporters, MATE1 and MATE2-K (Masuda et al., 2006; Terada et al., 2006, 2007). Although MATE2-K, a kidney specific isoform, is believed to be involved in metformin elimination (Masuda et al., 2006), the role of MATE antiporters in metformin absorption is unknown. Metformin is also a substrate for the newly identified proton-coupled transporter, the plasma-membrane monoamine transporter (PMAT), that has been localized on the apical membrane of human epithelial cells and may facilitate metformin absorption (Zhou et al., 2007).

Structure of metformin.
The present study was undertaken to elucidate the transport mechanisms involved in the intestinal absorption of metformin. The approach used was similar to the one used to elucidate the absorptive mechanism of another hydrophilic cation, ranitidine (Bourdet et al., 2006). The current studies reveal a complex transport mechanism that involves the interaction of metformin with AP uptake and efflux transporters and also a saturable paracellular transport mechanism. The postulated mechanism(s) of metformin transport helps to explain the saturable, dose-dependent oral absorption of metformin observed in humans.
Materials and Methods
Materials. The Caco-2 cell line was obtained from the American Type Culture Collection (Manassas, VA). Eagle's minimum essential medium with Earle's salts and l-glutamate, nonessential amino acids (100×), penicillin-streptomycin-amphotericin B solution (100×), fetal bovine serum, and HEPES (1 M) were obtained from Invitrogen (Carlsbad, CA). Hanks' balanced salt solution with calcium and magnesium was purchased from Mediatech Inc. (Hendon, VA). Metformin, quinidine, 1-methyl-4-phenyl pyridinium (MPP), tetraethylammonium bromide (TEA), Triton X-100, and d-(+) glucose were purchased from Sigma-Aldrich (St. Louis, MO). N-(4-[2-(1,2,3,4-tetrahydro-6,7-dimethoxy-2-isoquinolinyl)ethyl]-phenyl)-9,10-dihydro-5-methoxy-9-oxo-4-acridine carboxamide (GW918) was a gift from GlaxoSmithKline (Research Triangle Park, NC). [14C]Metformin (54 μCi/μmol) and [14C]mannitol (53 μCi/μmol) were purchased from Moravek Biochemicals and Radiochemicals (Brea, CA) and were determined to be ≥96% pure by the manufacturer.
Cell Culture. Caco-2 cells were cultured at 37°C in Eagle's minimum essential medium with 10% fetal bovine serum, 1% nonessential amino acids, and 100 U/ml penicillin, 100 μg/ml streptomycin, and 0.25 μg/ml amphotericin B in an atmosphere of 5% CO2 and 90% relative humidity. The cells were passaged after 90% confluence using trypsin-EDTA and plated at a 1:5 ratio in 75-cm2 T flasks. The cells (passage numbers 25–40) were seeded at a density of 60,000 cells/cm2 on polycarbonate membranes of Transwells (12 mm i.d., 0.4 μm pore size, 1 cm2; Costar, Cambridge, MA). Medium was changed the day after seeding and every other day thereafter (AP volume 0.4 ml and BL volume 1.5 ml). The Caco-2 cell monolayers were used 21 to 28 days after seeding. Transepithelial electrical resistance (TEER) was measured to ensure monolayer integrity. Measurements were obtained using an EVOM Epithelial Tissue Voltohmmeter and an Endohm-12 electrode (World Precision Instruments, Sarasota, FL). Cell monolayers with TEER values greater than 300 Ω·cm2 were used in transport experiments.
Transport Studies. Transport studies involved only AP to BL (absorptive) direction and were conducted as described previously with minor deviations (Bourdet and Thakker, 2006). Cell monolayers were preincubated with transport buffer solution (Hanks' balanced salt solution with 25 mM d-glucose and 10 mM HEPES, pH 7.2) for 30 min at 37°C. To study absorptive transport, the donor (AP) compartment buffer was replaced with 0.4 ml of transport buffer containing various concentrations of [14C]metformin with or without 0.2 mM quinidine. The pH in both AP and BL compartments was maintained at 7.2 for all transport studies. Appearance of metformin in the receiver (BL) compartment was monitored as a function of time in the linear region of transport and under sink conditions. For experiments examining the role of cation selective transport, cell monolayers were preincubated in the absence or presence of quinidine (0.2 mM) in the AP compartment for 30 min prior to initiating the transport study. At the conclusion of the experiment, cellular accumulation was determined after washing with 4°C transport buffer three times in each compartment. After this, the cell monolayers were allowed to dry, excised from the insert, and placed in 300 μl of 1% Triton X-100 for 3 h, while shaking. The solution was then centrifuged at 10,000 rpm for 10 min and the supernatant was analyzed. [14C]Metformin in the receiver compartment and in the cellular compartment was measured using liquid scintillation counting (1600 TR Liquid Scintillation Analyzer; PerkinElmer Life and Analytical Sciences, Downers Grove, IL). Protein content was determined by the BCA protein assay (Pierce Chemical, Rockford, IL) with bovine serum albumin as a standard. TEER was measured before and after transport experiments to ensure monolayer integrity throughout the experiment and to monitor the effects of metformin and other compounds on the monolayer integrity. Cell monolayers with TEER ≤300 Ω·cm2 were discarded. Effect of metformin on the cell monolayers was also assessed by measuring [14C]mannitol transport in the presence and absence of varying concentrations of unlabeled metformin in the AP donor compartment.
Uptake Kinetics. All uptake studies were conducted using methods previously reported with minor deviations (Bourdet and Thakker, 2006). Caco-2 cell monolayers were preincubated for 30 min in transport buffer. Experiments were initiated by replacing the donor compartment buffer (0.4 ml for AP and 1.5 ml for BL) with transport buffer containing various concentrations of [14C]metformin. AP and BL uptake was determined over 5 and 30 min (the linear uptake region), respectively. The pH in both AP and BL compartments was 7.2 for all uptake experiments. Cell monolayers were washed three times with 4°C transport buffer, and metformin cellular accumulation and protein content were measured as described under Transport Studies.
Efflux Studies. Cell monolayers were preincubated in transport buffer at 37°C for 30 min, after which they were preloaded from the AP side for 60 min with 0.5 mM [14C]metformin. The cells were then washed three times with 4°C transport buffer and placed in contact with the 37°C transport buffer in the AP and BL compartments, and the amount of metformin appearing in each compartment was determined at the indicated time points. To assess the effects of P-glycoprotein (P-gp), transport buffer with GW918 (1 μM), a potent P-gp and breast cancer resistance protein inhibitor, was added to each compartment during the preloading and efflux experiments. To evaluate trans-stimulation/inhibition by other cationic compounds, transport buffer containing metformin (5 mM), MPP (0.05 mM), TEA (10 mM), or quinidine (0.2 mM) was added to the AP or BL compartment before the measurement of efflux. All efflux experiments were conducted in buffer at pH 7.2. The appearance of [14C]metformin in the AP and BL compartments was monitored as a function of time, and efflux clearance was determined in the linear range of efflux. For all efflux studies, cellular accumulation after preloading for 60 min was determined at the commencement of each experiment to serve as the starting intracellular concentrations (Co) of metformin for efflux rate constant and clearance calculations.
Data Analysis. Transport of metformin is expressed in terms of apparent permeability (Papp) and is described by the following equation:  where dX/dt is the mass of metformin (X) transported over time (t), A is the surface area of the Transwell porous membrane insert, and Co is the initial concentration in the donor compartment. Similarly, transport can be expressed as flux and is described by the following equation:
  Kinetic constants (Jmax, Km, and Kd, transport) were obtained for transport data by fitting a model incorporating one saturable and one nonsaturable component to metformin transport using the following equation (eq. 3A):
  where C is the metformin concentration, Jmax is the maximal flux, Km is the Michaelis-Menten constant, and Kd, transport is the nonsaturable component of transport.
Uptake data were fit to a model describing one saturable and one nonsaturable component (eq. 3B):  where C is the metformin concentration, Vmax is the maximal velocity, Km is the Michaelis-Menten constant, and Kd, uptake is the nonsaturable component of uptake. The Km for uptake rate is distinct from the Km for transport.
Clearance (CL) values for efflux across both membrane barriers (e.g., AP and BL) and transport of metformin form the AP to BL compartment were calculated using eq. 4:  where dX/dt represents the mass of metformin (X) effluxed or transported over time (t) in the linear region of efflux and transport and Co is the estimated initial intracellular concentration or donor concentration of metformin during efflux and transport experiments, respectively. In all instances, clearance values were calculated from experiments with 1-cm2 Transwell surface area. Initial intracellular concentrations were calculated using the amount loaded after initial preloading into the Caco-2 cells and cellular volume of 3.66 μlmg of protein-1 (Blais et al., 1987; Dantzig and Bergin, 1990) or 0.732 μl for the 1-cm2 Transwell insert with average protein content of 0.2 mg. Trans-stimulation/inhibition values were reported as a percentage of control values of their efflux clearance in the linear range of efflux at 15 min.
Mathematical Model. A compartmental modeling approach was implemented to examine the accumulation and transport of metformin in Caco-2 cells as described previously (Bourdet et al., 2006). The three-compartment model can be seen in Fig. 2. Differential equations describing the transfer of mass between compartments of the model in Fig. 2 are 

 where X1, X2, and X3 represent the mass of drug in the AP, cellular, and BL compartments, respectively. First-order rate constants (minutes-1) signify parameters associated with AP uptake (k12), AP efflux (k21), BL uptake (k32), BL efflux (k23), and paracellular transport (k13). Reverse paracellular flux (k31) was omitted from the model because of the large AP to BL concentration gradient and the assumptions of sink conditions. Parameter estimates were obtained by simultaneously modeling cellular accumulation and transport of metformin using nonlinear least-squares regression (WinNonlin; Pharsight, Mountain View, CA). A weighting scheme of 1/Y and the Gauss-Newton minimization method were used for each modeling exercise. Parameter estimates for BL efflux (k23) and BL uptake (k32) were fixed during modeling using experimentally derived values to allow for more accurate estimation of the remaining parameters. BL efflux (k23) was calculated from the following equation:
  where X is the mass of metformin effluxed into the BL compartment as a function of time (t) and X0 is the initial mass after preloading of the cells. AP and BL uptake rate constants were calculated using the equation for uptake rate in terms of the experimentally derived kinetic parameters reported previously (Bourdet et al., 2006). The rate constants (k12 and k32) were calculated by using the kinetic parameters (Vmax, Km, and Kd, uptake) associated with AP and BL uptake. The initial rate of uptake into the cellular compartment (e.g., X2) is described by the following equation:
  where dX2/dtinitial is the initial rate of uptake of metformin mass (X) into the cell. The initial rate of metformin uptake also can be described by a model containing one saturable and one nonsaturable component (eq. 3B). By expressing metformin concentration in terms of mass (X) divided by the donor compartment volume (VAP (or BL)), the initial uptake rate is represented in the following equation as
  where Vmax is the maximal velocity, Km is the Michaelis-Menten constant, Kd, uptake is the nonsaturable component of uptake, and VAP (or BL) is the volume of the donor compartment. Substitution of eq. 10 into eq. 9 enables calculation of the rate constant from the experimentally determined kinetic parameters as follows:
  where Vmax values and Kd values were multiplied by the average protein content of the monolayers (0.20 mg of protein on a 1-cm2 Transwell insert) to remove the dependence of protein content from the uptake rate constants. All data are expressed as mean ± S.D. from three measurements. Statistical significance was evaluated using unpaired t tests. Validation of the model and goodness of fit were assessed by the percent coefficient of variance values for each parameter estimate, parameter sensitivity, and correlation matrices.

Schematic representation of the three-compartment model describing the transport of metformin across Caco-2 cell monolayers. Compartments represent the AP (X1), cellular (X2), and BL (X3) chambers. Rate constants associated with transmembrane movement of drug are denoted as follows: AP uptake (k12), AP efflux (k21), BL uptake (k32), and BL efflux (k23). The rate constant (k13) is associated with metformin transport in the paracellular space. Reverse paracellular flux (k31) was omitted from the model and is assumed to be negligible under sink conditions.

Concentration-dependent transport, apparent permeability, and AP uptake of metformin in Caco-2 cells. The Papp of metformin (•) as a function of donor concentration is shown in A (left axis). The concentration dependence of the transport (AP to BL) (A) and the AP uptake (B) of metformin in Caco-2 cells are shown with the fitted lines for the transport/uptake data (——), the saturable (–––), and nonsaturable (·····) components, respectively. Appearance of metformin (▴) in the BL compartment (A) and uptake into the cell (B) were monitored in the linear time range for transport and AP uptake at 60 and 5 min, respectively. The time course for AP uptake (0.5 mM donor concentration) can be seen in Fig. 3B (inset). Data represent mean ± S.D.; n = 3.
Simulation of Transcellular and Paracellular Transport. The transcellular and paracellular contributions to transport of metformin were determined by implementing parameter estimates from the modeling exercises and simulating the appearance of metformin in the receiver (BL) compartment using subsets of the differential equations (eqs. 5, 6, 7) containing rate constants that describe solely transcellular and paracellular transport. The equations for the simulations were as follows:
Paracellular: 

Transcellular: 


Results
Absorptive Transport and Apical Cellular Uptake of Metformin as a Function of Concentration in Caco-2 Cell Monolayers. The absorptive transport across Caco-2 monolayers of metformin and its AP uptake as a function of concentration are shown in Fig. 3. For clarity, absorptive transport (subsequently referred to as “transport”) refers to movement of drug from the AP compartment across the cell monolayer and into the BL compartment. Uptake and efflux will refer to movement of drug across only one membrane barrier (AP or BL). Metformin transport was linear up to 90 min with less than 1% of metformin transported at all concentrations. The Papp decreased from 4.7 ± 0.2 nm s-1 at 10 μM to 2.1 ± 0.3 nm s-1 at 5 mM, providing evidence for saturable transport of metformin across Caco-2 monolayers (Fig. 3A, left axis). The transport, in terms of flux (J), was modeled as a function of metformin donor concentration (Fig. 3A, right axis). The transport versus concentration data were best fit to a model containing one saturable and one nonsaturable component (refer to eq. 3A under Materials and Methods). This model was previously fit to describe the transport of hydrophilic cations, ranitidine and famotidine (Lee and Thakker, 1999). The Jmax and apparent Km estimated for the transport were 1.02 ± 0.46 pmol min-1 cm-2 and 0.06 ± 0.03 mM, respectively. The nonsaturable transport coefficient, Kd, transport, was 13.4 ± 0.77 nl min-1 cm-2. Comparison of the Kd, transport value to the saturable component of transport (Jmax/Km: 18.5 nl min-1 cm-2) suggests that ∼60% of the overall metformin absorptive transport at low concentrations (<<Km) occurs via a saturable process.
Metformin (0.5 mM) AP uptake was rapid but failed to reach steady state by 45 min (inset of Fig. 3B). The initial AP uptake rate (determined over 5 min, the linear region of AP uptake) of metformin as a function of concentration was described by a model with one saturable and one nonsaturable component (Fig. 3B). The Vmax and apparent Km estimated for AP metformin uptake were 331 ± 68 pmol min-1 mg of protein-1 and 0.9 ± 0.2 mM, respectively (Table 1). The nonsaturable component of AP uptake, Kd, uptake, was estimated to be 0.036 ± 0.011 μl min-1 mg of protein-1. Comparison of the Kd, uptake value to the saturable component of uptake (Vmax/Km: 0.40 μl min-1 mg of protein-1) suggests that ∼90% of the overall metformin uptake at low concentrations (<<Km) is via a saturable process (Table 1). The data are consistent with a saturable, carrier-mediated AP uptake process for metformin in Caco-2 cells.
Estimated kinetic parameter for AP uptake, BL uptake, and absorptive (AP to BL) transport of metformin in Caco-2 cells
Metformin BL uptake into Caco-2 cells was significantly lower than AP uptake and was linear up to 30 min (data not shown). BL uptake kinetic parameters (Vmax and Km) were obtained from the concentration dependence of BL uptake in the linear range of BL uptake (30 min) from 0.01 to 5 mM dosing concentrations (Table 1). BL uptake data did not support the incorporation of a term for nonsaturable uptake (Kd, uptake), as was observed previously for ranitidine BL uptake (Bourdet and Thakker, 2006). It should be noted, however, that the BL uptake studies never fully reach Vmax; therefore, model predictions of Km may underestimate the true apparent Km for BL uptake. We acknowledge this potential deficiency, but because of the significantly high Km estimate (∼12 mM), this parameter will play little role in the disposition of metformin at concentrations achieved in the BL compartment in the Caco-2 cell system or at physiological concentrations achieved in the blood. Therefore, the kinetic estimates were adequate for calculation of BL uptake rate constant (k32) (refer to eq. 11 under Materials and Methods).
AP and BL Efflux of Metformin from Preloaded Cell Monolayers. A comparison of the AP uptake to transport suggests that the saturable AP uptake clearance is far more efficient than the saturable transport clearance of metformin (Table 1), suggesting that BL efflux out of the cell may limit transcellular transport. To investigate the rate of efflux from the cell, appearance of metformin in the AP and BL compartments from cells preloaded with 0.5 mM [14C]metformin was monitored as a function of time over the linear region (up to 90 min) of efflux (Fig. 4A). Metformin exhibited 7-fold higher AP efflux clearance than the BL efflux clearance, suggesting that the efflux across the AP membrane is assisted by an efflux transporter and that BL efflux is inefficient. The polarity between AP and BL efflux clearance values indicates that the BL membrane is rate limiting to transcellular transport. The AP efflux was not inhibited by 1 μM GW918, a P-gp inhibitor (Hyafil et al., 1993) (Fig. 4B), thus ruling out the role of P-gp in the AP efflux of metformin; however, AP efflux was significantly inhibited by quinidine (p < 0.001). This result supports previous reports that metformin is not a substrate for P-gp (Song et al., 2006).
Trans-stimulation experiments have been conducted previously to determine whether there is a bidirectional carrier-mediated efflux mechanism for other small molecules (Villalobos and Braun, 1998; Mizuuchi et al., 1999; Zhang et al., 1999; Bourdet and Thakker, 2006). Therefore, trans-stimulation of metformin efflux by unlabeled metformin and prototypical OCT substrates/inhibitors was examined by measuring the efflux after preloading (0.5 mM [14C]metformin) the Caco-2 cell monolayers (Fig. 4B). AP efflux was trans-stimulated by unlabeled metformin (5 mM), MPP (0.05 mM), and TEA (10 mM). The presence of quinidine in the AP compartment significantly reduced the AP efflux clearance of [14C]metformin from 10.2 ± 0.4 nl min-1 (control) to 1.7 ± 0.3 nl min-1 (+0.2 mM quinidine), abolishing the polarity between AP and BL efflux of metformin (data not shown). In addition, the presence of quinidine trapped 72.3 ± 0.8% of the initial intracellular metformin in the cell after the 90-min efflux experiment, compared with control (no quinidine) for which 19.9 ± 2.1% remained (data not shown). The stimulation of [14C]metformin AP efflux by unlabeled metformin and prototypical OCT substrates, TEA and MPP, supports the presence of a cation-selective bidirectional transporter in the AP membrane that facilitates metformin uptake and secretion from the cell. BL efflux was not capable of trans-stimulation/inhibition by unlabeled metformin, MPP, TEA, or quinidine (Fig. 4C).
Inefficient Basolateral Efflux Limits Transcellular Transport of Metformin across Caco-2 Cell Monolayers. Transcellular transport of hydrophilic cations such as metformin requires vectoral transport, comprising both AP uptake and BL efflux from the cell. In Caco-2 cells, AP uptake of metformin is highly efficient (Table 1), whereas BL efflux appears to be rate limiting to transcellular transport. Therefore, the rate of BL efflux can serve as a surrogate rate of transcellular transport and as an estimate of the relative contribution of this pathway to the overall transport of metformin. Transport (flux) increased from 1.2 ± 0.03 to 126 ± 19 pmol min-1 cm-2 (∼100-fold) as the donor concentration increased from 0.05 to 10 mM (200-fold) (Fig. 5A). The BL efflux rate increased from 0.3 ± 0.03 to 7.85 ± 0.2 pmol min-1 cm-2 (∼26-fold) as the donor concentration increased from 0.05 to 10 mM (Fig. 5A). The ∼26-fold increase in BL efflux rate correlated with the estimated intracellular metformin concentration (Co), which increased from 0.19 ± 0.02 to 4.93 ± 0.19 mM (∼26-fold increase) as the loading concentration increased from 0.05 to 10 mM (inset of Fig. 5B). The BL efflux rates for 0.05 and 10 mM loading concentrations could only account for ∼25 and ∼6% of the overall transport, respectively (Fig. 5A). This result leads to the conclusion that metformin transport must occur predominantly via the paracellular route.
Transport (flux) and BL efflux rates depend on the donor concentration or the initial intracellular concentrations, respectively. Transport and BL efflux clearance values (1-cm2 Transwell insert), which normalize the rates with respect to concentrations, were determined after an 0.05 or 10 mM AP dose or loading dose, respectively (Fig. 5B). Transport clearance significantly decreased from 24 ± 1 nl to 13 ± 2 nl min-1 with 0.05 to 10 mM donor concentrations, respectively. This ∼50% reduction in transport clearance from low to high concentration was indicative of saturable transport processes. The BL efflux clearance values for 0.05 and 10 mM were not significantly different (Fig. 5B), although the initial loading concentration (Co) increased ∼26-fold (inset of Fig. 5B). The BL efflux clearance could only account for ∼7 and ∼13% of the overall transport clearance at 0.05 and 10 mM metformin concentrations, respectively. These data suggest that transcellular transport can account for ∼10% of the overall transport of metformin across Caco-2 cell monolayers.
Relationship between Absorptive Transport and Cellular Accumulation of Metformin. The transport and cellular accumulations of metformin from the AP compartment (0.05 mM) as a function of time were evaluated simultaneously in Caco-2 cells in the absence or presence of the cation-selective inhibitor, quinidine (0.2 mM) (Fig. 6, A and D, respectively). Cellular accumulation describes the mass of drug accumulated in the cell at a fixed period of time. This value takes into account multiple processes, e.g., uptake and efflux, at both the AP and BL membranes. The cellular accumulation of metformin exceeded the transport throughout the experiment (Fig. 6A), confirming that the uptake into the cell was not the rate-limiting step for transport of metformin. In the presence of quinidine, the cellular accumulation and transport decreased significantly compared with control, and the cellular accumulation failed to exceed the amount of metformin transported (Fig. 6D).
Kinetic modeling of the transport and cellular accumulation data was performed using the model outlined in Fig. 2 with fixed experimentally derived parameters (k23 and k32), representing BL efflux rate constant and BL uptake rate constant, respectively. The BL efflux rate constant (k23) was fixed because BL efflux was linear over the 90 min (Fig. 4A) and the clearance remained unchanged irrespective of cellular concentrations (Fig. 5B). The BL uptake rate constant (k32) was calculated from Vmax and Km parameters derived experimentally (Table 1), although this rate constant should play a negligible role in metformin disposition because of the low concentrations of metformin in the BL compartment, e.g., <1% dose transported after 90 min. When model goodness of fit was assessed, the estimate for the AP uptake rate constant (k12) was highly correlated with the AP efflux rate constant (k21). The correlation of these parameter estimates was not unexpected, for these processes work in opposite directions on the same membrane and affect the disposition of the same adjacent compartments. In addition, the estimated AP uptake rate constant (k12 = 0.000156 min-1) was in good agreement with the experimentally derived and calculated rate constant (k12 = 0.000199 min-1) obtained from Vmax, Km, and Kd, uptake values for AP uptake in eq. 11 (see Materials and Methods). The model was highly sensitive to the three iterated parameters (k12, k21, and k13). The paracellular rate constant (k13) did not have any correlation with the other two iterated parameters (k12 or k21).

Efflux of preloaded metformin across the AP and BL membranes of Caco-2 cells. A, time course of metformin efflux into AP (•) and BL (○) compartments; trans-stimulation/inhibition by organic cations of metformin AP efflux (B) and BL efflux (C). The trans-stimulation/inhibition experiment was performed by first preloading 0.5 mM [14C]metformin (refer to Materials and Methods), then replacing the transport buffer in the AP or BL compartment with a buffer containing GW918 (918, 1 μM), metformin (MET, 5 mM), MPP (0.05 mM), TEA (10 mM), or quinidine (QND, 0.2 mM) and monitoring [14C]metformin appearance in the AP or BL compartments for 15 min. Trans-stimulation/inhibition experiments are reported as a relative percentage of the control (CON) value. Data represent mean ± S.D.; n = 3. *, p < 0.05 compared with control; **, p < 0.01 compared with control; ***, p < 0.001 compared with control.
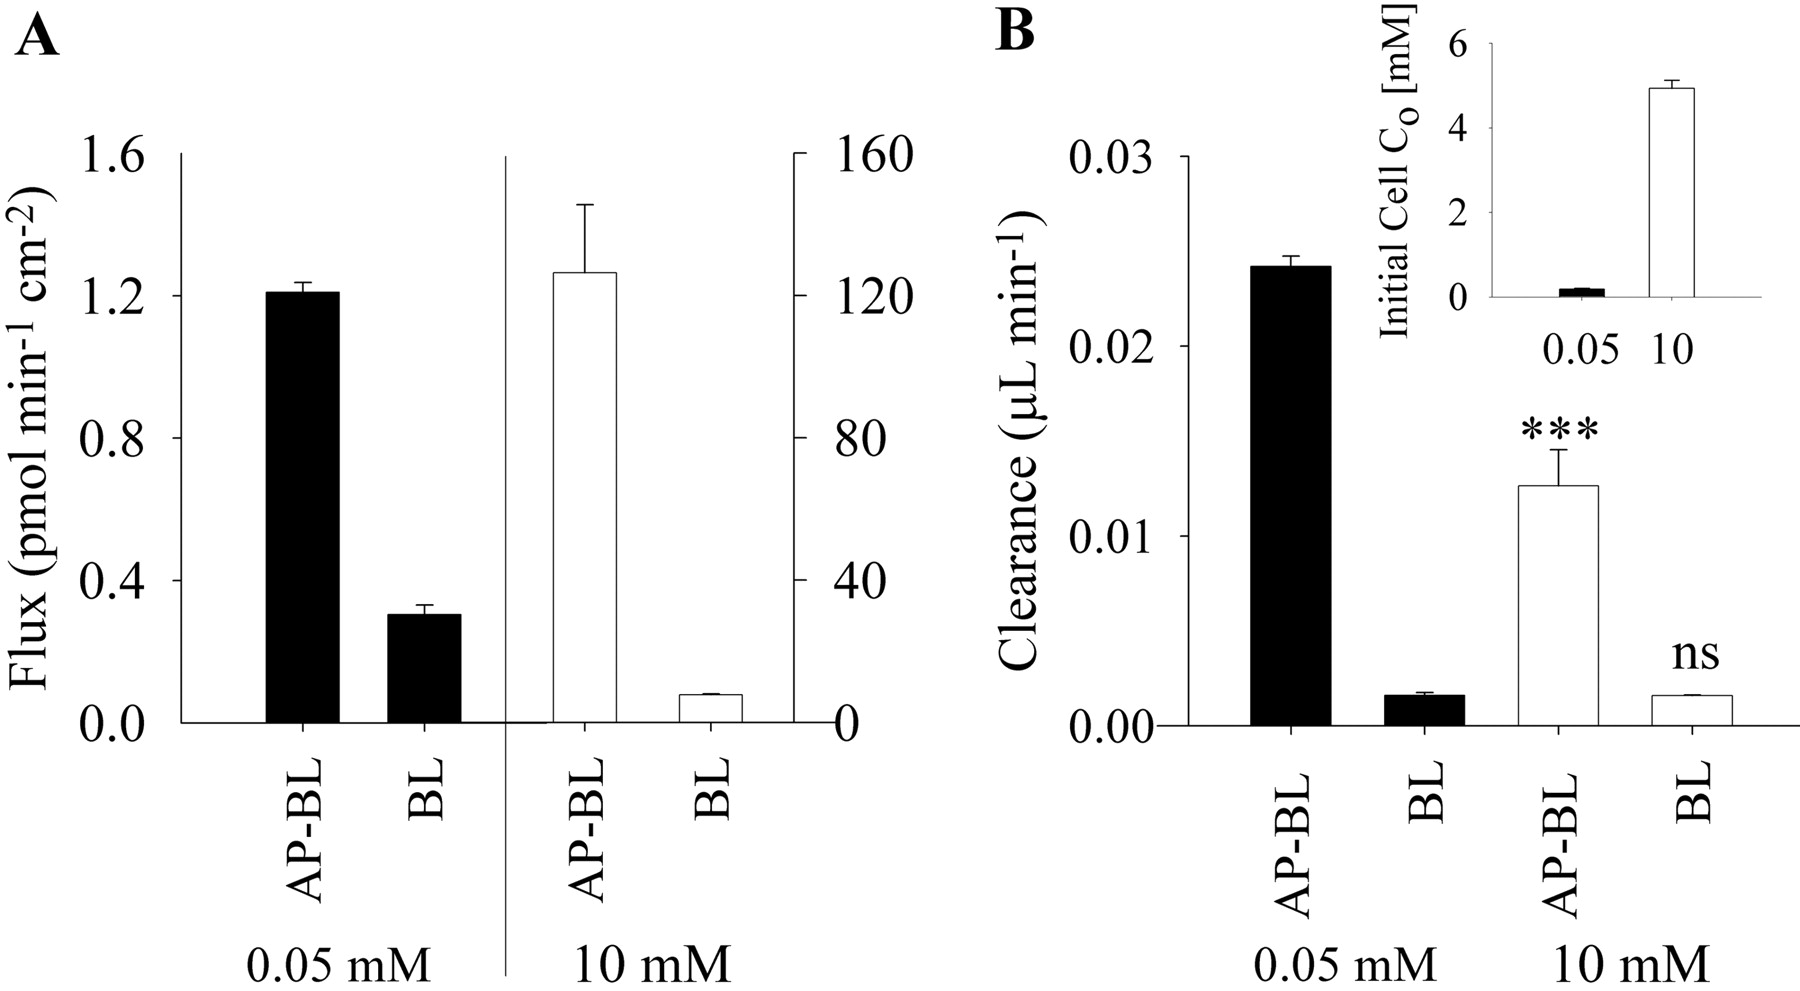
Relative rates and clearance values of transport (AP-BL) and BL efflux of metformin across Caco-2 cell monolayers. A, transport (AP-BL) and BL efflux (BL) rates over 90 min for the initial AP donor concentration (Co) of 0.05 mM (▪, left y-axis) and 10 mM (□, right y-axis) metformin. B, transport clearance and BL efflux clearance values (1-cm2 Transwell inserts) for the initial AP donor concentration (Co) of 0.05 (▪) and 10 mM (□). Inset depicts the estimated initial cellular concentrations (Co) after a 60-min incubation of cells with 0.05 (▪) and 10 mM (□). Data represent mean ± S.D.; n = 3. ***, p < 0.001 for 0.05 mM compared with 10 mM; ns, not significantly different between 0.05 and 10 mM values.

Concentration dependence of metformin transport and cellular accumulation in Caco-2 cells. Metformin appearance in the BL compartment (○) and cellular accumulation (•) were monitored as a function of time at dosing concentrations of 0.05 mM (A), 0.5 mM (B), 10 mM (C), and 0.05 mM in the presence of quinidine (QND, 0.2 mM) (D). Lines indicate the best fit of the kinetic model (Fig. 2) to the BL appearance (·····) and cellular accumulation (——) data. Data represent mean ± S.D.; n = 3.
Parameter estimates were generated from simultaneously modeling the cellular accumulation and transport of metformin (0.05 mM) in the presence or absence of the cation transporter inhibitor, quinidine (0.2 mM) (Table 2). In the presence of quinidine, the rate constant associated with AP uptake (k12) decreased by ∼90%, which was consistent with the inhibition of carrier-mediated uptake process and subsequent decrease in cellular accumulation of metformin (Table 2; Fig. 6D). Inhibition by quinidine caused a 3-fold decrease in Papp, total and a 7-fold decrease in cellular accumulation of metformin (Fig. 6D). The paracellular rate constant (k13) decreased by ∼50% in the presence of quinidine (Table 2). The ability of quinidine to decrease both transcellular and paracellular transport of a hydrophilic cation, ranitidine, has been observed previously (Bourdet et al., 2006).
Effects of donor concentration and inhibition by quinidine on kinetic parameters for metformin transport and cellular accumulation in Caco-2 cells Transport and cellular accumulation data were fit simultaneously using the model equations detailed under Materials and Methods.
Relative Contribution of Transcellular and Paracellular Transport Pathways to Absorptive Transport of Metformin. The relative contributions of transcellular and paracellular transport to the overall transport of metformin (0.05 mM) were estimated to be 9 and 91%, respectively (Table 3); these values were derived based on the parameter estimates obtained from modeling with subsets of the differential equations expressing solely paracellular or transcellular rate constants (eqs. 12, 13, 14, 15, 16) and were consistent with the estimates based on experimental values for transport and BL efflux. Quinidine (0.2 mM) caused a substantial decrease in the permeability (Papp, total), and there was a good correspondence between the experimental and predicted Papp, total values (Table 3). Model predictions showed that the decrease in the permeability was probably due to a decrease in both transcellular permeability (Papp, trans) and paracellular permeability (Papp, para). In the presence of quinidine, the predicted relative contributions of transcellular and paracellular transport were estimated to be 3 and 97%, respectively (Table 3).
Relative contribution of paracellular and transcellular transport to overall transport of metformin as a function of donor concentration in Caco-2 cells
The relative contribution of transcellular and paracellular transport was estimated at three widely separated metformin concentrations: 0.05 mM (near the apparent Km for absorptive transport and below the apparent Km for AP uptake), 0.5 mM (above the apparent Km for absorptive transport and near the apparent Km for AP uptake), and 10 mM (above the apparent Km for both transport and AP uptake). The Papp, total values for metformin at 0.05, 0.5, and 10 mM were 5.0 ± 0.57, 3.9 ± 0.56, and 1.4 ± 0.24 nm s-1, respectively (Table 3), showing a decrease with concentration. Cellular accumulation of metformin did not reach steady state by 90 min at either the 0.05 and 0.5 mM concentrations, whereas at the 10 mM metformin concentration a steady-state concentration in the cell appeared to be achieved at ∼90 min (Fig. 6C).
Kinetic modeling yielded parameter estimates that described the transport and accumulation data (Table 2). The model fits to the experimental data are presented in Fig. 6, A to C. The model-predicted Papp, total was in good agreement with the experimental Papp, total (Table 3). The estimated AP uptake rate constant (k12) significantly decreased with the increase in metformin donor concentration, which is consistent with a saturable AP uptake mechanism (Table 2). The rate constant estimates for paracellular transport (k13) decreased with increasing metformin donor concentrations (Table 2). For all three concentrations, the majority (∼90–95%) of the metformin transport was estimated to be via the paracellular route, with only ∼5 to 10% of the transport occurring through the transcellular mechanism (Table 3). Both the predicted Papp, trans and predicted Papp, para decreased significantly with increasing metformin concentration (Table 3). The predicted Papp, para decreased from 4.5 to nm s-1 1.3 as concentration increased from 0.05 and 10 mM, an approximately 70% decrease. The permeability of the paracellular marker [14C]mannitol did not change significantly from control (Papp of 5.8 ± 0.7 nm s-1) in the presence of 0.05, 0.5, and 10 mM metformin or in the presence of quinidine (Table 3).
Discussion
The transport and AP uptake of metformin in Caco-2 cell monolayers contain saturable components (Fig. 3, A and B). To our knowledge, this is the first report of dose-dependent transport of metformin in a cell-based in vitro system. The saturable component did not appear to play a dominant role in the transport of metformin, particularly at high concentrations (Fig. 3A, right axis), yet there is clear evidence for saturable transport of metformin in the plot of Papp as a function of concentration (Fig. 3A, left axis). When compared with the low-affinity/high-capacity AP uptake (apparent Km ∼ 0.8 mM and Vmax ∼330 pmol min-1 mg of protein-1), the saturable component of transport exhibited distinctly different kinetic behavior (apparent Km ∼ 0.05 mM and derived Vmax ∼ 5 pmol min-1 mg protein-1, see footnote to Table 1) and was only 25% as efficient as the apical uptake [(Vmax/KmAP to BL transport of ∼0.1 μl min-1 mg of protein-1 versus (Vmax/Km)AP of ∼0.4 μl min-1 mg of protein-1] (Table 1). This discrepancy between the kinetic parameters for the transport and AP uptake suggests that the dose-dependent transport of metformin was not mediated solely by the AP uptake mechanism and associated transcellular processes.
The AP uptake and cellular accumulation of metformin appeared to reach steady state at 90 min for 10 mM donor concentration (Fig. 6C), but not for 0.05 and 0.5 mM donor concentrations (Fig. 6, A and B). The inability to achieve steady-state over 90 min at 0.05 and 0.5 mM was surprising considering that the hydrophilic cation ranitidine (0.5 mM) achieved steady-state cellular concentrations at ∼15 min (Bourdet and Thakker, 2006). This was probably due to both restricted BL efflux and the presence of an efficient and high-capacity bidirectional transport mechanism on the AP membrane.
Both AP uptake and cellular accumulation of metformin were strongly inhibited by quinidine (Fig. 6D), a potent inhibitor of OCTs (Bourdet et al., 2005; Kimura et al., 2005b), MATE1 (Ohta et al., 2006), and P-gp (Adachi et al., 2001). Furthermore, trans-inhibition by quinidine caused more than a 5-fold reduction in AP efflux, suggesting that the AP uptake and efflux may be OCT-mediated. The AP efflux was subject to trans-stimulation by metformin and prototypical cation transporter substrates, TEA and MPP (Fig. 4B), further supporting the involvement of one or more OCT transporters in AP uptake and efflux. Organic cation transporters on the AP membrane of intestinal epithelium, in particular OCT3, are facilitative transporters that have been shown to transport cations bidirectionally in conjunction with electrochemical gradient or membrane potential (Schneider et al., 2005). Although the exact transporter(s) implicated are not known, these studies provide strong evidence supporting an “OCT-like” bidirectional uptake/efflux transport mechanism on the AP membrane in Caco-2 cells for metformin. To our knowledge, this the first report of metformin AP efflux from an intestinal cell model system.
In comparison with the AP efflux, the BL efflux of metformin was quite inefficient (Fig. 4A) and appeared to occur via passive diffusion as evidenced by little change in the BL efflux clearance over a wide concentration range (Fig. 5B). The inefficient BL efflux appeared to be the rate-limiting step for the transcellular transport of metformin, resulting in its accumulation in the cells over the 90-min transport experiments (Fig. 6, A–C). These results provided an explanation for why transport would be predominantly paracellular although metformin was efficiently taken up into Caco-2 cells.
The results for the transport, uptake, and efflux kinetic experiments revealed that metformin traverses Caco-2 cell monolayers predominantly via a saturable paracellular mechanism. A kinetic modeling approach was used to estimate the relative contributions of trans- and paracellular transport. The modeling provides a more complete evaluation of the processes associated with transport and is able to estimate the relative contributions of paracellular and transcellular transport for drugs under a variety of experimental conditions (e.g., different concentrations and the presence of inhibitors). At 0.05 mM donor concentration, ∼90% of the metformin transport is estimated to occur via the paracellular route, whereas only ∼10% would occur via the transcellular pathway (Table 3). This estimate was in excellent agreement with experimental transport and efflux data, for which ∼7% of the transport could be accounted for by BL efflux for the 0.05 mM metformin donor concentration (Fig. 5B).
The kinetic modeling supports the results suggesting that metformin is transported predominantly via the paracellular route. However, it is difficult to reconcile this value with the experimental observation that the permeability is concentration-dependent (i.e., transport is saturable) in Caco-2 cells (Fig. 3A). The apparent permeability values (Papp, total) of metformin decreased from 5.0 ± 0.57 to 1.4 ± 0.24 nm s-1 when the dose changed from 0.05 to 10 mM. The majority of this change is attributed to a decrease in the paracellular permeability, Papp, para (Table 3). The permeability of mannitol, a prototypical paracellular transport marker, remained unchanged in the presence of varying metformin concentrations (Table 3). Therefore, the decrease in paracellular permeability is probably due to saturable interactions between metformin and a macromolecule, presumably a protein, in the paracellular space of Caco-2 cell monolayers and not to gross changes in the paracellular space or in the tight junctions. It has been postulated that a saturable paracellular mechanism may be due to charge-charge interactions in the paracellular space (Lee and Thakker, 1999; Bourdet et al., 2006). Further studies are required to elucidate the mechanisms of this saturable paracellular transport mechanism. Anionic amino acid residues of the tight junction protein family, claudins, have been shown to confer cationic charge selectivity, i.e., Na+ permeability, to the paracellular pathway (Colegio et al., 2002; Van Itallie et al., 2003). It can be postulated that metformin may saturate these anionic sites in the tight junction, restricting its own transport at high concentrations.
The data presented in this study on metformin provide convincing evidence for a saturable process in the paracellular space acting on a small molecule. The results further show that metformin is taken up into the cells across the AP membrane via a cation-selective transporter. Once inside the cell, it is effluxed poorly across the BL membrane but much more efficiently across the AP membrane, perhaps via an AP transporter that serves as a cation-exchanger. It has been shown that metformin bioavailability in humans was dose-dependent (Noel, 1979; Tucker et al., 1981; Sambol et al., 1996; Scheen, 1996). For transcellular processes to account for the dose-dependent absorption, vectoral transport of metformin must exist, in which both AP and BL transporters are needed to transport the drug from the lumen into the blood. Provided Caco-2 cell monolayers are an appropriate cellular model for intestinal absorption of hydrophilic cationic compounds such as metformin, saturable absorption could not occur via transcellular transport because of inefficient efflux across the BL membrane. Rather, the saturable absorption in vivo could occur via the paracellular route which accounted for ∼90% of the transport of metformin across the Caco-2 cell monolayers. A hypothesis that is an attempt to relate the transport behavior of metformin in the Caco-2 cell culture model of intestinal epithelium to its likely behavior in human subjects (depicted as the “sponge effect” in Fig. 7) upon oral administration can be formulated. It can be speculated that a portion of the metformin dose is sequestered in the enterocytes because of the lack of an efficient BL efflux transporter mechanism. In addition, metformin is prevented from AP efflux because of a higher luminal concentration of the drug that maintains the net flow of drug in the inward direction. Some of the metformin dose is absorbed across the intestinal epithelium via the cation-selective facilitative diffusion in the paracellular space (Fig. 7A). As the dose passes through the intestine, the luminal concentration decreases below the achievable intracellular concentrations of metformin, and AP efflux occurs via the bidirectional “OCT-like” transport mechanism. The effluxed dose of metformin can be absorbed across the paracellular space via the cation-selective saturable mechanism or taken up back into the enterocytes (Fig. 7B). At high doses, (≥850 mg or ≥20 mM luminal concentration) the transport mechanisms are saturated and thus a smaller fraction of administered doses would be absorbed via the saturable mechanism. The data presented in this report provide an explanation for why the fraction absorbed for metformin, one of the most widely prescribed drugs on the market, could fall from ∼0.9 to ∼0.4 as the dose is raised to 2.0 g in humans (Tucker et al., 1981). Further studies to identify the mechanism(s) of the saturable paracellular process will lead to better understanding of how metformin and other small hydrophilic cations traverse and navigate through tight junctions and the effects this process has on their disposition. Conceivably, a saturable paracellular transport mechanism could be contributing to the elimination of metformin and other hydrophilic cations in the kidney and other tight junction-containing organs/tissues.
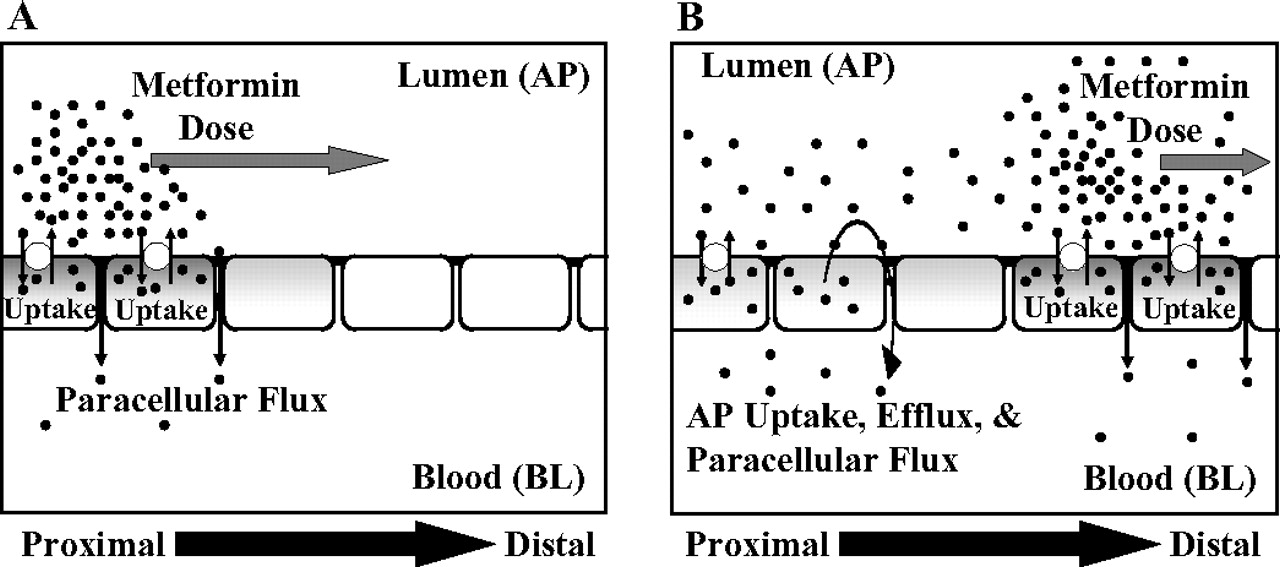
Schematic diagram of the proposed “sponge” hypothesis for dose-dependent absorption of metformin. A, metformin dose travels from the proximal to distal regions of the intestine and undergoes predominantly saturable paracellular transport and also saturable AP uptake into the cells. The BL membrane barrier restricts transcellular transport of metformin, sequestering the drug in the cell. B, as luminal concentration decreases and becomes less than the intracellular concentrations of metformin, AP “OCT”-like bidirectional transporter(s) effluxes metformin into the lumen and allows for transport through the paracellular space or reuptake into the cells.
Footnotes
-
Article, publication date, and citation information can be found at http://dmd.aspetjournals.org.
-
doi:10.1124/dmd.107.020180.
-
ABBREVIATIONS: OCT/Oct, organic cation transporter; h, human; MATE, the multidrug and toxin extrusion antiporters; AP, apical; MPP, 1-methyl-4-phenyl pyridinium; TEA, tetraethylammonium bromide; GW918, N-(4-[2-(1,2,3,4-tetrahydro-6,7-dimethoxy-2-isoquinolinyl)ethyl]-phenyl)-9,10-dihydro-5-methoxy-9-oxo-4-acridine carboxamide; BL, basolateral; TEER, transepithelial electrical resistance; P-gp, P-glycoprotein.
- Received December 17, 2007.
- Accepted April 30, 2008.
- The American Society for Pharmacology and Experimental Therapeutics


