


Abstract
17α-Ethinylestradiol (EE2), a component of oral contraceptives, is known to undergo considerable first-pass 3-O-sulfation in the intestine and liver. Once formed, the 3-O-sulfate conjugate (EE2-Sul) is detected in circulation at appreciable levels (versus parent EE2) and is present in bile. Therefore, hepatic uptake of EE2-Sul was assessed with suspensions of cryopreserved human primary hepatocytes. In this instance, there was evidence for active (temperature-dependent) uptake, which was described by a two-Km (Michaelis constant) model (Km1 = 220 nM; Km2 = 15.5 μM). Uptake was inhibited (∼90%) by bromosulfophthalein but not by tetraethylammonium or p-aminohippurate. In agreement, EE2-Sul was shown to be a substrate of recombinant organic anion transporter peptides (OATP1B1 and OATP2B1), and Na+/taurocholate-cotransporting polypeptide (NTCP), expressed individually in human embryonic kidney (HEK) 293 cells. Transport by OATP1B1 was described by two Km values (87 nM and 141 μM), whereas OATP2B1- and NTCP-mediated uptake into HEK-293 cells conformed to single Km kinetics (10.7 and 2.6 μM, respectively). EE2-Sul was also assessed as an efflux transporter substrate using membrane vesicles expressing bile salt export pump, breast cancer resistance protein (BCRP), and individual forms of multidrug resistance-associated protein (MRP1, MRP2, and MRP3). Transport studies were also conducted with a cell line expression P-glycoprotein. Only vesicles that contained BCRP exhibited ATP-dependent uptake of EE2-Sul (Km1 = 2.9 and Km2 = 307 μM). Collectively, the data show that hepatic uptake of EE2-Sul can be mediated by three transporters (OATP1B1, OATP2B1, and NTCP), whereas biliary excretion of EE2-Sul into bile likely involves BCRP.
17α-Ethinylestradiol (EE2), a synthetic and potent oral estrogen, is widely used in contraceptive formulations. The compound is extensively metabolized and undergoes 3-O-sulfation, oxidation, and 3-O-glucuronidation. EE2 2-hydroxylation, the major oxidative pathway, is catalyzed by CYP3A4 and CYP2C9, whereas 3-O-glucuronidation and 3-O-sulfation are catalyzed by UGT1A1 and low Km SULT1E1, respectively (Orme et al., 1983; Rogers et al., 1987; Guengerich, 1990; Zhang et al., 2007). Also of note is the high first-pass 3-O-sulfation (gut > liver), which likely limits the oral bioavailability of EE2 (20–65%) (Orme et al., 1989). After oral administration of EE2, EE2 and its metabolites are excreted into bile (∼35% of the dose) and can undergo enterohepatic recirculation (Back et al., 1979; Maggs et al., 1983). Because of extensive sulfation, the 3-O-sulfate conjugate of EE2 (EE2-Sul) circulates in human plasma at higher concentrations (>20-fold) than parent EE2 and its 3-O-glucuronide (Akpoviroro and Fotherby, 1980; Back et al., 1980).
In contrast to the drug-metabolizing enzyme phenotyping data described above, relatively little information is available concerning the transporters that govern the disposition of EE2 and its metabolites. More recently, EE2 was shown to diffuse passively into rat primary hepatocytes, with no evidence for saturable or temperature-dependent uptake (Zhang et al., 2007). Unlike EE2, however, the sulfate and glucuronide metabolites of EE2 are more hydrophilic, and their physicochemical properties favor interactions with liver drug transporters. Such transporters might include organic anion transporter (OAT) 2, organic cation transporter (OCT) 1, and organic anion-transporting polypeptide (OATP) forms (OATP1B1, OATP1B3, and OATP2B1), expressed on the basolateral membrane, and ATP-dependent efflux transporters expressed on the canalicular membrane [e.g., multidrug resistance-associated protein (MRP) 2, breast cancer resistance protein (BCRP), P-glycoprotein (P-gp), and bile salt export pump (BSEP)] (Klaassen and Aleksunes, 2010). As described above, EE2 is extensively metabolized to EE2-Sul in the intestine, and efflux transporters could pump out EE2-Sul into the gut lumen. Concomitantly, intestinal uptake transporters (e.g., OATP2B1) may transport luminal EE2-Sul back into enterocytes. This activity implies that any EE2-Sul excreted into bile, that survives sulfatase-catalyzed cleavage, can be subject to enterohepatic recirculation. Therefore, in addition to formation by phase II drug-metabolizing enzymes, uptake and efflux transporters may also serve to control the disposition of EE2 conjugates. Indeed, the transport mechanism of EE2-Glu in the liver has been partially clarified by Chu et al. (2004), and the results suggest that EE2-Glu is a substrate of MRP2, and MRP3, whereas EE2-Sul is not an MRP1, MRP2, and MRP3 substrate. Furthermore, the sulfate conjugates of estrone and dehydroepiandrosterone have been shown to serve as OATP substrates (Cui et al., 2001), and so hepatocyte uptake studies with EE2-Sul were warranted.
The goal of the present study was to conduct transporter phenotyping studies with EE2-Sul. Toward this end, uptake studies were performed with human hepatocytes and a panel of recombinant uptake transporters individually expressed in HEK-293 cells [OATP1B1, OATP1B3, OATP2B1, sodium taurocholate-cotransporting polypeptide (NTCP), and OCT1]. The studies also incorporated membrane vesicles that containing individually expressed efflux transporters (MRP1, MRP2, MRP3, BSEP, and BCRP) in addition to a cell line (MDCK)-expressing P-gp. Assessment of EE2 drug interactions is commonplace within the industry. In fact, most new chemical entities are evaluated as inducers and/or inhibitors of EE2 metabolism, and the information appears in package inserts (Zhang et al., 2007). As described above, EE2 is known to undergo extensive first-pass sulfation and the EE2-Sul circulates. If changes in parent EE2 are observed, one option is to assay for EE2-Sul in plasma and assess the likelihood of SULT inhibition (or induction) (Schwartz et al., 2009). Based on the results described herein, however, numerous transporters likely govern the disposition of EE2-Sul, and a new chemical entity could serve as an inhibitor (or inducer) of one or more of the transporters described. Consequently, the results of any clinical EE2 drug interaction study would have to be interpreted carefully and integrated with the appropriate in vitro data. The EE2-Sul transporter phenotype information described herein will serve to further guide the conduct of such supportive in vitro studies.
Materials and Methods
Materials.
[3H]EE2 (60 Ci/mmol) and [3H]methotrexate (0.73 TBq/mmol) were purchased from American Radiolabeled Chemicals Inc. (St. Louis, MO). [3H]Estrone-3-sulfate ammonium salt (2.12 TBq/mmol), [3H]estradiol-17β-d-glucuronide (1.73 TBq/mmol), [3H]taurocholate (185 GBq/mmol), [3H]MPP (3.16 TBq/mmol), and [3H]digoxin (806 GBq/mmol) were purchased from PerkinElmer Life and Analytical Sciences (Waltham, MA). [3H]CCK-8 (92 Ci/mmol) was purchased from GE Healthcare (Little Chalfont, Buckinghamshire, UK). Unlabeled EE2-Sul was obtained from Steraloids (Newport, RI). Unlabeled estradiol-17β-d-glucuronide, estrone-3-sulfate, and CCK-8 were purchased from Sigma-Aldrich (St. Louis, MO). Human liver cytosol was purchased from BD Biosciences (Palo Alto, CA). Membrane vesicles prepared from Sf9 cells expressing human BSEP, MRP2, and BCRP were purchased from Genomembrane, Inc. (Yokohama, Japan). MRP1 and MRP3 membrane vesicles prepared from Sf9 cells were purchased from BD Biosciences (Woburn, MA). All other reagents were commercial products of reagent grade. Human OATP1B1 antibody was kindly provided by Professor Richard Kim (University of Western Ontario, London, Canada). Anti-OATP2B1 and anti-OATP1B3 sera raised in rabbits were gifts from Professor Yuichi Sugiyama (University of Tokyo, Tokyo, Japan). MDCK cells, which were transfected with human MDR1 gene (MDCK-MDR1), were obtained from the Netherlands Cancer Institute (Amsterdam, The Netherlands).
Synthesis of [3H]EE2-Sul.
Preparation of [3H]EE2-Sul from [3H]EE2 was based on existing literature information (Li et al., 1999; Schrag et al., 2004). [3H]EE2 (250 μCi) was transferred in ethanol into a test tube with a screw cap. The sample was gently evaporated under a stream of nitrogen to near dryness. A stir bar was added to the test tube followed by addition of 0.4 mg of PAPS [in 0.2 ml of phosphate buffer (0.1 M), pH 7.0], 100 μl (2 mg) of pooled human liver cytosol (BD Biosciences), and 0.7 ml of phosphate buffer (0.1 M), pH 7.0. The reaction was started at 37°C, and its progress was monitored by radio-high-performance liquid chromatography (HPLC). A second batch of PAPS [2 mg in 0.5 ml of phosphate buffer (0.1 M), pH 7.0] was added to the reaction mixture after 2 h. The reaction was stopped after 4 h, at which point more than 80% of the radiolabeled EE2 present was consumed. Radio-HPLC analysis indicated that the EE2-Sul product represented 54.3% of the total radioactivity in the incubate. The reaction was quenched by addition of 5 ml of ethanol, and the protein precipitate was filtered through a Pasteur pipette filled with glass wool and filter paper. The clear reaction solution was concentrated by rotary evaporation, and the product was purified by HPLC on a Phenomenex Luna(2) 10 × 250 mm column (Phenomenex, Torrance, CA) eluted with solvent A (water containing 0.1% trifluoroacetic acid) and solvent B (acetonitrile). The mobile phase was programmed as follows: 30% solvent B and 70% solvent A (0–30 min), 30 to 50% solvent B and 70 to 50% solvent A (30–40 min), and 50 to 100% solvent B, with 50 to 0% solvent A (40–45 min), at a flow rate of 4.5 ml/min (UV detector wavelength set at 215 nm). Fractions containing the pure product (32–34 min) were pooled and rotary evaporated. The final product was reconstituted in 90% ethanol to give 190 μCi of [3H]EE2-Sul (76% yield; radiochemical purity >99%). The specific activity was measured to be 49.8 Ci/mmol based on the abundance of radiolabels measured by liquid chromatography-mass spectrometry.
Stable Transfection of Human OATP1B1, OATP1B3, OATP2B1, OCT1, and NTCP in HEK-293 Cells.
HEK-293 cells were routinely grown in Dulbecco's modified Eagle's medium that contained 10% fetal calf serum in a humidified incubator at 37°C and 5% CO2. The stably transfected human epithelial kidney cell lines were established by using the Flp-In expression system (Invitrogen, Carlsbad, CA) according to the manufacturer's protocol. In brief, in separate reactions, the cDNAs, including the open reading frames of OATP1B1, OATP1B3, OATP2B1, OCT1, and NTCP, were subcloned into the Flp-In expression vector pcDNA5/FRT, which contained a FRT site linked to the hygromycin resistance gene. Each construct (pcDNA5/FRT-OATP1B1, pcDNA5/FRT-OATP1B3, pcDNA5/FRT-OATP2B1, pcDNA5/FRT-OCT1, and pcDNA5/FRT-NTCP) was then cotransfected with the Flp recombinase expression vector pOG44 into Flp-In HEK-293 cells. Cells stably expressing the transporters were selected in hygromycin (100 μg/ml) according to the manufacturer's protocol. The cells were grown in flasks cultured in Dulbecco's modified minimum essential medium (Invitrogen) supplemented with 10% fetal bovine serum and hygromycin (100 μg/ml). Cultures were maintained in a humidified atmosphere containing 5% CO2 at 37°C. Cells were split in a 1:5 ratio every 3 to 4 days.
Real-Time Polymerase Chain Reaction Assay.
Total RNA was isolated from NTCP/HEK-293 cells, OCT1/HEK-293 cells, and mock/HEK-293 cells by using an RNeasy Mini Kit (QIAGEN, Valencia, CA). The total RNA obtained was quantified by using the Agilent RNA 6000 Nano kit (Agilent Technologies, Santa Clara, CA) and detected with Agilent 2100 Bioanalyzer (Agilent Technologies).
After the RNA isolation, a two-step fast real-time polymerase chain reaction (PCR) assay was performed, using a 7900 Fast PCR System instrument (Applied Biosystems, Foster City, CA), according to the manufacturer's relative quantification (RQ) protocol. For the reverse transcription step, cDNA was reverse-transcribed from 2 μg of total RNA using random primers from a high-capacity cDNA archive kit (Applied Biosystems, Foster City, CA). In the PCR step, a master mixture solution was prepared using a TaqMan Fast Universal PCR Master Mix without AmpErase UNG (Applied Biosystems). All TaqMan assay primers (OCT1, Hs 00427554_m1; NTCP, Hs 00161820_m1; and β-actin, Hs 9999993_m1) and probes were ordered from Applied Biosystems.
The thermal cycling parameters were 20 s at 95°C (denaturing), 40 cycles in 3 s at 95°C (melting), and 30 s at 60°C (annealing and extending). Human β-actin gene was used as an endogenous control. Quantitative real-time PCR of the target mRNA and β-actin was run in the same plate but in different wells. The comparative cycle-threshold method (ΔΔCT method) was used for determination of RQ for each gene of interest. RQ values for each of the genes were then expressed as fold of control (mock/HEK-293 cells).
Western Blot Analysis.
OATP-transfected HEK-293 cells and pcDNA5/FRT mock cells were seeded and cultured (2.5 × 10⁵ cells/well) on BioCoat poly-d-lysine-coated 24-well plates (BD Biosciences) for 2 days. On the day of the assay, cells were rinsed with ice-cold phosphate-buffered saline and harvested with 200 μl of whole-cell lysis buffer (pH 7.4), which contained 10 mM Tris-HCl, 50 mM sodium chloride, 30 mM sodium pyrophosphate, 50 mM sodium fluoride, 100 μM sodium orthovanadate, 2 mM iodoacetic acid, 5 mM ZnCl2, 1 mM phenylmethylsulfonyl fluoride, and 0.5% Triton X-100. Cell lysates were vigorously vortexed and incubated on ice for 30 min. The homogenates were centrifuged at 13,000 rpm for 10 min at 4°C, and the supernatants were collected.
After mixing equal amounts of the samples in loading buffer followed by heating at 70°C for 10 min, the samples (20 μg of protein/well) were separated on NuPAGE (4–12%) Bis-Tris SDS gel (Invitrogen) at 150 V and transferred onto polyvinylidene difluoride membranes (Invitrogen) for 2 h at 150 mA. Blots were blocked with Tris-buffered saline, which contained 2% nonfat dry milk and 0.1% Tween 20, for 1 h at room temperature. The blots were probed with rabbit anti-OATP1B1 (1:1000 dilution), OATP1B3 (1:1000 dilution), and OATP2B1 (1:1000 dilution) antiserum. The blots were then subsequently probed with horseradish peroxidase-conjugated secondary antibodies followed by chemiluminescent detection using an ECL kit (GE Healthcare). Membranes were stripped with Restore Western blot stripping buffer (purchased from Pierce, Rockford, IL) and reprobed with mouse anti-actin and secondary anti-mouse IgG. The optical density of immunoreactive protein bands was detected using a GeneGnome Chemiluminescence Imaging System with GeneTools version 3.02a software (The Synoptics Group, Cambridge, UK).
Assessment of Transport with Cryopreserved Human Primary Hepatocytes.
Transporter-qualified cryopreserved human hepatocytes (donor number: HH145, HH171, HH293, and HH318) were purchased from BD Biosciences and thawed using a Hepatocyte Isolation Kit (XenoTech LLC, Lenexa, KS) according to the manufacturer's protocol. Cryopreserved human hepatocytes from four donors were pooled by resuspending in Krebs-Henseleit buffer to give a final cell density of 1.0 × 10⁶ viable cells/ml for the uptake study. The number of viable cells was then determined by trypan blue staining.
Cell suspensions were prewarmed in an incubator at 37°C for 3 min before the start of the uptake study. The uptake studies were then initiated by adding a fixed amount of radiolabeled substrate (plus or minus the requisite amount of unlabeled compound) to the cell suspension. For the assessment of inhibition, BSP (50 μM, NTCP, OATP and OAT inhibitor), PAH (1 mM, OAT inhibitor), and TEA (1 mM, OCT inhibitor) were added to the cell suspension. At the designated time (15 s, 1, 3, 5, and 10 min), an aliquot of cell suspension (200 μl) was transferred into centrifuge tubes that contained a top layer (100 μl) of silicone oil (density = 1.015 g/ml) and a bottom layer (50 μl) of potassium hydroxide (KOH; 3 M). In all cases, tubes were then centrifuged at 10,000g for 10 s at room temperature in a tabletop microfuge to spin down the hepatocytes through the oil layer into the KOH solution. The subsequent hepatocyte pellet was then digested in the KOH solution overnight at room temperature. Finally, the centrifuge tube was cut (at the center of the oil layer) and its contents were transferred to scintillation vials. The radioactivity, in both the buffer media compartment (i.e., top aqueous layer) and hepatocyte cell compartment (i.e., bottom aqueous layer), was counted in separate scintillation vials, and the uptake was normalized by dividing the uptake amount by the cellular protein content. The latter was measured by using the BCA protein assay kit supplied by Pierce.
Transport Studies with Transporter-Expressing HEK-293 Cells.
For uptake measurements, the stably transfected HEK-293 cells and mock control cells were seeded on BioCoat poly-d-lysine-coated 24-well plates at a density of 2.5 × 10⁵ cells/well. After culturing for 2 days, the cells were then washed twice with 2 ml of Hanks' balanced salt solution [(HBSS) 137 mM NaC1, 5.36 mM KCl, 0.20 mM MgSO4, 0.34 mM Na2HPO4, 0.44 mM KH2PO4, 4.17 mM NaHCO3, 1.26 mM CaC12, and 5.6 mM glucose] and incubated with radiolabeled substrate dissolved in HBSS supplemented with 10 mM HEPES (pH 7.4) at 37°C. In studies that were performed to examine the Na+ dependence of uptake (NTCP assay), NaCl in the buffer was replaced with choline chloride.
The incubation of the cells with radiolabeled compounds ([3H]estradiol-17β-d-glucuronide, [3H]CCK-8, [3H]estrone-3-sulfate, [3H]taurocholate, [3H]MPP, and [3H]EE2-Sul) was stopped at the designated time by removing the medium and washing the cells twice with 2 ml of ice-cold HBSS solution. Kinetic assessment of EE2-Sul uptake involved incubation of a constant amount of radiolabel, with varying amounts of unlabeled substrate. The kinetic parameters describing EE2-Sul transport by OATP1B1, OATP2B1, and NTCP were determined under linear conditions (3-min incubation). For the inhibition studies, well known inhibitors for each transporter were used at concentrations above their known respective IC50 (Ki) values to ensure maximal inhibition. The cells were dissolved with 0.3 ml of lysis buffer, which contained 0.1 N NaOH and 0.1% SDS, and the radioactivity was determined by liquid scintillation counting. Total cellular protein was measured using the BCA protein assay kit supplied by Pierce.
Transport Studies with Human MRP1, MRP2, MRP3, BSEP, and BCRP-Expressing Membrane Vesicles.
The transport studies were performed using a rapid filtration technique according to the manufacturer's protocol with a minor modification (Genomembrane, Inc. and BD Biosciences). In brief, 30 μl of transport medium [50 mM MOPS-Tris (pH 7.0), 70 mM KCl, 7.5 mM MgCl2, and 2 mM glutathione], which contained membrane vesicles (50 μg of protein) and radiolabeled test compounds ([3H]estradiol-17β-d-glucuronide, [3H]taurocholate, [3H]methotrexate, and [3H]EE2-Sul), was preincubated at 37°C for 5 min and then rapidly mixed with 20 μl of the reaction mixture that contained 4 mM ATP or AMP. After 2 min, the transport was stopped by addition of ice-cold wash buffer [(200 μl) 40 mM MOPS-Tris, pH 7.0, 70 mM KCl]. The incubation mix was then rapidly transferred to a PerkinElmer Unifilter GF/B plate followed by five more 250-μl washes using a FilterMate Harvester (PerkinElmer Life and Analytical Sciences). Radioactivity in each was determined using a PerkinElmer Top Count NXT Microplate Scintillation and Luminescence Counter. ATP-dependent transport was calculated by subtracting the values obtained in the presence of AMP from those in the presence of ATP. The EE2-Sul uptake into BCRP membrane vesicles was linear up to 2 min, thus concentration dependence was evaluated after 2 min of incubation over a wide EE2-Sul concentration range (10 nM–200 μM).
Transport Studies with Human P-gp-Expressing MDCK Cells.
Wild-type MDCK cells (MDCK-WT), and stable MDCK transfectants overexpressing human P-gp/MDR1 (MDCK-MDR1 cells), were seeded onto a filter membrane at a density of ∼100,000 cells/cm2 in 24-well Transwell plates. The cells were grown in Dulbecco's modified Eagle's medium supplemented with 10% fetal bovine serum, 1% nonessential amino acids, 1% l-glutamine, 100 U/ml penicillin-G, and 100 μg/ml streptomycin. The culture medium was replaced every 2 days, and the cells were maintained at 37°C in 95% relative humidity and 5% CO2. Transport studies were conducted with the monolayers cultured for 5 days (monolayers with transepithelial electrical resistance values greater than 350 Ω cm2 were used for the studies).
The transport medium was composed of HBSS buffer containing 10 mM HEPES, and the pH of both the apical and basolateral compartments was 7.4. At the beginning of each experiment, each monolayer was washed twice with HBSS buffer and the transepithelial electrical resistance was measured to ensure the integrity of the monolayers. Transport was initiated by adding an appropriate volume of buffer containing [3H]digoxin or [3H]EE2-Sul to either the apical (A to B transport) or basal (B to A transport) side of the monolayer. The volumes of the apical and basal compartments were 200 and 600 μl, respectively. The monolayers were then incubated for 2 h at 37°C. Samples are taken from either the apical (B to A transport) or basal (A to B transport) compartment at the end of the 2-h incubation period and analyzed for [3H]digoxin or [3H]EE2-Sul using liquid scintillation counting. The A to B, as well as the B to A, permeability coefficient (Pc) was calculated according to the following equation:
 where Pc is permeability in nm/s, dA/dt is the flux of the test compound across the monolayer (nmol/s), S the surface area of the cell monolayer, and Co is the initial concentration.
Estimation of Kinetic Parameters.
To estimate kinetic parameters for saturable transport, the uptake rate (V) was fitted to the following equations by means of nonlinear least-squares regression analysis using WinNonlin (Scientific Consulting Inc., Cary, NC).
The kinetic parameters describing the uptake of EE2-Sul were obtained using the following equations: in the case of a single saturable component (OATP2B1 and NTCP) (eq. 1),
 for a system consisting of two saturable components (OATP1B1 and BCRP),
 for a system involving two saturable components and one passive diffusion process (human hepatocytes),
 where V and C are the uptake rate and concentration of substrate, respectively, and Km, Vmax, and Pdif represent the half saturation concentration (Michaelis constant), the maximal transport rate, and the nonsaturable uptake clearance, respectively.
The uptake activity of OATP1B1, OATP2B1, and NTCP by HEK-293 cells was evaluated after subtracting the uptake by mock-transfected cells from total uptake by the OATP1B1, OATP2B1, or NTCP-expressing cells. In the membrane vesicle study, uptake of EE2-Sul by BCRP was evaluated after subtracting the uptake in the presence of AMP from the uptake in the presence of ATP.
All data are expressed as the mean ± S.D., and statistical analysis was performed by a two-way analysis of variance followed by a post hoc Dunnett's test. The criterion of significance was p < 0.05 or p < 0.01.
Results
Uptake of EE2-Sul by Human Cryopreserved Hepatocytes.
In the presence of pooled human cryopreserved hepatocytes (four organ donors), EE2-Sul uptake was found to be rapid and time- and temperature-dependent (Fig. 1A). The uptake difference at two points (15 s versus 1 min) was used to calculate the rate of EE2-Sul uptake, which supported the determination of kinetic parameters and the inhibition study. For example, the rate of EE2-Sul uptake at 37°C was unchanged when a known OAT (PAH, 1 mM) and OCT (TEA, 1 mM) inhibitor were added to the incubation (Fig. 1B). In contrast, an OATP and NTCP inhibitor (BSP, 50 μM) significantly reduced (∼90%) EE2-Sul uptake. Therefore, OATPs and NTCP are likely involved in the uptake of EE2-Sul into human hepatocytes.

Time profiles of [3H]EE2-Sul uptake (A), the effect of transporter inhibitors on [3H]EE2-Sul uptake (B), concentration dependence (C), and Eadie-Hofstee plot (D) describing the uptake of EE2-Sul by cryopreserved human hepatocytes. A, hepatocytes were incubated with [3H]EE2-Sul (0.1 μM) at 37°C (●) and 4°C (○), and its uptake was measured for periods up to 5 min. B, EE2-Sul (0.1 μM) uptake into human hepatocytes for 15 s and 1 min at 37°C was measured in the presence of transporter inhibitors. C, [3H]EE2-Sul (0.01–200 μM) uptake into human hepatocytes was measured for 15 s and 1 min at 37°C. D, the uptake kinetics of [3H]EE2-Sul described as an Eadie-Hofstee plot. Each data point represents the mean ± S.D. (n = 3 determinations).
The rate of hepatocyte uptake varied over the EE2-Sul concentration range evaluated (10 nM–200 μM) at 37°C (Fig. 1C), and the derived Eadie-Hofstee plot was indicative of biphasic (two-Km) kinetics (Fig. 1D). To calculate the kinetic parameters, two models (2 saturable components ± 1 passive diffusion component) were established (eq. 2 and 3). Based on Akaike's information criterion value comparison between the two models (−31.1 versus −18.7), two saturable components plus one passive diffusion process was selected. The Km and Vmax values for the low-Km/low-capacity (Km1 and Vmax1) and high-Km/high-capacity component (Km2 and Vmax2) were as follows: Km1 = 0.22 ± 0.05 μM, Vmax1 = 190 ± 42 pmol/min/mg, Km2 = 15.5 ± 7.0 μM, Vmax2 = 2350 ± 686 pmol/min/mg, and Pdif = 36.5 ± 5.3 μl/min/mg, respectively.
Uptake of EE2-Sul in the Presence of OATP-Expressing HEK-293 Cells.
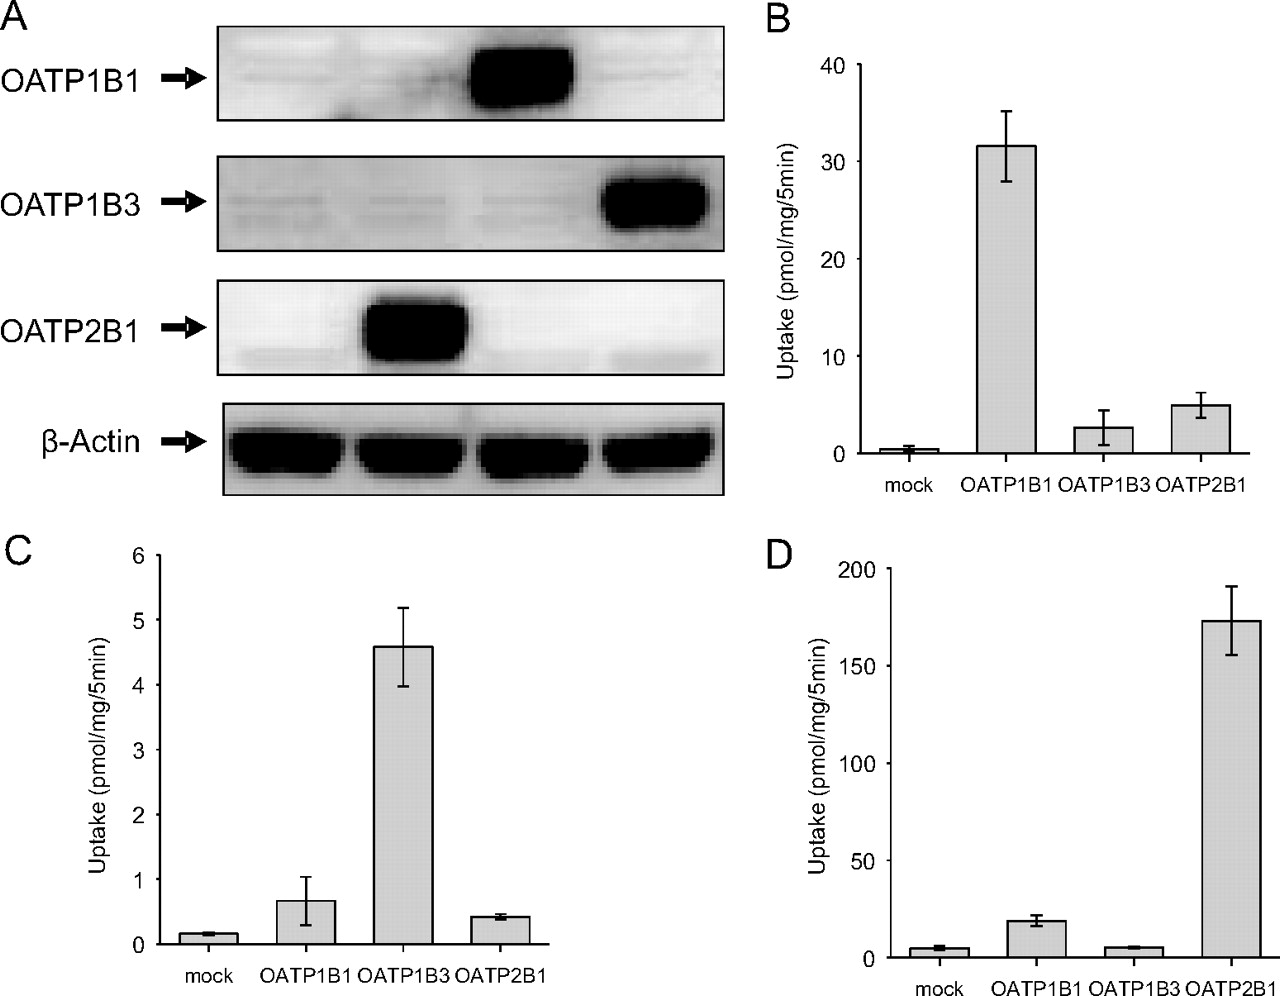
To identify which transporters are involved in the hepatic uptake of EE2-Sul in humans, transporter phenotyping studies were extended to include HEK-293 cells that contained individually expressed OATP1B1, OATP1B3, and OATP2B1. In each case, protein expression was confirmed by Western blot analysis. As shown in Fig. 2A, the mock/HEK-293 cells showed no expression of OATP1B1, OATP1B3, and OATP2B1. Western blot analysis of OATP2B1-expressing cells revealed a band at approximately at 75 kDa. Bands at 80 kDa and 120 kDa were specifically detected with anti-OATP1B1 and anti-OATP1B3 in OATP1B1- and OATP1B3-expressing cells, respectively. The molecular size of the detected bands is consistent with the literature observations (St-Pierre et al., 2002; Hirano et al., 2004).

Western blot and functional characterization of HEK-293 cells expressing OATP2B1, OATP1B1, and OATP1B3. A, HEK-293 cells were stably transfected with expression plasmids for OATP2B1, OATP1B1, OATP1B3, or vector control. Cell lysate (20 μg) was loaded on a NuPAGE (4–12%) Bis-Tris SDS gel (left to right in figure: mock, OATP2B1, OATP1B1, and OATP1B3 cells) and transferred onto polyvinylidene difluoride membranes (see Materials and Methods). In turn, membranes were incubated with a polyclonal anti-OATP2B1, OATP1B1, or OATP1B3 sera raised in rabbits. A positive signal at approximately 75 kDa (OATP2B1), 80 kDa (OATP1B1), and 120 kDa (OATP1B3) was present only in OATP2B1/HEK-293 cells, OATP1B1/HEK-293 cells, or OATP1B3/HEK-293 cells. Uptake of [3H]estradiol-17β-d-glucuronide (1 μM) (B), [3H]CCK-8 (0.1 μM) (C), and [3H]estrone-3-sulfate (1 μM) (D) into mock-, OATP2B1-, OATP1B1-, and OATP1B3-HEK-293 cells was determined at 5 min. Data are shown as the mean ± S.D. (n = 4 determinations).
The OATP-transfected cells were functionally characterized by measuring uptake of OATP substrates (estrone-3-sulfate, estradiol-17β-d-glucuronide, and CCK-8) for each transporter. When the uptake of three substrates in each cell type was compared, a significantly higher uptake of estradiol-17β-d-glucuronide was observed with OATP1B1 cells (Fig. 2B). CCK-8 uptake was significant in the presence of OATP1B3 cells (Fig. 2C), whereas estrone-3-sulfate uptake was highest in OATP2B1-expressing cells (Fig. 2D).
Next, EE2-Sul (0.1 μM) uptake was measured in OATP-expressing cells and compared with that of mock cells. EE2-Sul uptake of OATP1B1 was significantly higher than that of mock cells (Fig. 3A). OATP2B1 cells also showed significantly higher uptake of EE2-Sul compared with mock cells. However, no differential uptake was observed with the OATP1B3 cells (versus mock). OATP1B1-mediated EE2-Sul (0.05 μM) uptake for 3 min was also measured in the presence of OATP substrates and inhibitors (BSP, taurocholate, and rifampin). The OATP1B1 (or OATP1B3)-mediated uptake was calculated after subtracting the EE2-Sul uptake by mock cells from uptake obtained with OATP1B1- (or OATP1B3-) expressing cells. For both transporters, the difference was assigned as 100% in the inhibition studies. As presented in Fig. 3B, all the test compounds significantly reduced EE2-Sul uptake into OATP1B1 cells in a concentration-dependent manner, with BSP demonstrating the greatest inhibition. As expected, TEA did not inhibit EE2-Sul uptake. A similar inhibition pattern was observed with the OATP2B1-expressing HEK-293 cells, although the degree of inhibition was different for BSP, rifampin, and taurocholate (Fig. 3C). Such a difference can be rationalized by the differences in EE2-Sul Km for recombinant OATP1B1 versus OATP2B1, at a fixed concentration of substrate, and differences in the inhibition constant.

Uptake of [3H]EE2-Sul by HEK-293 cells expressing OATP1B1, OATP1B3, and OATP2B1 and impact of OATP inhibitors. A, uptake of [3H]EE2-Sul into mock, OATP2B1, 1B1, and 1B3/HEK-293 cells was determined after 3 min of incubation. B, uptake of [3H]EE2-Sul (0.1 μM) by OATP2B1/HEK-293 cells was determined in the absence and presence of transporter inhibitors and reported as a percentage of EE2-Sul-only control. C, uptake of [3H]EE2-Sul (0.05 μM) by OATP1B1/HEK-293 cells was determined in the absence and presence of transporter inhibitors and also reported as a percentage of EE2-Sul-only control. Data are shown as the mean ± S.D. (n = 3 determinations). **, p < 0.01 versus control.
The concentration-dependent uptake of EE2-Sul by OATP1B1-expressing and mock cells was observed. As the EE2-Sul concentration increased from 10 nM to 250 μM, the uptake into mock cells increased linearly, whereas uptake into OATP1B1 was nonlinear (data not shown). By subtracting uptake into mock/HEK-293 cells, from OATP1B1/HEK-293 cells, it was possible to assess the rate of OATP1B1-mediated uptake over the EE2-Sul concentration chosen (Fig. 4A). The Eadie-Hofstee plot for OATP1B1-mediated uptake demonstrated two saturable components (low-Km/low-capacity and the high-Km/high-capacity); Km1 = 0.087 ± 0.018 μM, Vmax1 = 2.42 ± 0.32 pmol/min/mg, Km2 = 141 ± 30 μM, and Vmax2 = 152 ± 22 pmol/min/mg, respectively (Fig. 4B).
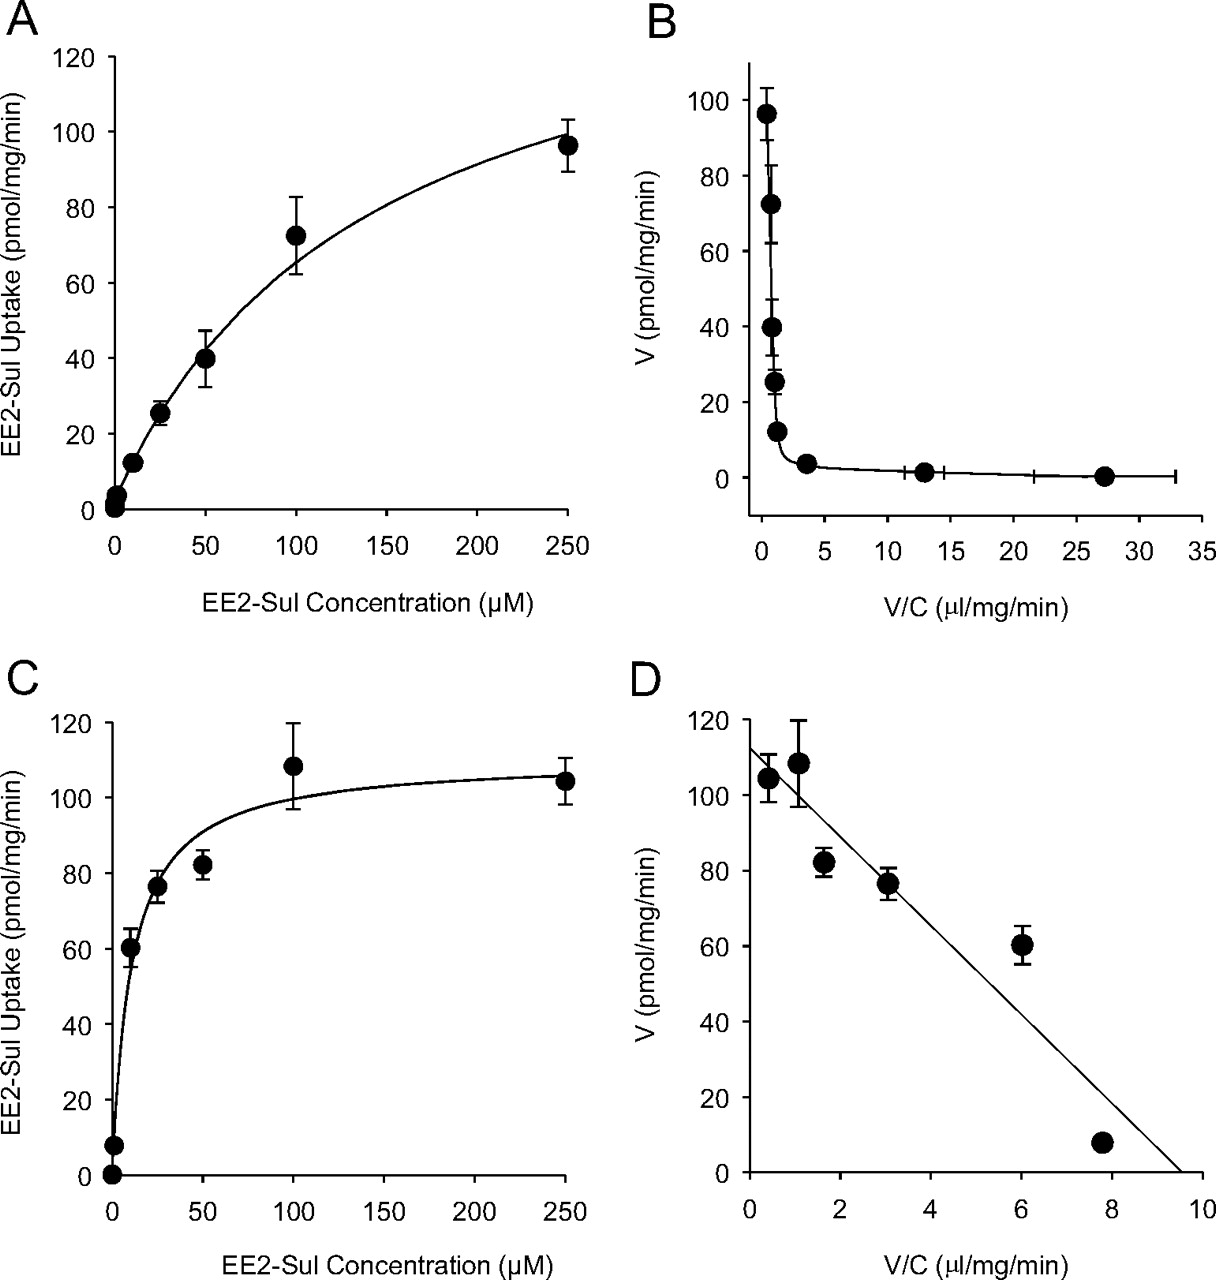
Concentration dependence (A) and the Eadie-Hofstee plot (B) describing the uptake of EE2-Sul by OATP1B1 and OATP2B1/HEK-293 cells. A, [3H]EE2-Sul (0.01–250 μM) uptake into mock and OATP1B1/HEK-293 cells was measured, and OATP1B1-mediated uptake was obtained by subtracting the uptake into mock/HEK-293 cells from OATP1B1/HEK-293 cells. B, the uptake kinetics was described as an Eadie-Hofstee plot. C, [3H]EE2-Sul (0.01–250 μM) uptake into mock and OATP2B1/HEK-293 cells was measured, and OATP2B1-mediated uptake was obtained by subtracting the uptake into mock/HEK-293 cells from OATP2B1/HEK-293 cells. D, the uptake kinetics was described as an Eadie-Hofstee plot. Each data point represents the mean ± S.D. (n = 3 determinations).
OATP2B1-mediated EE2-Sul uptake in HEK-293 cells, also assessed by subtracting uptake into mock/HEK-293 cells, was saturable and described by a single Km (10.7 ± 2.3 μM) and Vmax (110 ± 7 pmol/mg/min) (Fig. 4, C and D). Overall, these results suggested that OATP1B1 and OATP2B1, but not OATP1B3, are involved in EE2-Sul hepatic uptake.
Uptake of EE2-Sul by OCT1-Expressing HEK-293 Cells.
Before conducting any transport studies, stably transfected OCT1-expressing HEK-293 cells were subjected to real-time PCR analysis, and the results revealed significant overexpression (82,300-fold) of OCT1 (versus mock cells) (data not shown). The OCT1/HEK-293 cells were also functionally characterized by measuring MPP uptake for 5 min. In this instance, MPP uptake into OCT1/HEK-293 cells was significantly higher (versus mock/HEK-293 cells) (Table 1). As expected, the increased uptake of MPP into OCT1/HEK-293 cells was inhibited by imipramine (200 μM), a known OCT inhibitor (Urakami et al., 2001). As shown in Table 1, EE2-Sul uptake into OCT1/HEK-293 cells was not increased greatly (versus mock/HEK-293 cells), and imipramine had a minimal effect. These results suggested that EE2-Sul was not a substrate of OCT1.
The uptake of MPP and EE2-Sul by stably transfected OCT1/HEK-293 cells
The details of measurement are described under Materials and Methods.
Uptake of EE2-Sul by NTCP-Expressing Cells.
NTCP was also assessed as a potential EE2-Sul transporter using HEK-293 cells. Real-time PCR analysis showed that the level of NTCP mRNA was highly (32,400-fold) increased in NTCP/HEK-293 cells over mock/HEK-293 cells (data not shown). As expected, [3H]taurocholate uptake into NTCP/HEK-293 cells was high compared with mock/HEK-293 cells (Fig. 5A). When sodium was replaced by choline in the transport buffer, uptake by the NTCP/HEK-293 cells was significantly decreased. Therefore, [3H]taurocholate uptake was sodium-dependent. Under the same assay conditions, EE2-Sul uptake into HEK-293 cells expressing NTCP was greater than with mock cells and was also dependent on sodium (Fig. 5B).
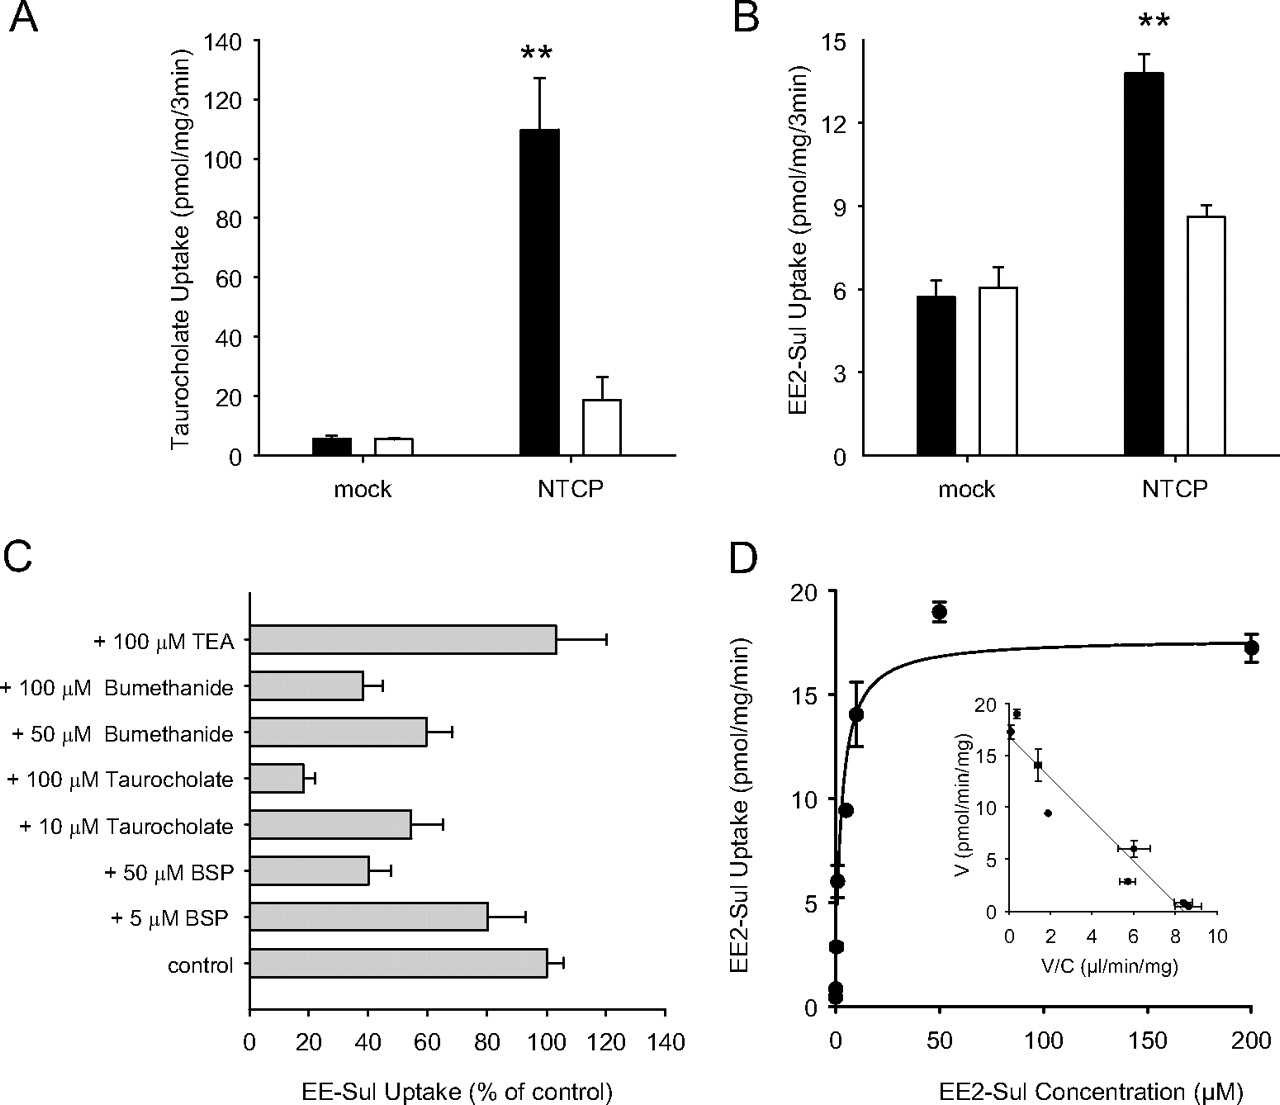
Uptake of [3H]taurocholate (A) and [3H]EE2-Sul (B) by HEK-293 cells containing stably expressed NTCP, inhibition of EE2-Sul (C) uptake in NTCP/HEK-293 cells, and concentration dependence (D) of the uptake of [3H]EE2-Sul by NTCP/HEK-293 cells. A, uptake of [3H]taurocholate (1 μM) into mock and NTCP/HEK-293 cells was determined in the normal HBSS buffer containing sodium chloride (■) or choline chloride (□). B, uptake of [3H]EE2-Sul into mock and NTCP/HEK-293 cells. C, uptake of EE2-Sul (0.05 μM) was determined in the absence and presence of transporter inhibitors and reported as a percentage of EE2-Sul-only control. D, [3H]EE2-Sul (0.01–200 μM) uptake into mock and NTCP/HEK-293 cells was measured, and NTCP-mediated uptake was obtained by subtracting the uptake into mock/HEK-293 cells from NTCP/HEK-293 cells (Eadie-Hofstee plot inset). Each point with bar represents the mean ± S.D. (n = 3 determinations). *, p < 0.05 versus control.
The NTCP-mediated uptake (uptake by NTCP cells minus uptake by mock cells) in the absence of inhibitor was designated 100%, and the effect of each inhibitor is shown in Fig. 5C. All three NTCP inhibitors (BSP, bumetanide, and taurocholate) reduced EE2-Sul uptake by NTCP/HEK-293 cells in a concentration-dependent manner. These results suggest that EE2-Sul is an NTCP substrate.
The concentration-dependent uptake of EE2-Sul into both mock and NTCP cells was observed. As EE2-Sul concentration increased from 10 nM to 200 μM, the uptake into mock cells increased linearly, whereas the uptake into NTCP-expressing cells was saturable (data not shown). By subtracting uptake into mock/HEK-293 cells, it was possible to characterize NTCP-dependent uptake of EE2-Sul as a single Km (2.6 ± 0.5 μM) and Vmax (17.7 ± 1.2 pmol/min/mg) process (Fig. 5D). Collectively, these results suggest that EE2-Sul is an NTCP substrate.
Uptake by BCRP Vesicles.
To understand the efflux mechanism of EE2-Sul in human liver, additional transport studies were conducted with membrane vesicles expressing BCRP, a canalicular membrane transporter. As expected, it was possible to demonstrate ATP-dependent uptake of methotrexate into vesicles expressing BCRP (Fig. 6A). When EE2-Sul uptake was measured under the same conditions, EE2-Sul also showed higher uptake into BCRP vesicles in the presence of ATP (versus AMP) (Fig. 6B). However, ATP-dependent uptake was not found in control vesicles. In addition, the ATP-dependent uptake into BCRP vesicles was absent when a BCRP inhibitor fumitremorgin C (10 μM) was added to the incubation. These results suggested that EE2-Sul was a BCRP substrate, and follow-up kinetic assessment revealed that the rate of transport was EE2-Sul concentration-dependent (10 nM–200 μM), in addition to being described by a two-Km model (Km1 = 2.9 ± 1.3 μM, Vmax1 = 25.9 ± 11.7 pmol/mg/min; Km2 = 307 ± 143 μM, Vmax2 = 470 ± 125 pmol/mg/min) (Fig. 6, C and D). The high Km (307 μM) of the low-affinity component is a best estimate with the current data set, because the highest substrate concentration tested was 200 μM.

Uptake of [3H]EE2-Sul and kinetics of ATP-dependent [3H]EE2-Sul uptake by Sf9 membrane vesicles containing BCRP. Control (mock) and BCRP-expressing vesicles were incubated with [3H]methotrexate (50 μM) (A) and [3H]EE2-Sul (0.1 μM) (B) at 37°C in the presence of 4 mM AMP (□) or ATP (■). Fumitremorgin C (FTC; 10 μM) was added as a BCRP inhibitor. Vesicular uptake was determined as described under Materials and Methods. C, membrane vesicles expressing BCRP were incubated with [3H]EE2-Sul (0.01–200 μM) at 37°C in the presence of 4 mM AMP or ATP. ATP-dependent uptake of EE2-Sul was determined by subtracting EE2-Sul uptake in the presence of AMP from uptake in the presence of ATP. D, the kinetics of ATP-dependent transport of [3H]EE2-Sul was described as an Eadie-Hofstee plot. Each data point represents the mean ± S.D. (n = 3 determinations). **, p < 0.01 versus mock (ATP).
Uptake of EE2-Sul by MRP1-, MRP2-, MRP3-, and BSEP-Containing Vesicles.
The assessment of EE2-Sul transport was extended to include additional efflux transporters known to be expressed in the liver (Fig. 7). In all cases, uptake of the appropriate positive control substrate was found to be ATP-dependent (e.g., estradiol-17β-d-glucuronide for MRP1, MRP2, and MRP3; taurocholate for BSEP). Under the same assay conditions, however, it was not possible to detect any ATP-dependent uptake of EE2-Sul. Collectively, the data indicate that EE2-Sul is not an MRP1, MRP2, MRP3, or BSEP substrate (Fig. 7).

Uptake of [3H]EE2-Sul by Sf9 membrane vesicles containing MRP1 (A), MRP2 (B), MRP3 (C), and BSEP (D). MRP1 (A), MRP2 (B), MRP3 (C), and BSEP (D) vesicles were incubated with positive controls (1 μM) and [3H]EE2-Sul (0.1 μM) at 37°C in the presence of 4 mM AMP or ATP. Positive controls were [3H]estradiol-17β-d-glucuronide for MRP1, MRP2, and MRP3 and [3H]taurocholate for BSEP. Vesicular uptake was determined as described under Materials and Methods. Results are the means ± S.D. (n = 3 determinations).
Bidirectional Transport in P-gp-Expressing Cells.
The bidirectional permeability of digoxin was determined in monolayers of MDCK-WT and P-gp/MDR1-transfected MDCK (MDCK-MDR1) cells. Digoxin exhibited higher B to A (130 ± 15 nm/s) than A to B (37.4 ± 1.8 nm/s) permeability in MDCK-WT cells (efflux ratio of 3.5), which indicated substantial expression of P-gp therein. However, the bidirectional transport of digoxin was more evident (efflux ratio of 10.7) in MDCK cells transfected with MDR1 (A to B, 14.5 ± 1.1 nm/s; B to A, 156 ± 15 nm/s). In both cases, the efflux ratio was decreased in the presence of P-gp inhibitor GF-120918 (2 μM) (Fig. 8A). These results indicated that the MDCK-MDR1 cells expressed high levels of inhibitable P-gp.

Efflux ratio of digoxin (A) and EE2-Sul (B) across MDCK-WT and MDCK-MDR1 monolayers in the presence (□) and absence (■) of GF-120918. MDCK-WT and MDCK-MDR1 cells were incubated with [3H]digoxin (5 μM) and [3H]EE2-Sul (1 μM) for 2 h at 37°C. In all cases, the basal-to-apical and apical-to-basal permeability was determined and reported as an efflux ratio (basal to apical/apical to basal) in the absence and presence of GF-120918 (2 μM). See Materials and Methods. Results are the means ± S.D. (n = 3 determinations).
Permeability of EE2-Sul (1 μM) across MDCK-WT and MDCK-MDR1 cells was also assessed under the same conditions as digoxin. In contrast to digoxin, the directional permeability of EE2-Sul was not observed in both MDCK-WT (A to B, 124 ± 3 nm/s; B to A, 129 ± 25 nm/s) and MDCK-MDR1 cells (A to B, 99.9 ± 3.7 nm/s; B to A, 93.8 ± 0.6 nm/s). As a result, the efflux ratios of EE2-Sul in both cell lines were close to unity. Furthermore, GF-120918 did not change the efflux ratio of EE2-Sul in both cell lines (Fig. 8B). The results suggest that EE2-Sul is not a P-gp substrate.
Discussion
EE2-Sul is a major circulating sulfated metabolite of EE2, and the liver transporters governing its distribution and excretion have yet to be elucidated. Therefore, liver transporter phenotyping studies were undertaken with [3H]EE2-Sul as substrate. The phenotyping studies used transporter-competent cryopreserved human hepatocytes, transfected cell lines, and membrane vesicles. Because cryopreserved human hepatocytes retain their transporter functions, they are widely used as a tool to examine the mechanism(s) of drug uptake (Shitara et al., 2003). In this regard, it was possible to assess the temperature and concentration dependence of EE2-Sul uptake into human hepatocytes and to evaluate the impact of known transporter inhibitors. Overall, the data implicated NTCP and OATPs as major determinants of EE2-Sul uptake. For example, EE2-Sul uptake was markedly inhibited (∼90%) by BSP, a known OATP (Bossuyt et al., 1996; Cui et al., 2001; Tamai et al., 2001; Nozawa et al., 2004) and NTCP inhibitor (Kim et al., 1999). In agreement, EE2-Sul was shown to be a substrate of stably expressed OATP1B1, OATP2B1, and NTCP in HEK-293 cells. The lack of uptake in OATP1B3-expressing HEK-293 cells (Fig. 3A) implies that the transporter phenotype of EE2-Sul resembles that of estrone-3-sulfate (Cui et al., 2001; Kullak-Ublick et al., 2001; Hirano et al., 2004; Nozawa et al., 2004). Lack of inhibition of EE2-Sul uptake in human hepatocytes by TEA and PAH ruled out OCT and OAT, respectively. This observation is supported by the lack of EE2-Sul uptake into HEK-293 cells expressing OCT1 (Table 1). Recombinant OAT2 was not available at the time of study.
For the first time, it was possible to report that uptake of EE2-Sul into human primary hepatocytes conforms to two-Km kinetics (Km1 = 220 nM; and Km2 = 15.5 μM). Such a biphasic profile suggests the involvement of at least two populations of transporters, and the data discussed previously implicate OATP1B1, OATP2B1, and NTCP. Because OATP1B1-dependent EE2-Sul uptake into HEK-293 cells was also biphasic (Km1 = 87 nM; and Km2 = 141 μM), and OATP2B1- (Km = 10.7 μM) and NTCP- (Km = 2.6 μM) dependent uptake conformed to single Km kinetics (Figs. 4 and 5), it is assumed that low-Km EE2-Sul uptake into primary human hepatocytes is largely reflective of OATP1B1. By inference, all three transporters contribute to high-Km EE2-Sul uptake, and, like as estrone-3-sulfate, EE2-Sul behaves as a two-Km OATP1B1 substrate (Tamai et al., 2001; Noé et al., 2007). Thus, the findings of the present study suggest that sulfate conjugates of estrogen-like compounds bind to OATP1B1 in a similar manner. Moreover, it is the low-Km component of EE2-Sul uptake into hepatocytes that is likely to be relevant clinically. For example, plasma levels of EE2-Sul are approximately 23 times greater than those of EE2 after a large (3 mg) oral dose of EE2 (Back et al., 1980). At regular doses of EE2 (∼50 μg), EE2 plasma levels range between 0.25 and 0.71 nM (Nilsson and Nygren, 1978; Back et al., 1979; Akpoviroro and Fotherby, 1980; Brenner et al., 1980). If one assumes that the EE2 to EE2-Sul ratio is independent of dose, then EE2-Sul plasma levels are estimated to be within the range of 5.6 to 15.9 nM. However, when one considers that EE2 undergoes considerable first-pass sulfation in the human gut, the levels of EE2-Sul presented to the liver during first pass (via the portal vein) might be much higher than the range described above. Furthermore, intersubject variability has been reported for EE2 (e.g., >10-fold in bioavailability and half-life) such that certain subjects could be exposed to even higher concentrations of EE2-Sul (Akpoviroro and Fotherby, 1980). Therefore, by extension, low-Km OATP1B1 uptake will likely govern the entry of EE2-Sul into the liver and its disposition.
To date, the transporters involved in the efflux of EE2-Sul have not been characterized fully. This assertion is important because EE2-Sul has been recovered in the bile of human subjects receiving a radiolabeled dose of EE2 (Back et al., 1979; Maggs et al., 1983; Zhang et al., 2007). Because EE2-Sul contains an anionic moiety (sulfate), the involvement of the MRP family of transporters is possible. For example, both estrone-3-sulfate and DHEAS serve as MRP1 substrates (Qian et al., 2001; Bai et al., 2004), whereas estrone-3-sulfate (Matsushima et al., 2005; Spears et al., 2005), DHEAS (Sasaki et al., 2002; Spears et al., 2005), and taurolithocholate-3-sulfate (Sasaki et al., 2002) have been reported as MRP2 substrates, and taurolithocholate-3-sulfate has been reported as an MRP3 substrate (Akita et al., 2002). Despite literature precedent, however, it was not possible to measure significant ATP-dependent EE2-Sul transport in membrane vesicles that contained MRP1, MRP2, or MRP3 (Fig. 7). In support of this finding, Chu et al. (2004) have also found that EE2-Sul was not transported by MRP1, MRP2, and MRP3, whereas EE2-Glu serves as an MRP2 and MRP3 substrate. The results of the present study suggest that MRPs selectively recognize certain sulfate conjugates as their substrate. Lack of EE2-Sul transport also extended to BSEP (Fig. 7), which is known to efflux bile salts and drugs such as pravastatin (Hirano et al., 2005).
In terms of EE2-Sul efflux, BCRP is an additional candidate transporter. This is a possibility because 4-methylumbelliferone sulfate (Suzuki et al., 2003), 6-hydroxy-5,7-dimetyl-2-metylamino-4-(3-pyridylmethyl) benzothiazole sulfate (Suzuki et al., 2003), DHEAS (Suzuki et al., 2003), and estrone-3-sulfate (Imai et al., 2003; Suzuki et al., 2003; Matsushima et al., 2005) have all been shown to serve as BCRP substrates. The results of the present study indicate that EE2-Sul does undergo ATP-dependent uptake into membrane vesicles expressing BCRP (Fig. 6). In fact, such uptake can be described by a two-Km model (Km1 = 2.9 μM, Km2 = 307 μM). The low Km reported for EE2-Sul herein (2.9 μM) is lower than the Km reported for BCRP-dependent flux of estrone-3-sulfate (6.8–17 μM) (Suzuki et al., 2003; Imai et al., 2003). Therefore, structurally similar sulfate conjugates (EE2-Sul and estrone-3-sulfate) exhibit some differentiation in terms of their interaction with MRP2 and BCRP.
P-gp is a second canalicular membrane transporter in the human liver. Although it is thought that P-gp accepts hydrophobic cationic or neutral compounds as substrates, some organic anions such as estrone-3-sulfate and estradiol-17β-d-glucuronide can behave as substrates (Huang et al., 1998; Matsushima et al., 2005). However, the results obtained in the present study clearly indicated that EE2-Sul is not a substrate of P-gp. Therefore, P-gp was ruled out as an EE2-Sul transporter.
In the intestine, EE2 likely diffuses passively through the apical membrane of enterocytes, because there is information supporting its high permeability (Zhang et al., 2007). Once in the enterocyte, it undergoes extensive 3-O-sulfation to form EE2-Sul. At the present time, however, the mechanism by which EE2-Sul undergoes efflux across the basolateral membrane (from the enterocyte into the portal blood) is unknown. Although MRP3 is one of the efflux transporters expressed on the basolateral membrane of enterocytes (Klaassen and Aleksunes, 2010), its role in EE2-Sul transport was ruled out in the present study. Another possibility is that EE2-Sul may serve as a substrate of other transporters for organic anions (e.g., OSTα and OSTβ) expressed on the basolateral membrane of epithelial cells in a variety of tissues including the intestine (Ballatori et al., 2005). Indeed, OSTα and OSTβ function as a heterodimer to transport various organic anions such as estrone-3-sulfate, bile acids, and prostaglandin E2 (Seward et al., 2003). Therefore, OSTα and OSTβ may be the candidate transporters for EE2-Sul efflux on the basolateral membrane, but this theory requires further study.
In summary, the data presented herein indicate that EE2-Sul is an OATP1B1, OATP2B1, NTCP, and BCRP substrate. EE2-Sul uptake into hepatocytes involves OATP1B1, with some contribution from OATP2B1 and NTCP. On the other hand, BCRP likely plays a role in the active secretion of EE2-Sul into bile. Consequently, the overall clearance of EE2-Sul, once formed by SULTs, is governed by the interplay between the uptake and efflux transporters in the liver. Once EE2-Sul is in bile, it likely undergoes hydrolysis (involving gut bacteria) to EE2, which can be reabsorbed. Because OATP2B1 is known to be highly expressed in the human intestine (Kobayashi et al., 2003), uptake of EE2-Sul from the lumen of the gut is a second possibility. Thus, both EE2-Sul and EE2 can re-enter the circulation and the hepatobiliary pool and undergo enterohepatic recirculation. For EE2, Back et al. (1979) have proposed enterohepatic recirculation to account for the secondary rise in plasma EE2 levels. In the case of EE2-Sul, its higher concentrations (versus EE2) in circulation likely reflect the net balance between SULT-mediated first-pass sulfation and subsequent OATP/NTCP-mediated liver uptake and BCRP-dependent efflux into bile. When conducting a drug interaction with EE2, it is possible to determine the ratio of EE2-Sul to EE2 in plasma and assess the likely impact of the drug in question on EE2 sulfation (Schrag et al., 2004; Zhang et al., 2007; Schwartz et al., 2009). Given the results of the present study, however, it is apparent that changes in circulating levels of EE2-Sul could be ascribed not only to modulation of first-pass sulfation but also to effects on one or more transporters (OATP1B1, OATP2B1, NTCP, and BCRP). In vitro assessment of impact on EE2-Sul transporters, in additional to SULT-dependent EE2 metabolism, may be warranted for some new chemical entities. Once generated, the in vitro data can be used to rationalize the clinical interaction.
Footnotes
Article, publication date, and citation information can be found at http://dmd.aspetjournals.org.
doi:10.1124/dmd.109.031518.
-
ABBREVIATIONS:
- EE2
- 17α-ethinylestradiol
- UGT
- UDP-glucuronosyltransferase
- EE2-Sul
- 17α-ethinylestradiol-3-O-sulfate
- SULT
- sulfotransferase
- OAT
- organic anion transporter
- OCT
- organic cation transporter
- OATP
- organic anion-transporting polypeptide
- MRP
- multidrug resistance-associated protein
- BCRP
- breast cancer resistance protein
- P-gp
- P-glycoprotein
- BSEP
- bile salt export pump
- EE2-Glu
- 17α-ethinylestradiol 3-O-glucuronide
- HEK
- human embryonic kidney
- NTCP
- sodium taurocholate-cotransporting polypeptide
- MDCK
- Madin-Darby canine kidney
- MPP
- 1-methyl-4-phenylpyridinium
- CCK-8
- cholecystokinin octapeptide
- PAPS
- 3′-phosphoadenosine-5′-phosphosulfate
- MDR1
- multidrug-resistant protein 1
- HPLC
- high-performance liquid chromatography
- FRT
- Flp recombination target
- PCR
- polymerase chain reaction
- RQ
- relative quantification
- BSP
- bromosulfophthalein
- PAH
- p-aminohippurate
- HBSS
- Hank's balanced salt solution
- Pc
- permeability coefficient
- GF-120918
- N-(4-[2-(1,2,3,4-tetrahydro-6,7-dimethoxy-2-isoquinolinyl)ethyl]-phenyl)-9,10-dihydro-5-methoxy-9-oxo-4-acridine carboxamide
- DHEAS
- dehydroepiandrosterone-3-sulfate
- OST
- organic-solute transporter.
- Received December 2, 2009.
- Accepted April 1, 2010.
- Copyright © 2010 by The American Society for Pharmacology and Experimental Therapeutics


