


Abstract
Substrates for glucuronidation include endogenous and xenobiotic compounds such as environmental carcinogens and drugs, as well as the chemotherapeutic agent irinotecan. The UDP-glucuronosyltransferase (UGT) 1A7 gene is expressed in the upper gastrointestinal tract and the lung but is not expressed in the liver. The transcriptional regulation of UGT1A7 and the putative influence of single nucleotide polymorphisms (SNPs) are incompletely characterized. UGT1A8, UGT1A9, and UGT1A10, which are highly homologous to UGT1A7, have been reported to be transcriptionally regulated by hepatocyte nuclear factors (HNFs). In this study, we show the activation of UGT1A7 by the aforementioned transcription factors. Sequence analyses, mutagenesis, reporter gene experiments, small interfering RNA silencing, chromatin immunoprecipitation, and electromobility shift assays identified five HNF binding sites in the proximal promoter region of UGT1A7 that were regulated by HNF1α and HNF4α. Activation by HNF1α was lower in the presence of the UGT1A7 −57G SNP. In contrast to liver-expressed UGT1A9, transcriptional activation of UGT1A7 by HNF4α was lower and dependent on higher HNF4α concentrations, which may contribute to the observed differences in tissue expression patterns. Therefore, a specific role of HNF in the transcriptional control of UGT1A7 is shown and characterized, which may contribute to its tissue specificity and function.
The elimination of a broad array of endogenous and exogenous substances from the body is performed by glucuronidation, which is catalyzed by UDP-glucuronosyltransferases (UGTs). Endobiotics such as bilirubin, steroids, and hormones are substrates for glucuronidation together with exogenous compounds, which include dietary constituents, drugs, and environmental carcinogens. Several UGT isoforms with different and partially overlapping substrate specificities ensure efficient metabolism of a considerable variety of substances (Fisher et al., 2001; Strassburg et al., 2008). For the UGT1A gene locus alone, at least eight coding UGT1A isoforms have been characterized. Their transcripts share common exons 2 to 5 in addition to individual first exons (Gong et al., 2001). Transcription has been shown to be regulated at individual promoter regions upstream of the first exons. Differential splicing subsequently leads to the generation of individual gene products. UGT1A transcript expression is regulated in a strictly tissue-specific fashion with interindividual variations of gene expression levels. To date, the underlying mechanisms governing tissue specificity and individual regulation of UGT1A genes are not completely understood.
Despite differences in their tissue expression profiles and substrate specificities, the UGT1A gene cluster that comprises UGT1A7, UGT1A8, UGT1A9, and UGT1A10 is characterized by high homology of first exon and promoter region DNA sequence. DNA sequence similarity ranges from 74.1 to 91.2% (Gong et al., 2001). Only UGT1A9 is expressed in the liver, whereas UGT1A7, UGT1A8, and UGT1A10 are expressed in the extrahepatic gastrointestinal tract. UGT1A7 exhibits glucuronidation activity toward various carcinogens (Bock et al., 1999; Strassburg et al., 1999) with a distinct tissue expression profile. UGT1A7 transcripts have been detected in orolaryngeal tissue, esophagus, pancreas, and stomach but not in liver or intestine (reviewed in Strassburg et al., 2008).
The regulation of UGT genes has been partly characterized, and several transcription factors and nuclear receptors have been identified that are capable of activating UGT1A transcription (Gregory et al., 2004b; Zhou et al., 2005; Erichsen et al., 2008). In this context, hepatocyte nuclear factors (HNFs) have been shown to play an important role for the activation of several UGT1A isoforms (Usui et al., 2006; Gardner-Stephen and Mackenzie, 2007b). By interacting with other transcription factors, they appear to contribute to the tissue-specific expression of UGT1A genes. Although HNFs were first described in the liver, they are expressed in a variety of extrahepatic tissues (Sladek et al., 1990; Xanthopoulos et al., 1991). Depending on the cellular background, HNF1α and HNF4α are capable of binding to promoter elements of different genes (Odom et al., 2004). Together with other transcription factors (such as HNF6, small heterodimeric partner, or liver X receptor), they are believed to be part of a complex regulatory network that controls the tissue-specific expression of an array of genes in the liver and the pancreas (Odom et al., 2004). A contribution of HNF1α and caudal-related homeodomain protein 2 to intestinal expression of UGT1A8 and UGT1A10 was reported previously (Gregory et al., 2004a). Recent data also indicate that HNF1α and HNF4α are involved in the expression of the hepatic isoform UGT1A9 (Barbier et al., 2005; Gardner-Stephen and Mackenzie, 2007a). To date, human UGT1A7 is the only member of the UGT1A7-UGT1A10 gene cluster that has not been characterized as an HNF1α target gene, with the exception of data on the activation of rat Ugt1a7 by HNF1 (Metz et al., 2000). However, in contrast to the human homolog, rat Ugt1a7 is expressed in the liver, suggesting an involvement of regulatory elements that are potentially different from those in humans.
A previously identified HNF1 binding element for UGT1A8 and UGT1A10 differs with respect to a single base pair (bp) from that of UGT1A9 but is identical to a putative HNF1 motif in the corresponding region of the UGT1A7 promoter (Gardner-Stephen and Mackenzie, 2007a). Although the involvement of HNF in the regulation of the human UGT1A7 gene has not been described, sequence comparison makes activation by HNF1α very likely. Furthermore, sequences of HNF4α binding elements in the UGT1A9 promoter region are highly similar to the corresponding regions in UGT1A7. Therefore, in our study we sought to analyze and characterize a potential activation of the human UGT1A7 gene by HNF1α and HNF4α. In addition, the effects of a common functional single nucleotide polymorphism (SNP) variant (UGT1A7 −57T>G) present in more than 30% of the population (Lankisch et al., 2005) were analyzed. This result is of relevance for the further elucidation of tissue-specific UGT1A gene regulation, its genetic modulation, and for the identification of relevant transcription factors, and their interacting partners, which may be important for the understanding of the variability of human glucuronidation.
Materials and Methods
Cell Culture and Transfection.
Hepatoma (HepG2), colon carcinoma (Caco2), esophagus carcinoma (KYSE70), and human embryonic kidney (HEK)-293 cells were grown in RPMI 1640 medium (HepG2 and KYSE70) or Dulbecco's modified Eagle's medium with nonessential amino acids (Caco2 and HEK-293) supplemented with 10% fetal bovine serum. Transfection experiments were performed using Lipofectin (Invitrogen, Karlsruhe, Germany) for mRNA induction and luciferase reporter gene assays and Lipofectamine 2000 (Invitrogen) for small interfering RNA (siRNA) transfection according to the manufacturer's instructions.
RNA Isolation and Reverse Transcription-Polymerase Chain Reaction.
Total RNA was isolated from cells using TRIzol reagent (Invitrogen). cDNA was generated from 5 μg of total RNA in an oligo(dT)-primed Superscript III reverse transcriptase reaction according to the manufacturer's instructions (Invitrogen).
HNF Expression Plasmids.
HNF4α constructs were amplified from cDNA from HepG2 cells as described above (primers are listed in Table 1). Polymerase chain reaction (PCR) fragments were cloned into pcDNA3.1. The HNF4α coding region was sequenced to verify the presence of the reference (“wild-type”) variant of HNF4α because HepG2 cells are known to be heterozygous for a single bp change at nucleotide 206 of HNF4α, which results in a D69A mutation (Lausen et al., 2000). The wild-type clones for splice variants HNF4α1, HNF4α2 (the most abundant transcript in adult human liver), and HNF4α7 were chosen for transfection experiments. The HNF1α expression vector has been described previously (Lankisch et al., 2008a). DNA concentrations were determined by spectrophotometry at 260 nm.
Primers for cloning of HNF4α expression plasmids and UGT1A promoter constructs
Quantitative Real-Time PCR.
By TaqMan (ABI Prism 7000 sequence detection system; Applied Biosystems, Darmstadt, Germany) 0.2 μg of cDNA were analyzed using UGT1A isoform-specific primers and probes (Table 2). Cycle threshold values were normalized against β-actin (forward, 5′-TGC CGACAG GAT GCA GAA G-3′; reverse, 5′-GCC GAT CCA CAC GGA GTA CT-3′; probe, 5′-FAM-AGA TCA AGA TCA TTG CTC CTC CTG AGC GC-TAMRA-3′).
Primers and probes for quantitative real-time PCR
Generation of Promoter Constructs.
UGT1A7 5′-upstream region fragments of different length [103, 137, 150, 200, 250, and 530 bp] were amplified by PCR from two healthy blood donors exhibiting the −57G or the −57T variant, respectively (Lankisch et al., 2005). A 530-bp UGT1A9 5′-upstream region fragment was amplified from genomic DNA (all the primers are listed in Table 1). Directional insertion into the pGL3 basic vector (Promega, Mannheim, Germany) was performed using XhoI- and NheI-cut PCR fragments and T4-Ligase (New England Biolabs GmbH, Frankfurt am Main, Germany). Mutagenesis of putative HNF binding sites was performed by primer extension using primers specified in Table 3. All the constructs were sequenced in full using the Dye Terminator Cycle Sequencing Kit 1.1 (Applied Biosystems) and the ABI 310 automated sequencer (Applied Biosystems).
Primers for mutagenesis of UGT1A7 promoter constructs
Luciferase Assays.
HepG2, Caco2, and KYSE70 cells were seeded in 12-well plates and transfected with the constructed pGL3-UGT1A7 and pGL3-UGT1A9 vectors in addition to the pRL-TK plasmid to perform a dual-luciferase assay (Dual-Reporter Assay; Promega). pGL3 constructs and HNF expression plasmids/empty vector (pcDNA3.1) were cotransfected at a concentration of 800 ng/well if not stated otherwise. Transfection experiments were performed using Lipofectin (Invitrogen) except for luciferase assays with cotransfection of siRNA (described below), where Lipofectamine 2000 (Invitrogen) was used according to the manufacturer's protocol for cotransfection of RNA and DNA. All the experiments were performed in triplicate in at least two to six independent experiments. Results were analyzed using Microsoft (Redmond, WA) Excel software. Luciferase activity was calculated relative to empty pGL3 vector (basic) and, unless stated otherwise, is reported as fold activation. Error bars represent S.D. Statistical analysis was performed using Student's t test for comparisons between groups. Differences were considered significant when p values were less than 0.05.
Electrophoretic Mobility Shift Assays.
Nonradioactive electrophoretic mobility shift assay (EMSA) was performed using the LightShift Chemiluminescent EMSA Kit (Pierce, Rockford, IL). Nuclear extracts were prepared from HepG2 cells as described elsewhere (Strassburg et al., 1998; Yueh et al., 2001). Nuclear extracts (1–5 μg of protein) were incubated for 30 min at room temperature with biotinylated oligonucleotides containing the binding sites listed in Table 4. For the determination of binding specificity, 50- to 400-fold excess of unlabeled double-stranded oligonucleotide was incubated with nuclear extracts for 25 min before the addition of biotinylated oligonucleotides. The samples were electrophoretically separated (17 V/cm, 2–2.5 h) by 6% polyacrylamide gel electrophoresis and blotted (300 mA, 45 min) on a Biodyne B (0.45 μm) nylon membrane (Pall Corporation, East Hills, NY). Chemiluminescence was visualized on X-ray film. EMSA supershift assays were performed by a 3-h incubation on ice with 1.2 μg of anti-HNF1α antibody (Active Motif, Rixensart, Belgium) or 2 μg of anti-HNF4α antibody (sc-6556X; Santa Cruz Biotechnology, Inc., Santa Cruz, CA) before addition of labeled oligonucleotides.
Oligonucleotide sequences used for EMSA
Chromatin Immunoprecipitation.
Chromatin immunoprecipitation (ChIP) was performed using the ChIP Assay Kit from USB (Stauffen, Germany) according to the manufacturer's instructions. Chromatin samples derived from nuclear extracts of KYSE70 cells were sonicated for 27 cycles, 30 s each. Immunoprecipitation was performed with 2 μg of anti-HNF1α antibody or anti-HNF4α (see above). An anti-UGT1A1 antibody (Santa Cruz Biotechnology, Inc.) was used as negative control. UGT1A7 promoter sequences were amplified by PCR using specific primers for an upstream and downstream portion of the 5′-upstream region of UGT1A7 (forward, 5′-AAG CAG GTA TCT CAG CAA AGG-3′; reverse, 5′-AGA ACC TGC CCT CAA AAG AA-3′; forward, 5′-AGC TTC GTT CAA ATT TAC TTT CCT-3′; reverse, 5′-ATG CCC TGT GCT GCA ATA-3′).
Western Blot.
Total cell lysates from HepG2 and Caco2 cells were generated by resuspension of cells in phosphate-buffered saline followed by three freeze-thaw cycles using liquid nitrogen. For Western blot analyses, 100 to 150 μg of total cell protein/lane was separated by 8% SDS-polyacrylamide gel electrophoresis and transferred onto nitrocellulose membranes. Blocking was performed in either 10% dry milk (for anti-HNF1α) or 10% bovine serum albumin (for anti-HNF4α) and stained with specific primary antibodies in 2% dry milk (anti-HNF1α, sc-6548X) or phosphate-buffered saline/Tris (anti-HNF4α, sc-6556X). After incubation with appropriate secondary antibodies (Millipore, Schwalbach, Germany), protein was visualized by chemiluminescence (Pierce) on X-ray film. Staining with β-actin antibody (sc-69879) was used as loading control. All the primary antibodies were purchased from Santa Cruz Biotechnology, Inc.
siRNA-Mediated Knockdown of HNF1α and HNF4α.
Synthetic siRNA (MWG Biotech, Ebersberg, Germany) against HNF4α (aac cta gag att gtt aca gaa), HNF1α (cag gac aag cat ggt ccc aca), or nonsilencing control (aat tct ccg aac gtg tca cgt) was transfected into HepG2 and Caco2 cells seeded in six-well plates using Lipofectamine 2000 (Invitrogen) according to the manufacturer's instructions. Knockdown efficiency was determined by quantitative Western blot analysis (see above).
Results
UGT1A7 mRNA Is Inducible by HNF1α and HNF4α.
The UGT1A7 gene belongs to the highly homologous UGT1A7, UGT1A8, UGT1A9, and UGT1A10 gene cluster. Activation by HNF1α has been shown for all the genes of this cluster with the exception of UGT1A7 (Gregory et al., 2004a), and activation of UGT1A9 by HNF4α was reported (Barbier et al., 2005; Gardner-Stephen and Mackenzie, 2007a). It is believed that HNF4α contributes to the unique expression pattern of UGT1A9, which is the only UGT of the UGT1A7-UGT1A10 gene cluster expressed in the liver (Aueviriyavit et al., 2007; Gardner-Stephen and Mackenzie, 2007a). To test activation of the carcinogen-detoxifying UGT1A7, we chose the human esophageal cell line KYSE70, which—in contrast to colon-derived Caco2 and hepatoma-derived HepG2 cells—exhibits constitutive expression of UGT1A7. Transfection of an HNF1α or HNF4α2 expression plasmid was able to activate expression of UGT1A7 mRNA by 2.9- and 2.6-fold, respectively (Fig. 1A). Activation of UGT1A8, UGT1A9, and UGT1A10 was also detectable in KYSE70 cells, but levels were very low (data not shown) and therefore were not further analyzed. In summary, these data suggest a previously undescribed activation of human UGT1A7 by HNF1α and HNF4α.

A, relative UGT1A7 mRNA expression in KYSE70 cells 48 h after transfection with HNF1α or HNF4α2 expression plasmid compared with an empty pcDNA3.1 vector as control (basic). Cotransfection of a 530-bp reporter gene construct of the UGT1A7 promoter region with HNF expression plasmids in different cell lines (Caco2, HepG2, and KYSE70). B, bars represent fold activation over relative luciferase activity of reporter gene constructs cotransfected with control plasmid (pcDNA3.1). C, activation of the UGT1A7 promoter by different HNF4α isoforms in HepG2 cells in luciferase reporter gene assays.
Activation of the UGT1A7 5′-Upstream Region by HNF1α and HNF4α in Different Cell Lines.
A construct consisting of a 530-bp portion of the UGT1A7 5′-upstream region was cloned and used in reporter gene analyses in KYSE70, HepG2, and Caco2 cells. In all the cell lines, up-regulation of the UGT1A7 construct by HNF1α was observed, and the highest activation was detected in Caco2 cells (4.7-fold) (Fig. 1B). By comparison, the activation by HNF4α2 was slightly lower and was only observed in HepG2 cells (4.4-fold) (Fig. 1B). Additional experiments were performed in HEK-293 cells, which lack endogenous expression of HNF1α and HNF4α. Whereas 6.5-fold activation was achieved by cotransfection of HNF1α, no significant activation was observed by HNF4α (Fig. 1B). This lack of activation of the UGT1A7 construct in Caco2, KYSE70, and HEK-293 cells is most likely attributable to additional transcription factors required for HNF4-mediated promoter activation, which are only present in HepG2 cells. Other factors that may contribute to the observed results include variations in transfection efficiency, as well as cell line-dependent variation in protein expression of the transfected HNF constructs.
Further in-depth analysis of UGT1A7 activation by HNF4α revealed that in contrast to other isoforms of this gene (HNF4α1 and HNF4α7), only HNF4α2 led to a significant activation of the UGT1A7 construct (Fig. 1C). Whereas high amounts of HNF4α7 can be found in the developing liver, the expression of this isoform is almost undetectable in adult hepatocytes. In contrast, HNF4α1 and HNF4α2 are up-regulated after birth. Both isoforms are transcribed from the same promoter but exhibit different C termini generated by alternative splicing (Torres-Padilla et al., 2001). Because HNF4α2 represents the predominant HNF4α isoform in adult liver (Hata et al., 1995; Torres-Padilla et al., 2001), all further experiments were carried out using the HNF4α2 expression plasmid. For further reporter gene experiments, Caco2 cells were chosen for HNF1α activation, and HepG2 cells were chosen for HNF4α activation.
Concentration-Dependent Activation of UGT1A7 and UGT1A9.
Activation using UGT1A7 5′-upstream DNA sequence was found to be concentration-dependent, as shown by transfection with different quantities of HNF1α or HNF4α2 expression vectors. The maximal activation of the UGT1A7 construct by HNF1α (7.6-fold) was remarkably higher than activation observed with the UGT1A9 5′-upstream region (2.3-fold) (Fig. 2A). An inverse pattern was observed for HNF4α, where UGT1A9 activation reached 13.3-fold compared with 5.2-fold activation of UGT1A7 (Fig. 2B). Although lower concentrations of HNF4α expression plasmid were required to activate UGT1A9 transcription, the relatively small difference between UGT1A7 activation and UGT1A9 activation by HNF4α is unlikely to explain hepatic tissue specificity of UGT1A9 solely based on this transcription factor. With all the HNF4α concentrations tested, luciferase signals of the UGT1A9 construct were only 2- to 4-fold higher than those found with UGT1A7.
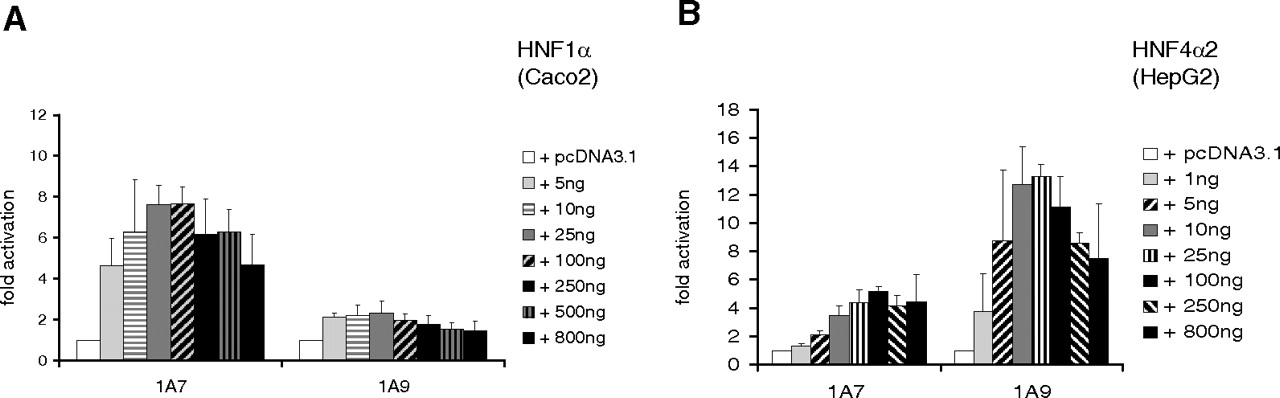
Concentration-dependent activation of UGT1A7 and UGT1A9 promoter constructs with cotransfection of HNF1α (Caco2 cells) and HNF4α (HepG2 cells) expression plasmids. Cotransfection of 530-bp constructs of the UGT1A7 or UGT1A9 promoter with different amounts of HNF1α (A) or HNF4α2 (B) expression plasmids, respectively.
Activation by HNF1α Is Altered by the Common UGT1A7 Promoter Variant −57T>G.
To investigate whether genetic variability affects HNF1α- and HNF4α2-dependent gene regulation, activation levels of a UGT1A7 −57T construct were compared with a construct of the −57G variant. This promoter variant occurs at high frequencies in white and Asian populations and has been associated with a 70% reduction of promoter transcriptional activity (Lankisch et al., 2005; Thomas et al., 2006). On cotransfection of HNF1α, fold activation and relative luciferase activity were significantly lower in the presence of the −57G SNP (Fig. 3, A and B). For HNF4α, fold activation was significantly lower for the −57G variant (Fig. 3C), although absolute activation levels were not significantly different because of a higher basal reporter activity of the UGT1A7 −57G 530-bp construct (Fig. 3D). This elevated basal reported activity was only observed in HepG2 but not in Caco2 or KYSE70 cells (Fig. 3B and data not shown). In summary, our findings show a relevance of genetic variation on HNF1α-mediated gene regulation of the UGT1A7 gene.
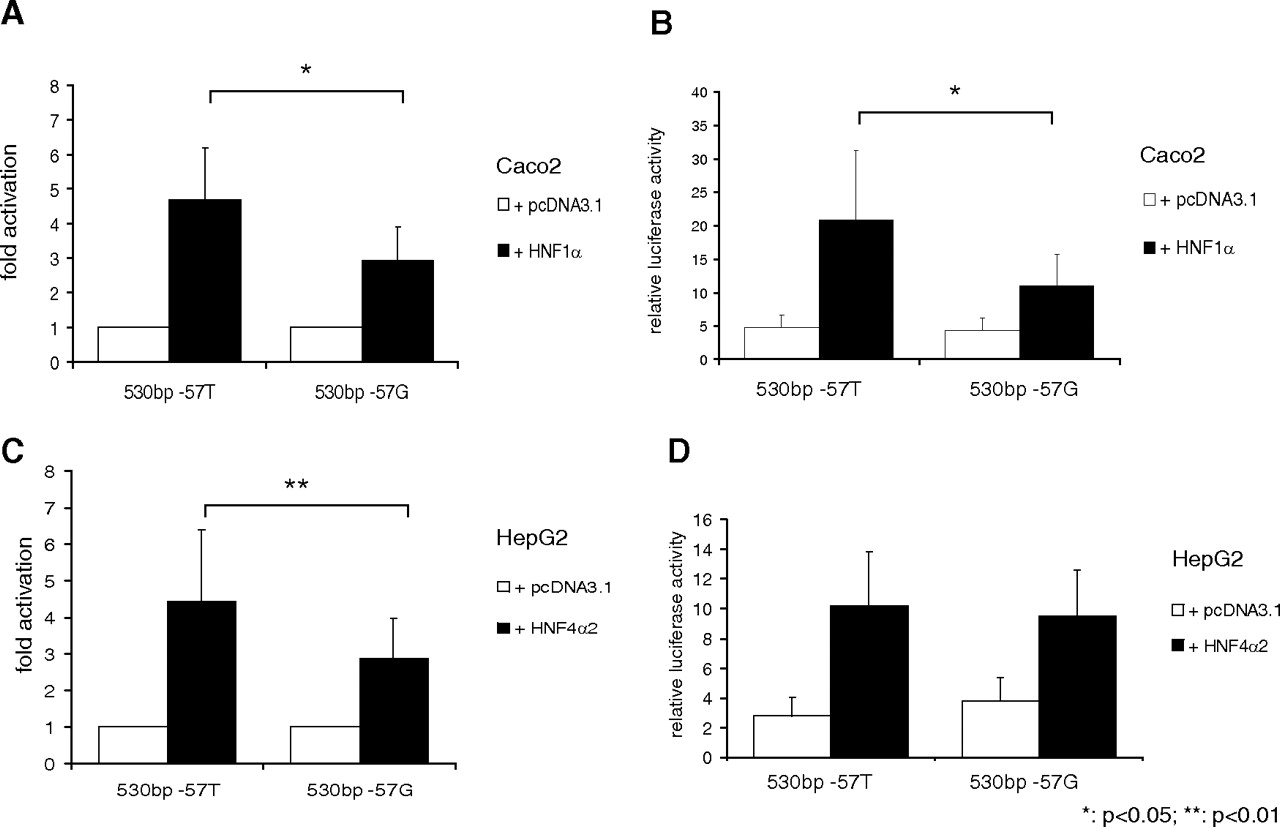
Differential activation of the UGT1A7 −57G variant compared with wild-type with cotransfection of HNF expression plasmids. Fold activation (A and C) and relative luciferase activity (B and D) of 530-bp constructs of variants of the UGT1A7 promoter region (−57T, −57G) after cotransfection with HNF1α in Caco2 (A and B) or HNF4α in HepG2 cells (C and D), respectively.
Identification of HNF1α and HNF4α Binding Sites.
Binding sites for HNF1α and HNF4α in the UGT1A7 5′-upstream region are summarized in Fig. 4A.

A, illustration displaying HNF binding sites identified in the UGT1A7 5′-upstream region, drawn to scale. Cotransfection of UGT1A7 promoter constructs of different lengths with HNF1α expression plasmid in Caco2 cells. B, the 137- and 103-bp constructs are lacking the first or the first and second HNF1 binding element, respectively. Comparison of UGT1A7 HNF binding sites with the homologous binding regions of UGT1A9. Bases differing from consensus sequence are underlined. The consensus binding site of HNF1 is from the promoter of α-fetoprotein, whereas that of HNF4α is a direct repeat element of AGGTCA, a common recognition sequence in nuclear receptors (reviewed in Gonzalez, 2008). C, the mutated sequences used for analysis in luciferase assays are depicted below, and bases differing from the reference UGT1A7 sequence are underlined.
HNF1α.
To identify putative binding elements for the transcription factor HNF1α, UGT1A7 fragments of different lengths were analyzed. Compared with a 150-bp 5′-upstream region construct, no significant activation of the UGT1A7 promoter was observed when constructs of 100 or 137 bp upstream of the ATG codon were used. This finding suggests the presence of one or more relevant HNF1α binding element(s) in this region (Fig. 4, A and B). A comparison of the UGT1A7 sequence with the HNF1 consensus binding sequence (GTTAATnATTGGC, from the α-fetoprotein promoter) and with the published binding sequences of the highly homologous UGT1A8, UGT1A9, and UGT1A10 genes revealed two putative HNF1 motifs at bp −151 to −139 (site 1) and bp −115 to −103 (site 2). The bp −115 to −103 sequence is not present in the 5′-upstream region of other UGT1A isoforms of this gene cluster. Binding sequences differed from the published consensus sequence (Fig. 4C) at 1 bp (site 1) or 6 bp (site 2). An additional binding site described for the UGT1A9 5′-upstream region between bp −290 and −278 was also identified in a homologous region of UGT1A7 (site 3; bp −286 to −275).
To assess the contribution of each putative binding site to HNF1α-mediated activation, luciferase reporter gene assays with mutagenized binding regions were performed. Mutagenesis of site 1 completely abolished activation, whereas mutagenesis of sites 2 or 3 only reduced activation by approximately 50 or 44%, respectively. Mutagenesis of both sites 2 and 3 further reduced activation by 59% but did not completely abolish activation (Fig. 5A). The reduction achieved by mutation of HNF1α binding sites was slightly lower for the −57G variant. This reduction did not reach significance for site 2 alone (data not shown). Mutagenesis of binding site 1 alone or in combination with site 2 and/or 3 decreased luciferase activity on cotransfection of HNF1α. This effect could possibly be explained by other transcription factors induced by HNF1α overexpression, which may then act as transcriptional repressors of the UGT1A7 promoter. In the presence of HNF1α binding site 1, their effect appears to be negligible as shown by functional activation of the UGT1A7 promoter by HNF1α. No significant alteration of basal luciferase activity with the mutagenized constructs was observed when transfection proceeded with control vector (data not shown).
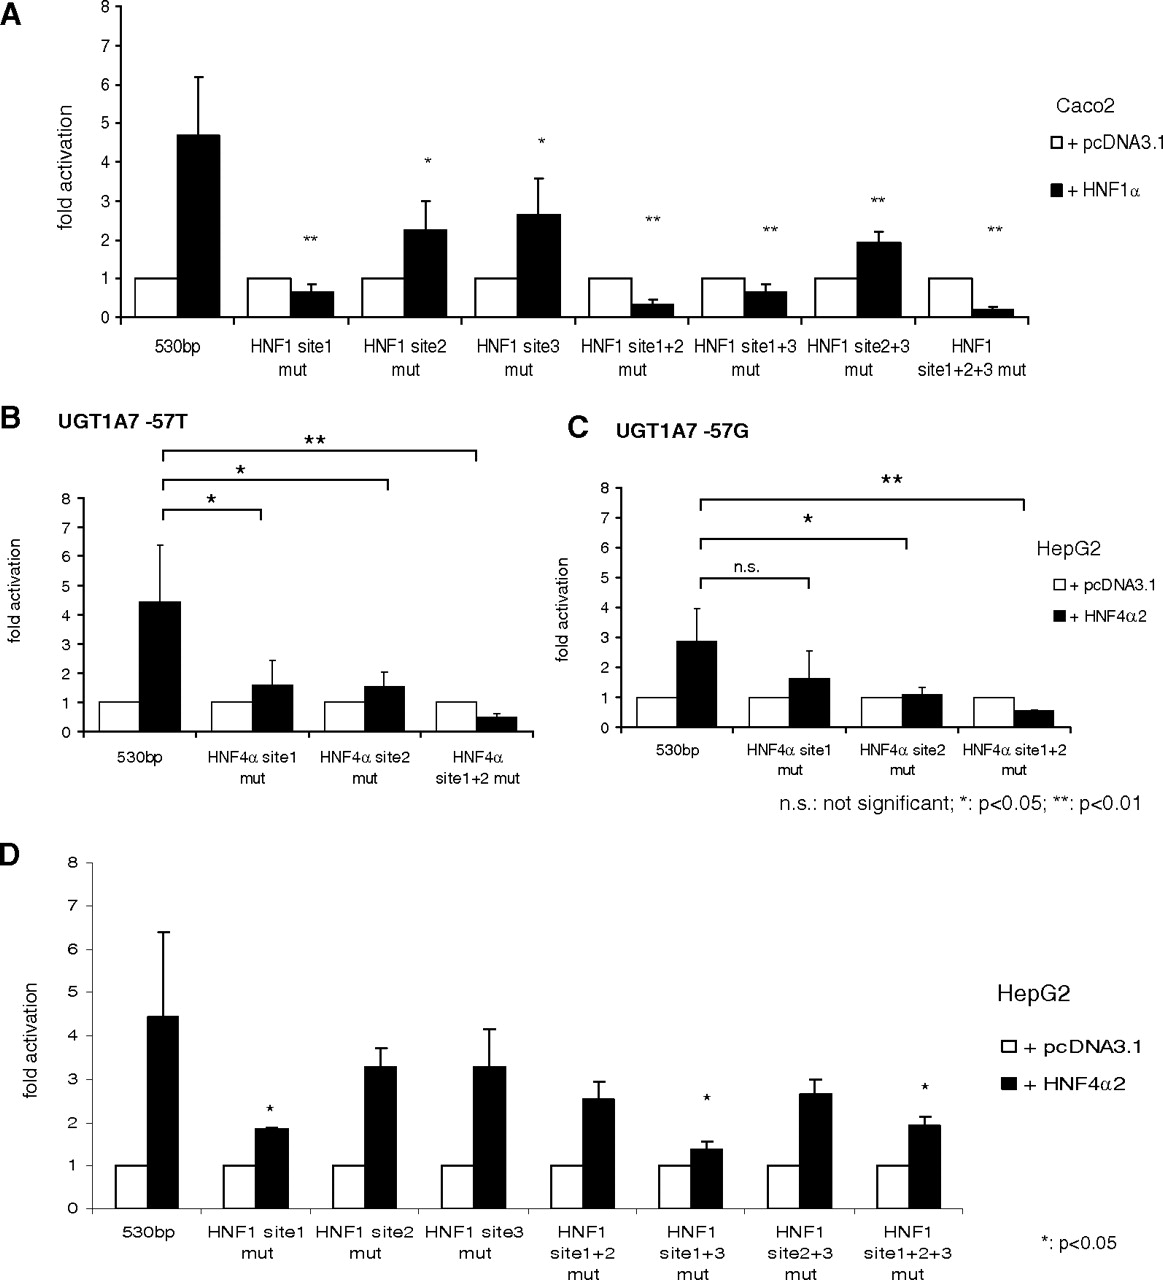
Luciferase assays in Caco2 (activation by HNF1α) and HepG2 cells (activation by HNF4α2) with mutagenized UGT1A7 promoter constructs. A, the 530-bp fragments of the UGT1A7 5′-upstream region with mutations of HNF1 binding site 1 (−151 to −139 bp), binding site 2 (−115 to −103 bp), binding site 3 (−286 to −275 bp), or combinations of mutated binding sites were cotransfected with control (pcDNA 3.1) or HNF1α expression plasmid. B and C, UGT1A7 promoter constructs of the −57T and −57G variant with mutagenized HNF4α binding site 1 and/or binding site 2 were cotransfected with HNF4α2 expression plasmid or empty control vector (pcDNA3.1). D, activation of UGT1A7 reporter gene constructs with mutated HNF1 binding sites by HNF4α2 in HepG2 cells.
In summary, our data indicate that activation of the UGT1A7 5′-upstream region by HNF1α mostly depends on binding site 1. Although sites 2 and 3 are not able to drive HNF1α-mediated activation in the absence of binding site 1, they significantly contribute to the activation of the UGT1A7 promoter construct in the presence of HNF1α binding site 1, which was shown by reduced activation after mutagenesis of the respective sites.
HNF4α.
To identify putative HNF4α motifs, the sequence of the UGT1A7 5′-upstream region was compared with that of the UGT1A9 gene, in which two HNF4α binding elements were described previously (Gardner-Stephen and Mackenzie, 2007a). The sequence of UGT1A7 differed from UGT1A9 at 1 (site 1) or 2 (site 2) bp (Fig. 4C). These putative binding elements in the UGT1A7 5′-upstream region were subject to further analyses. Reporter gene assays of the UGT1A7 −57T variant showed that HNF4α2-dependent activation was reduced by mutagenesis of the putative binding sites. After the mutagenesis of both sites, activation was completely abolished (Fig. 5B). The mutagenesis of site 1 was sufficient to significantly reduce activation in the presence of the wild-type UGT1A7 −57T construct (Fig. 5B). This was not significant using the UGT1A7 −57G construct (Fig. 5C), presumably because of the lower overall activation observed with the SNP variant.
Therefore, we conclude from these experiments that the same sites responsible for HNF4α-mediated activation of the UGT1A9 gene are also present in the UGT1A7 5′-upstream region. In the presence of the −57G SNP variant, only mutagenesis of HNF4α binding site 2 or both binding sites (but not binding site 1 alone) was sufficient to significantly reduce activation (Fig. 5C).
Activation by HNF4 Is Reduced by Mutagenesis of HNF1α Binding Site 1.
A HNF1α binding motif of the UGT1A9 5′-upstream region located between bp −290 and −278, which did not significantly contribute to HNF1α-mediated up-regulation of UGT1A9 reporter gene constructs, was found to be relevant for HNF4α activation (Gardner-Stephen and Mackenzie, 2007a). Therefore, we investigated the role of the homologous site in the UGT1A7 5′-upstream region (site 3) for HNF4α-mediated activation of UGT1A7. In contrast to UGT1A9, mutagenesis of the homologous site of the UGT1A7 gene did not lead to a significant alteration of HNF4α-mediated activation. Remarkably, analysis of the remaining HNF1α binding sites revealed a contribution of HNF1α site 1 (bp −151 to −139) to HNF4α activation. By mutagenesis of this site, the HNF4α-mediated transcriptional activation was significantly reduced by 59% (Fig. 5D). A significantly reduced activation was also observed with combined mutagenesis of HNF1 sites 1 and 3, as well as with mutagenesis of all three binding sites. However, the reduction observed after mutagenesis of binding sites 1 and 2 did not reach significance. Mutagenesis of other HNF1 binding sites (site 2 and/or 3) did not alter activation of the UGT1A7 promoter by HNF4α.
An influence of HNF4α on HNF1 binding site 1 as observed for UGT1A7 has not been described for the homologous site of the UGT1A9 gene. Although the underlying molecular mechanism for the relevance of this binding site regarding both HNF1α- and HNF4α-mediated activation has yet to be elucidated, the principle of shared regulation by different HNFs appears to be conserved in at least two UGT1A genes (UGT1A7 and UGT1A9). For UGT1A7, the HNF1α motif that is capable of altering HNF4α activation also appeared to contribute to HNF1α activation to a considerable extent. These findings differ from those of UGT1A9, where the corresponding HNF1α motif is of less relevance for HNF1α-mediated activation (Gardner-Stephen and Mackenzie, 2007a).
We then extended our studies to the investigation of a possible effect of HNF4α motifs on HNF1α activation. Mutagenesis of any of the identified HNF4α sites did not exert an observable effect in cotransfections with the HNF1α expression plasmid compared with the native promoter construct (data not shown). Binding sites for HNF in the UGT1A7 5′-upstream region are summarized in Fig. 4A.
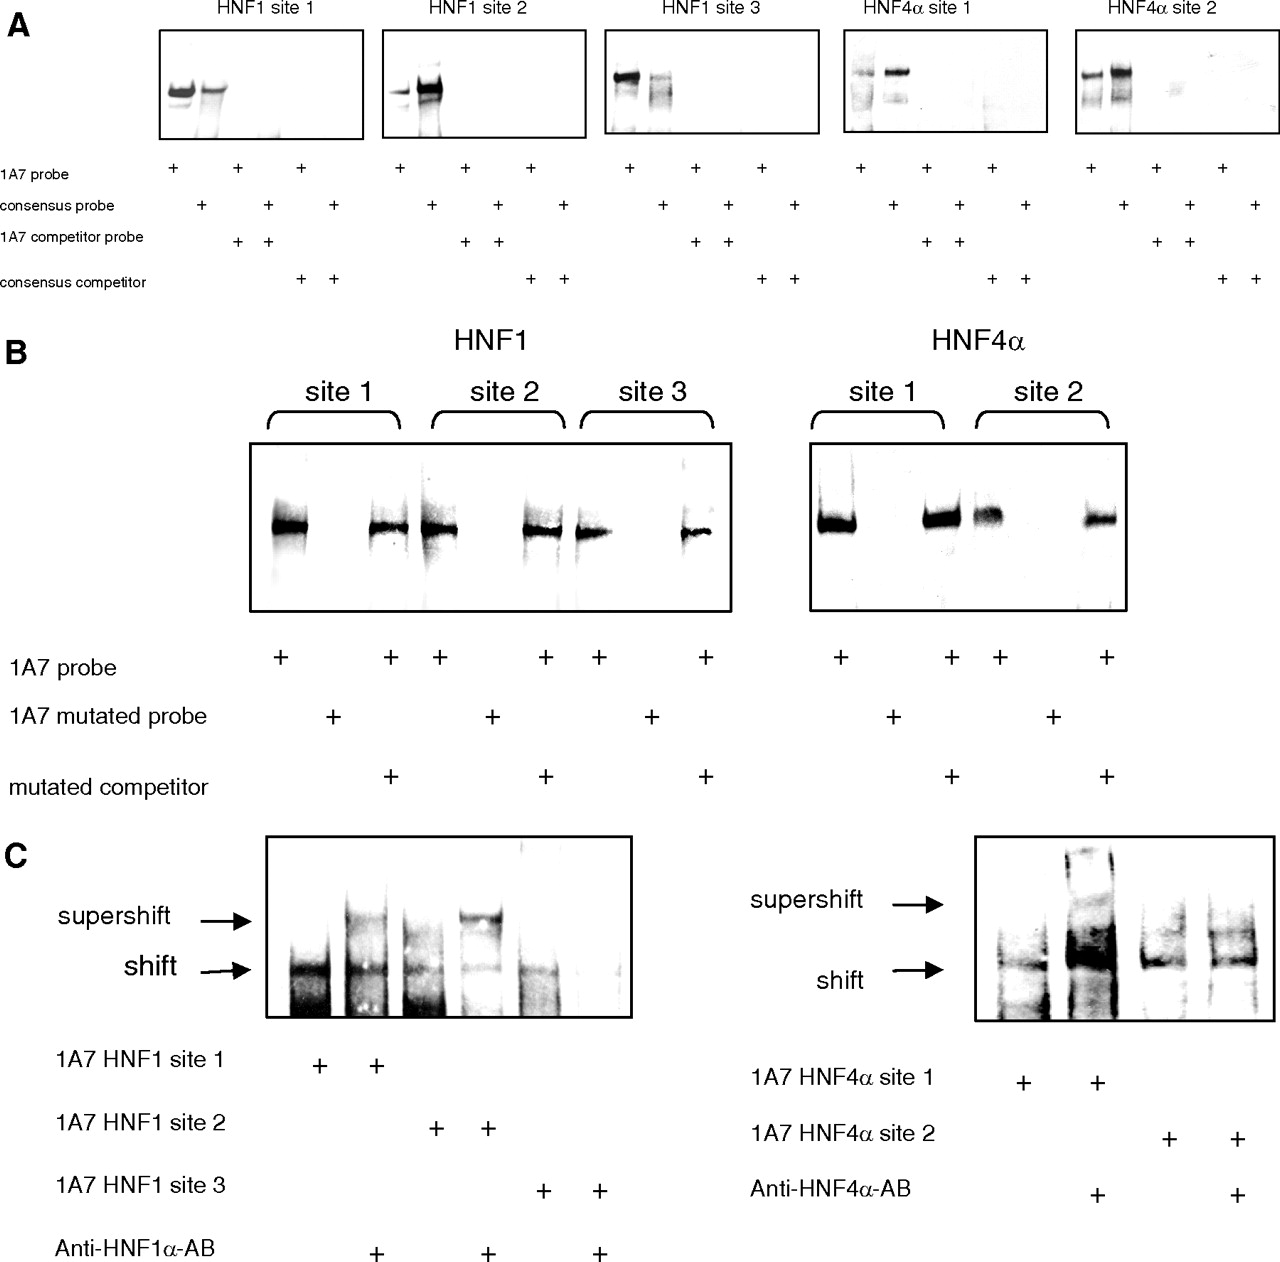
Binding of HNF1α and HNF4α to UGT1A7 Binding Sites Confirmed by EMSA and ChIP.
The physical interaction of HNF with the identified UGT1A7 binding motifs was studied by EMSA (Fig. 6). Gel shift bands were observed both with a consensus HNF and the UGT1A7 HNF motifs (Fig. 6A) but not with the mutagenized binding sequences (Fig. 6B). An addition of unlabeled HNF consensus sequence oligonucleotide was able to compete with the shifts of UGT1A7 binding site-specific oligonucleotides, and vice versa. Furthermore, anti-HNF1α and anti-HNF4α antibodies were used to identify HNF1α/HNF4α binding to the UGT1A7 HNF motifs (Fig. 6C). With anti-HNF1α antibody a supershift was observed for binding sites 1 and 2. For HNF1 binding site 3, only an attenuation of the shifted complex and no supershifted band were observed. This may be because of a disruption of the DNA protein interaction by the HNF1α antibody. In contrast, the anti-HNF4α antibody led to a supershift with the binding site 1 oligonucleotide only. This antibody was also not capable of producing a supershift with the UGT1A9 site 1 (data not shown), to which binding of HNF4α was previously reported albeit under different experimental conditions (Gardner-Stephen and Mackenzie, 2007a). Therefore, we assumed that antibody binding is too weak to produce a supershift in all cases. However, when the results obtained from mutagenesis and reporter gene experiments, as well as the successful competition by consensus HNF4α binding site, are considered, HNF4α binding site 2 is shown to participate in HNF4α-mediated activation of UGT1A7. Supershift experiments appear to suggest a slightly weaker binding of HNF4α to site 2 than to site 1.

EMSA for HNF1 and HNF4α binding elements. For each panel, shifts of labeled oligonucleotides (probes) containing the UGT1A7 promoter binding elements (lane 1) are shown compared with published consensus sequences (lane 2) and competed by excess unlabeled oligonucleotides (competitor). Competition of protein binding to the UGT1A7 HNF binding elements with unlabeled oligonucleotides of the same sequence (control, lane 3) and unlabeled oligonucleotides of the consensus sequence (lane 5). A, binding of labeled consensus oligonucleotides (probe) was competed by unlabeled UGT1A7 sequence (lane 4) or unlabeled consensus oligonucleotides (lane 6). B, gel shift and competition experiments with oligonucleotides containing mutated HNF binding sites. C, supershift of labeled UGT1A7 oligonucleotides with the addition of specific antibody for HNF1α and HNF4α.
Because HNF1 site 1 was shown to be essential for HNF4α activation of the UGT1A7 promoter construct, we investigated whether binding of HNF4α to this site was demonstrable. Indeed, an EMSA shift of HNF1 binding site 1 could compete with the addition of excess unlabeled oligonucleotides containing the HNF4α consensus sequence. In addition, the unlabeled HNF1 site 1 sequence was able to inhibit the HNF4α consensus shift (Fig. 7A). To further characterize the HNF4α binding to this site, we performed supershift experiments, which then showed that in addition to HNF1α, HNF4α binds to the UGT1A7 HNF binding site 1 (Fig. 7B). As a confirmatory experiment, binding of HNF1α and HNF4α to the promoter of UGT1A7 was confirmed by ChIP of chromatin extracts derived from KYSE70 cells, which constitutively express UGT1A7 mRNA (Fig. 7C).

A, analysis of binding of HNF4α to the UGT1A7 HNF1 binding site 1 by EMSA. Shifts of HNF1 binding site 1 (lane 1) and HNF4α consensus sequence (lane 2) can compete with unlabeled oligonucleotides of the UGT1A7 HNF1 binding element (lanes 3 and 4) or unlabeled HNF4α consensus sequence (lanes 5 and 6). B, supershift experiments of UGT1A7 HNF1 binding site 1 with HNF1α (lane 2), HNF4α antibody (lane 3), or both antibodies (lane 4). C, ChIP of the UGT1A7 promoter region with HNF1α and HNF4α antibodies. Anti-UGT1A1 antibody was used as a negative control.
Dependence of UGT1A7 Activation on HNF1α and HNF4α.
To determine whether the activation of the UGT1A7 promoter construct depended on the presence of intracellular transcription factors, siRNA experiments with knockdown of either HNF1α or HNF4α protein were performed. Activation of the UGT1A7, as well as the UGT1A9 construct by HNF4α were slightly reduced by siRNA silencing of HNF1α, which did not reach significance (Fig. 8A). In contrast, HNF1α activation of UGT1A7 is significantly down-regulated by more than 30% when HNF4α is silenced by siRNA knockdown (Fig. 8B). This effect is not observed for UGT1A9. As a control, siRNA silencing of HNF1α and HNF4α protein was verified by Western blot analysis (Fig. 8, C and D). These results indicate that HNF4α participates in HNF1α-mediated activation of the UGT1A7 promoter but not the UGT1A9 promoter.

Luciferase assays of UGT1A7 and UGT1A9 promoter constructs cotransfected with HNF expression plasmid and HNF siRNA. A, transfection of HNF4α2 expression vector and HNF1α siRNA or control siRNA, respectively. B, in Caco2 cells, UGT1A reporter gene constructs were coexpressed with HNF1α expression plasmid and HNF4α siRNA or control siRNA. Western blot of HNF1α (C) and HNF4α (D) protein after transfection of HNF or control siRNA after 48 and 72 h in HepG2 and Caco2 cells.
Discussion
In our study, we provide a detailed analysis of the activation of UGT1A7 by HNF1α and HNF4α. UGT1A7 is expressed in a strictly tissue-specific fashion with transcripts found in orolaryngeal tissue, esophagus, stomach, and lung but not in the liver (Strassburg et al., 2008). UGT1A7 is of interest because of its ability to detoxify environmental carcinogens, such as hydroxylated benzo[a]pyrenes and N-hydroxy-2-amino-1-methyl-6-phenylimidazo[4,5-b]pyridine (Nowell et al., 1998; Bock et al., 1999; Strassburg et al., 1999). Low-activity variants of UGT1A7 have been linked to cancer (reviewed in Nagar and Remmel, 2006) and drug side effects (Lankisch et al., 2008b; Cecchin et al., 2009). An elucidation of the underlying molecular mechanisms for tissue-specific expression, transcriptional control, and interindividual variability is required to appreciate the potential impact of UGT1A7 on susceptibility to cancer and drug toxicity (Urquhart et al., 2007; Gardner-Stephen and Mackenzie, 2008). Moreover, the identification of transcription factors as possible targets for the activation of UGT1A enzymes may lead to tools capable of influencing their glucuronidation activity.
In this study, we show that UGT1A7 is regulated by HNF1α and HNF4α in cell culture and provide data that identify the responsible HNF binding motifs. We show a 2.9-fold up-regulation of UGT1A7 mRNA levels in KYSE70 cells by HNF1α, which is comparable with data from luciferase reporter gene assays in the same cell line. UGT1A7 mRNA was up-regulated by HNF4α in KYSE70 cells, whereas transcriptional activation of a UGT1A7 promoter construct in reporter gene assays was observed in HepG2 cells only. In addition to lower transfection efficiencies in the KYSE70 cells, which were measured by low basic luciferase and firefly luminescence compared with HepG2 or Caco2 cells, this discrepancy can likely be explained by a contribution of other intracellular factors, such as interacting transcription factors. It has recently been shown that binding of HNF transcription factors is tissue-specific (Odom et al., 2004; Tirona and Kim, 2005). In addition, alterations in the transcription factor expression profile in the tumor-derived cell lines used in this study compared with untransformed tissue can provide an explanation for the lack of HNF4α activation in KYSE70 cells.
UGT1A9 has been reported to be activated by HNF1α and HNF4α, and it has been speculated that both transcription factors contribute to the unique expression of this gene in the liver (Gregory et al., 2004a; Barbier et al., 2005; Gardner-Stephen and Mackenzie, 2007a). We were able to show activation of the extrahepatic UGT1A7 gene by these same transcription factors. Therefore, we sought to determine whether UGT1A7 and UGT1A9 exhibit differences in regulation by HNF. Cotransfections of promoter constructs with different amounts of HNF expression vectors were performed. Whereas UGT1A7 showed higher activation with the HNF1α construct compared with UGT1A9, HNF4α2 activation was approximately 50 to 75% lower for UGT1A7 than for UGT1A9, with the most striking difference observed at low HNF4α concentrations. Our data show a near complete lack of UGT1A7 activation with lower concentrations of HNF4α, whereas UGT1A9 is still activated more than 3.5-fold at an amount as low as 1 ng/well. This observation may in part explain the previously published data, which did not show HNF4α activation of UGT1A7 (Barbier et al., 2005; Gardner-Stephen and Mackenzie, 2007a). In both studies, lower concentrations of HNF4α expression plasmid were used. As mentioned above (Gardner-Stephen and Mackenzie, 2007a), differences in the HNF4α constructs, such as polymorphisms or the use of a different isoform other than HNF4α2, may have led to a lower activation of UGT1A9 in the study by Barbier et al., (2005). This possibility may also explain a lack of activation of a UGT1A7 600-bp construct by HNF4α (Barbier et al., 2005). However, despite the use of HNF4α2, which was sequenced in full to exclude polymorphisms, our data show an activation of UGT1A9 that is more similar to the data observed by Barbier et al. (2005) and not the 45-fold activation observed for a UGT1A9 2-kilobase pair promoter construct (Gardner-Stephen and Mackenzie, 2007a). Important factors that may account for the varying observations in reporter gene assays include the use of different expression vectors, as well as varying cell culture conditions and transfection procedures (Colosimo et al., 2000). This influence is corroborated by our own observation of a reduced activation of UGT1A7 by HNF1α on cotransfection of control siRNA and an altered transfection protocol in those experiments.
Low concentrations of transcription factor expression plasmids are more likely to reflect the actual intracellular level of HNF4α. This can be concluded from protein levels of cells transfected even with the highest amount of HNF4α. They by far exceed the protein levels of cultured cells and those of human liver tissue (Western blot data not shown). Therefore, although the respective UGT1A7 binding sites are responsive to HNF4α in principle, this may not reach biological relevance for transcriptional regulation in vivo because of the low sensitivity of UGT1A7 to HNF4α. HNF4α is essential for hepatocyte development and the expression of liver-specific genes but is also present in the intestine and in kidneys (Sladek et al., 1990; Watt et al., 2003). This profile corresponds to the expression profile of UGT1A9 (Wooster et al., 1993; McGurk et al., 1998; Strassburg et al., 1998). HNF1α has been reported to exhibit a broader tissue distribution than HNF4α. In addition to hepatic, intestinal, and renal expression, it has been detected in the stomach (Kuo et al., 1990) and, to a less extent, in the lung (Xanthopoulos et al., 1991). In these tissues, UGT1A7 transcripts are also detectable. Therefore, HNF1α may play an important role in tissue-specific expression of UGT1A7 mRNA. However, the effects of other yet-to-be-identified transcription factors beyond HNF1α are likely to be involved and may enhance or counteract HNF-mediated UGT1A7 activation in a tissue-specific fashion. This hypothesis is supported by findings in luciferase assays, which show considerable variation in activation by HNF expression vectors. Although HNFs are likely to participate in the regulation of tissue-specific UGT1A7 expression, further studies are required to elucidate the mechanisms by which HNF-mediated activation is regulated in different tissues.
The observed evidence of a shared regulation of UGT1A7 by HNF1α and HNF4α is of significance. First, HNF4α activation is reduced by mutagenesis of HNF1 binding motif 1, which suggests binding to this site. It could be argued that this down-regulation is merely mediated by HNF1α binding because HNF1α is up-regulated by HNF4α (Odom et al., 2004). However, our data show the competition of nuclear extract binding to the respective site by HNF4α consensus oligonucleotides and a supershift with HNF4α antibody. Furthermore, siRNA experiments showed that HNF1α-mediated activation of UGT1A7 was significantly reduced by silencing of HNF4α. This indicates that HNF1α activation via binding site 1 at least partially depends on HNF4α. For a full activation by HNF4α, binding of the nuclear receptor to the HNF1 site 1 appears to be required. A similar mechanism of HNF1-dependent HNF4α activation has been described for a different HNF1 binding site in the UGT1A9 promoter region (Gardner-Stephen and Mackenzie, 2007a). No activation was observed when the two above-characterized HNF4α binding sites were mutated, but the HNF1 binding site 1 was left intact. Therefore, HNF4α does not appear to actively activate UGT1A7 via the HNF1 site 1 but merely seems to be required as a binding partner for HNF1α activation. In summary, our findings suggest a binding of HNF1α and HNF4α to the HNF1 site 1 of the UGT1A7 gene.
A comparison of the above-reported data with those previously published on UGT1A9 indicates that although HNF binding sites are present in the promoter regions of both the UGT1A7 and UGT1A9 genes in homologous 5′-upstream regions (with one additional HNF1 motif in UGT1A7), mismatches in only 1 or 2 bp lead to differing responses toward the transcription factors. These minor differences affect the sensitivity toward activation and the relative importance of different sites for coordinate regulation (Gardner-Stephen and Mackenzie, 2007a). This observation suggests that minor sequence alterations, such as those present as SNPs in 5′-upstream DNA sequence, can have profound functional consequences. Many of these SNPs are distant from transcription factor binding motifs and yet appear to influence transcriptional regulation of UGT1A genes. In our study, the 1A7 −57G variant significantly reduced HNF1α activation. The interplay of transcriptional regulation as elucidated here for UGT1A7 and UGT1A9 regarding HNFs and naturally occurring SNP variants is likely to represent the framework of tissue-specific and interindividual control of human hepatic and extrahepatic regulation of glucuronidation. Understanding the regulation of individual UGT1As is essential to develop therapeutic strategies aimed at modulating their activity as protective strategy against disease disposition and drug toxicity. As an example, attempts to target liver tumors with adenoviral gene transfer of HNF4α to reinduce cellular differentiation have shown some promise (Yin et al., 2008). Linoleic acid has recently been identified as a ligand for the orphan nuclear receptor HNF4α (Gonzalez, 2008; Yuan et al., 2009), and although binding of the ligand to its receptor does not appear to lead to significant changes in transcriptional activation by HNF4α, reversibility of receptor binding was shown (Yuan et al., 2009), and a yeast one-hybrid screen could identify a small molecule activator of HNF4α (Le Guével et al., 2009). This consideration suggests that the future development of further ligands may exhibit the capability to up-regulate HNF4α and thereby to influence the regulation of UGT genes such as UGT1A7 and UGT1A9 that are controlled by HNF4α. In this context, the demonstrated coordinated regulation observed for the UGT1A7 5′-upstream region may lead to an elevated susceptibility toward HNF1α-mediated activation.
In summary, this study identifies and characterizes the regulation of human UGT1A7 by HNF1α and HNF4α, including the identification of DNA binding motifs. One motif exhibited a shared regulation by HNF1α and HNF4α. The reported identification of HNF-mediated regulation may contribute to the future identification and characterization of inducers of HNF4α, as well as of potential tools to modulate UGT1A gene expression for therapeutic purposes.
Footnotes
This work was supported in part by Deutsche Forschungsgemeinschaft [Grant SFB621-C3] (to C.P.S.).
Article, publication date, and citation information can be found at http://dmd.aspetjournals.org.
doi:10.1124/dmd.109.030403.
-
ABBREVIATIONS:
- UGT
- UDP glucuronosyltransferase
- HNF
- hepatocyte nuclear factor
- SNP
- single nucleotide polymorphism
- HEK
- human embryonic kidney
- siRNA
- small interfering RNA
- bp
- base pair
- EMSA
- electrophoretic mobility shift assay
- ChIP
- chromatin immunoprecipitation.
- Received September 24, 2009.
- Accepted April 20, 2010.
- Copyright © 2010 by The American Society for Pharmacology and Experimental Therapeutics


