


Abstract
N1-Substituted-6-arylthiouracils, represented by compound 1 [6-(2,4-dimethoxyphenyl)-1-(2-hydroxyethyl)-2-thioxo-2,3-dihydropyrimidin-4(1H)-one], are a novel class of selective irreversible inhibitors of human myeloperoxidase. The present account is a summary of our in vitro studies on the facile oxidative desulfurization in compound 1 to a cyclic ether metabolite M1 [5-(2,4-dimethoxyphenyl)-2,3-dihydro-7H-oxazolo[3,2-a]pyrimidin-7-one] in NADPH-supplemented rats (t1/2 [half-life = mean ± S.D.] = 8.6 ± 0.4 minutes) and dog liver microsomes (t1/2 = 11.2 ± 0.4 minutes), but not in human liver microsomes (t1/2 > 120 minutes). The in vitro metabolic instability also manifested in moderate-to-high plasma clearances of the parent compound in rats and dogs with significant concentrations of M1 detected in circulation. Mild heat deactivation of liver microsomes or coincubation with the flavin-containing monooxygenase (FMO) inhibitor imipramine significantly diminished M1 formation. In contrast, oxidative metabolism of compound 1 to M1 was not inhibited by the pan cytochrome P450 inactivator 1-aminobenzotriazole. Incubations with recombinant FMO isoforms (FMO1, FMO3, and FMO5) revealed that FMO1 principally catalyzed the conversion of compound 1 to M1. FMO1 is not expressed in adult human liver, which rationalizes the species difference in oxidative desulfurization. Oxidation by FMO1 followed Michaelis-Menten kinetics with Michaelis-Menten constant, maximum rate of oxidative desulfurization, and intrinsic clearance values of 209 μM, 20.4 nmol/min/mg protein, and 82.7 μl/min/mg protein, respectively. Addition of excess glutathione essentially eliminated the conversion of compound 1 to M1 in NADPH-supplemented rat and dog liver microsomes, which suggests that the initial FMO1-mediated S-oxygenation of compound 1 yields a sulfenic acid intermediate capable of redox cycling to the parent compound in a glutathione-dependent fashion or undergoing further oxidation to a more electrophilic sulfinic acid species that is trapped intramolecularly by the pendant alcohol motif in compound 1.
Introduction
We recently reported structure-activity relationship studies on N1-substituted-6-aryl-2-thiouracil derivatives as irreversible, mechanism-based inactivators of the hemoprotein myeloperoxidase (MPO, EC 1.11.2.2) with a high degree of selectivity for MPO relative to peroxidases such as thyroid peroxidase (TPO) and cytochrome P450 (P450) enzymes (Ruggeri et al., 2015). The thiouracil analogs behave as suicide substrates of MPO and covalently adduct to the heme prosthetic group through an oxidized sulfur species (presumably a thiol radical) generated during catalysis (Tidén et al., 2011; Ruggeri et al., 2015). The antithyroid drug propylthiouracil (PTU, Fig. 1), which irreversibly inhibits MPO and TPO in a nonselective fashion (Lee et al., 1990; Ruggeri et al., 2015), was used as a starting point in our structure-activity relationship work to identify selective MPO inhibitors. Introduction of polar N1 substituents and replacement of the C6 propyl group in PTU with electron-rich aromatic functionalities resulted in significant improvements in MPO inhibitory activity (inferred from the inactivation kinetics parameters [the maximal rate constant for inactivation and the inhibition constant] and partition ratio) and virtually abolished TPO inhibition with the resultant compounds.
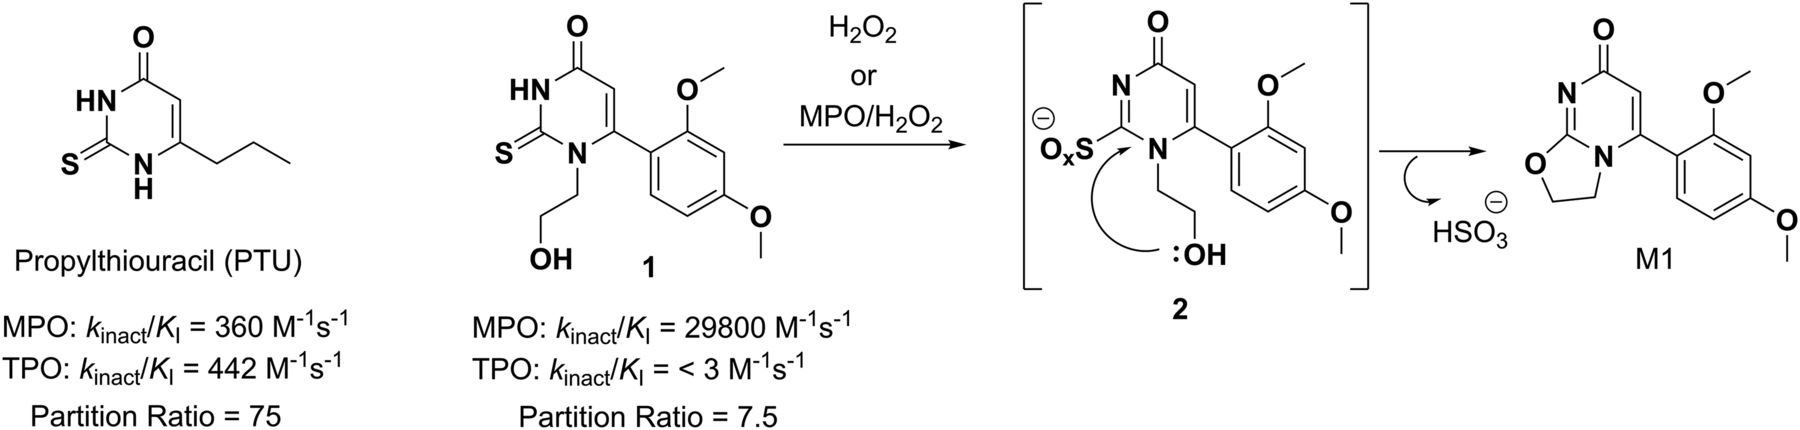
Oxidative desulfurization of the N1-substituted-6-arylthiouracil compound 1 by MPO or H2O2.
Concern over the risk of immune-mediated toxicity (e.g., agranulocytosis and hepatotoxicity) associated with chronic PTU treatment (Futcher and Massie, 1950; Ichiki et al., 1998; Cooper, 2005) via oxidative bioactivation of the thiouracil motif to protein- and thiol-reactive intermediates (Lee et al., 1988, 1990; Waldhauser and Uetrecht, 1991; Jiang et al., 1994) was principally mitigated by tethering the pendant nucleophilic groups to the N1-substituent, which could potentially quench reactive species in an intramolecular fashion. Out of this exercise emerged the lead compound 6-(2,4-dimethoxyphenyl)-1-(2-hydroxyethyl)-2-thioxo-2,3-dihydropyrimidin-4(1H)-one (compound 1, Fig. 1), with significant improvements noted in MPO inactivation potency and selectivity relative to PTU. Intramolecular trapping of reactive species was demonstrated by reacting compound 1 with excess hydrogen peroxide (H2O2) (Kitamura, 1934; Kalm, 1961), which quantitatively converted compound 1 to the pharmacologically inactive cyclic ether 5-(2,4-dimethoxyphenyl)-2,3-dihydro-7H-oxazolo[3,2-a]pyrimidin-7-one (M1, Fig. 1), presumably via an unstable oxidized sulfur intermediate (Ruggeri et al., 2015).
Importantly, no thiol conjugates of compound 1 were generated upon addition of reduced glutathione (GSH) to the H2O2 and MPO/H2O2 incubations. Moreover, compound 1 was resistant toward metabolic turnover in reduced NADPH-supplemented human liver microsomes (half-life [t1/2] > 120 minutes) and cryopreserved human hepatocytes (t1/2 > 240 minutes), which was generally consistent with its physicochemical properties (molecular weight = 308, lipophilicity (logD7.4 = 1.1), and topologic polar surface area = 71.03 Å2). In contrast, a high metabolic turnover of compound 1 was noted in NADPH-supplemented rat and dog liver microsomes, which translated in moderate to high plasma clearance (CLp) in these preclinical species.
In vitro mechanistic studies were initiated to rationalize the species differences in metabolism and revealed a facile conversion of compound 1 principally to the cyclic ether metabolite M1 by rat and dog liver flavin-containing monooxygenase (FMO) 1, which is not expressed in adult human liver. The collective findings from these studies are reported herein.
Materials and Methods
Materials.
The synthesis of compound 1 (chemical purity > 99% by high-performance liquid chromatography [HPLC] and NMR) has been previously reported elsewhere (Ruggeri et al., 2015). The preparation of the M1 metabolite is described in our Supplemental Data. NADPH, 1-aminobenzotriazole, reduced GSH, and imipramine were purchased from Sigma-Aldrich (St. Louis, MO). Pooled male Wistar-Han rat and male and female human liver microsomes (pool of 126 livers, aged 8–10 weeks) were purchased from BD Gentest (Woburn, MA), male beagle dog liver microsomes (pool of 14 livers, aged 1–4 years) and pooled male and female human kidney microsomes from XenoTech (Kansas City, KS). Recombinant human FMO1, FMO3, and FMO5 supersomes were purchased from Corning (Oneonta, NY).
Liver and Kidney Microsomal Stability.
Stock solutions of compound 1 were prepared in dimethylsulfoxide (DMSO) then diluted with methanol and acetonitrile. The final concentration of solvents in the incubation mixture were 0.025% DMSO, 0.5% methanol, and 0.475% acetonitrile. Assessment of t1/2 in liver or kidney microsomes was determined in triplicate with microsomes (1 mg/ml microsomal protein for rat, dog, and human) in 0.1 M potassium phosphate buffer (pH 7.4) containing 3.3 mM MgCl2 at 37°C.
The reaction mixture was prewarmed with 1.3 mM NADPH at 37°C for 5 minutes before initiating the reaction with the addition of compound 1 (1 µM). Aliquots of the reaction mixture at 0.25, 5.0, 10, 20, 30, 40, and 60 minutes were added to acetonitrile containing 0.1% formic acid and the internal standard terfenadine (2 ng/ml). The samples were centrifuged before dilution of supernatant with an equal volume of water containing 0.1% formic acid and liquid chromatography/tandem mass spectrometry (LC-MS/MS) analysis of the disappearance of compound 1 and the formation of cyclized metabolite M1. For the control experiments, NADPH was omitted from these incubations.
A parallel incubation of liver microsomes from rat and dog containing compound 1 (1 μM), GSH (5 mM), and NADPH (1.3 mM) was conducted to evaluate redox cycling of the initial S-oxygenation product of compound 1 formed during the process of enzymatic oxidation. To test the involvement of the thermally unstable FMO in the oxidation, we preincubated rat and dog liver microsomes at 50°C for 5 minutes in the absence of NADPH cofactor and then cooled them on ice followed by incubations described previously. For the purposes of metabolite identification studies, the concentration of compound 1 in the microsomal incubations was raised to 10 µM. The duration of the incubation time was 60 minutes.
Separate incubations of compound 1 (10 μM) were also conducted in human liver microsomes containing NADPH (1.3 mM) and GSH (1 mM) for the purposes of trapping potentially reactive species arising from the oxidative metabolism of compound 1. To determine the effects of P450 or FMO inhibition on the metabolic conversion of compound 1 to M1, 1-aminobenzotriazole (P450 inactivator; 1 mM final concentration) or imipramine (FMO competitive inhibitor; 250 μM final concentration) were preincubated with rat and dog liver microsomes in the presence of NADPH for 20 or 2 minutes, respectively, before initiating the reaction with compound 1.
Incubations of Compound 1 with Recombinant FMO Isoforms.
Potassium phosphate buffer (0.1 M, pH 7.4), magnesium chloride (3.3 mM), NADPH (1.3 mM), and recombinant FMO (0.5 mg/ml) were combined and prewarmed at 37°C for 2 minutes. To initiate the reaction, we added compound 1 at a final concentration of 1 µM (final 0.025% DMSO, 0.5% methanol, and 0.475% acetonitrile). At each time point (0.25, 5.0, 10, 20, 30, 40, and 60 minutes) a 50-µl aliquot of reaction mixture was transferred to 200 µl of acetonitrile containing 0.1% formic acid and the internal standard terfenadine (2 ng/ml). After centrifugation at 2000g, equal volumes of supernatant and water containing 0.1% formic acid were mixed, and the disappearance of compound 1 and formation of M1 were examined by LC-MS/MS.
To evaluate the linearity of the product (i.e., M1) formation by human FMO1 and FMO3 isoforms, recombinant FMO1 or FMO3 supersomes (0.1–1.0 mg/ml) and NADPH (3.3 mM) were preincubated in 0.1 M phosphate buffer (pH 7.4) for 2 minutes at 37°C. Reactions (5000 μl) were initiated by the addition of compound 1 (1 μM), and were allowed to continue at 37°C for 0.25 to 60 minutes. Aliquots (50 µl) of the reactions were quenched with 200 µl of acetonitrile containing 0.1% formic acid and the internal standard terfenadine (2 ng/ml). After centrifugation at 2000g, the supernatants were combined with an equal volume of water containing 0.1% formic acid, and the formation of M1 was examined by LC-MS/MS.
For determination of the Michaelis-Menten constant (KM), the maximum rate of oxidative desulfurization (Vmax), and the intrinsic clearance (CLint, Vmax/KM) for compound 1, incubations were repeated at a single protein concentration and time point determined to be in the linear range of metabolite formation (0.1 mg/ml FMO1, 1 mg/ml FMO3, 60 minutes), containing 12 concentrations of compound 1 (1–300 µM). The kinetic parameters were obtained for FMO1 using the Michaelis-Menten nonlinear regression in GraphPad Prism (GraphPad Software, La Jolla, CA). As the FMO3 reaction was not saturated within the range of substrate concentrations tested, the slope of formation rate of M1 versus substrate concentration (CLint) was calculated using linear regression.
Animal Pharmacokinetics.
Dog experiments were conducted in our Association for Assessment and Accreditation of Laboratory Animal Care International–accredited facilities and were reviewed and approved by the Pfizer Institutional Animal Care and Use Committee. Rat studies were performed at BioDuro, Pharmaceutical Product Development Inc. (Shanghai, People’s Republic of China), with animal care and in vivo procedures conducted according to guidelines from the BioDuro Institutional Animal Care and Use Committee.
Jugular vein cannulated male Wistar-Han rats (∼250 g), obtained from Vital River (Beijing, People’s Republic of China), and male Beagle dogs (∼8–11 kg) were used for these studies. Rats were provided ad libitum access to water and food. Dogs were fasted overnight and fed 4 hours after dosing. Compound 1 was administered intravenously (i.v.) in 5% DMSO/95% of 30% 2-hydroxypropyl-β-cyclodextrin or 25% 2-hydroxypropyl-β-cyclodextrin/75% 100 mM Tris buffer (pH 8.0) via the tail vein of rats (n = 3) or saphenous vein of dogs (n = 3) at a dose of 1.0 mg/kg in a dosing volume of 1 (rat) or 0.5 (dog) ml/kg.
Serial blood samples were collected before dosing and 0.033 (rat only), 0.083, 0.25, 0.5, 1, 2, 4, 7, and 24 hours after dosing. Blood samples from the pharmacokinetic studies were centrifuged to generate plasma. All plasma samples were kept frozen until analysis. Urine samples (0–7.0 and 7.0–24 hours) were also collected after i.v. administration. Aliquots of plasma or urine (10–50 μl) were transferred to 96-well blocks and methanol/acetonitrile (1:1, v/v, 200 μl) containing an internal standard was added to each well. The supernatant was diluted 20-fold with methanol/water (1:1, v/v) containing 0.1% formic acid. The samples were then analyzed by LC-MS/MS, and the concentrations of compound 1 and M1 in plasma and urine were determined by interpolation from a standard curve. The range of quantitation was 1–2000 ng/ml for rats (linear R2 0.991 compound 1 and linear R2 0.996 M1) and 1–5000 ng/ml for dogs (linear R2 0.995 compound 1 and quadratic R2 0.978 M1).
Determination of Pharmacokinetic Parameters.
The pharmacokinetic parameters were determined using noncompartmental analysis (Watson v.7.4; Thermo Scientific, Waltham, MA). The area under the plasma concentration-time curve from t = 0 to 24 hours (AUC0–24) and t = 0 to infinity (AUC0–∞) was estimated using the linear trapezoidal rule, and CLp was calculated as the intravenous dose divided by AUC0–∞i.v.. The terminal rate constant (kel) was calculated by a linear regression of the log-linear concentration-time curve, and the terminal elimination t1/2 was calculated as 0.693 divided by kel. The apparent steady-state distribution volume (Vdss) was determined as the i.v. dose divided by the product of AUC0–∞ and kel. The percentage of unchanged compound 1 excreted in urine over 24 hours was calculated using the following equation: Amount (in mg) of compound 1 in urine over the 24-hour interval after the dose/Actual amount of the dose of compound 1 administered (mg) × 100%. The renal clearance was derived as the ratio of amount (in mg) of compound 1 in urine over the 24-hour interval postdose/AUC0–24.
LC-MS/MS Analysis for Quantitation of Compound 1 and M1.
Concentrations of analytes from in vitro and in vivo studies were determined on a Sciex 5500 LC-MS/MS triple quadrupole mass spectrometer (Sciex, Framingham, MA). Analytes were chromatographically separated using Agilent 1290 (Santa Clara, CA) or Shimadzu LC-20AD (Shimadzu Scientific Instruments, Columbia, MD) pumps. A CTC PAL autosampler was programmed to inject 1 or 10 μl on a Phenomenex Kinetex C18 30 × 3 mm HPLC (Phenomenex, Torrance, CA) or Mac Mod Halo C18 50 × 2.1 mm UPLC column (Mac Mod Analytical, Chadds Ford, PA) using a mobile phase consisting of water containing 0.1% (v/v) formic acid (solvent A) and acetonitrile containing 0.1% formic (solvent B) at a flow rate of 0.5 ml/min.
Compounds 1 and M1 were detected using electrospray ionization (positive ion mode) in the multiple reaction monitoring mode monitoring for mass-to-charge (m/z) transition 309.1 → 164.2 or 291.1 and 275.1 →189.1, respectively. Compounds 1 and M1 standards were fit by least-squares regression of their areas to a weighted linear equation, from which the unknown concentrations were calculated. The dynamic range of the assay was 1.0–2000 ng/ml. Assay performance was monitored by the inclusion of quality control samples with acceptance criteria of ±30% target values.
Bioanalytical Methodology for Metabolite Identification.
Qualitative assessment of the metabolism of compound 1 was conducted using a Thermo Finnegan Surveyor photodiode array plus detector, Thermo Acela pump, and a Thermo Acela Autosampler (Thermo Scientific, West Palm Beach, FL). The monitoring wavelength (λ) was 280 nm. Chromatography was performed on a Phenomenex Hydro RP C18 (4.6 mm × 150 mm, 3.5 μm) column. The mobile phase was composed of 5 mM ammonium formate buffer with 0.1% formic acid (pH 3.0) (solvent A) and acetonitrile (solvent B) at a flow rate of 1 ml/min. The binary gradient was as follows: the solvent A to solvent B ratio was held at 95:5 (v/v) for 3 minutes and then adjusted to 55:45 (v/v) from 0 to 35 minutes, 30:70 (v/v) from 35 to 45 minutes, and 5:95 (v/v) from 45 to 52 minutes, where it was held for 3 minutes and then returned to 95:5 (v/v) for 6 minutes before the next analytic run.
Identification of the metabolites was performed on a Thermo Orbitrap mass spectrometer operating in positive ion electrospray mode. The spray potential was 4 V, and heated capillary was at 275°C. Xcalibur software version 2.0 (Thermo Scientific) was used to control the HPLC-MS system. Product ion spectra were acquired at a normalized collision energy of 65 eV with an isolation width of 2 amu. Metabolites from liver microsomes were identified in the full-scan mode (from m/z 100 to 850) by comparing t = 0 samples with t = 60 minutes samples or through comparison with synthetic standard(s), and structural information was generated from collision-induced dissociation (CID) spectra of protonated molecular ions.
Results
Microsomal Stability.
To examine microsomal stability, compound 1 was incubated in rat, dog, and human liver microsomes or human kidney microsomes in the presence and absence of NADPH cofactor; periodically, aliquots of the incubation mixture were examined for the depletion of compound 1 (Supplemental Fig. 1). The t1/2 (mean ± S.D.) for depletion of compound 1 in NADPH-supplemented rat, dog, and human liver microsomes was 8.6 ± 0.4, 11.2 ± 0.4 minutes, and > 120 minutes, respectively. No substrate depletion (t1/2 > 120 minutes) was noted in rat, dog, and human incubations that lacked NADPH cofactor or liver microsomes. Figure 2 depicts the extracted ion chromatograms of incubation mixtures of compound 1 in NADPH-supplemented liver microsomes from rats, dogs, and humans. The major metabolite M1 was detected in rat and dog liver microsomes in a NADPH-dependent fashion. The MS2/MS3 spectra of compound 1 [retention time (tR) = 11.25 minutes, exact mass (M + H)+ = 309.0904] and M1 [tR = 9.61 minutes, exact mass (M + H)+ = 275.1026] are shown in Supplemental Figs. 2 and 3, respectively.

HPLC-UV (λ = 280 nm) chromatogram of an incubation mixture of compound 1 (10 μM) in NADPH-supplemented (A) rat, (B) dog, and (C) human liver microsomes.
The theoretical exact masses for the proposed fragment ion structures in the CID spectrum of compound 1 and M1 were consistent with the observed accurate masses (<2 ppm difference). The tR and mass spectrum of M1 were identical to those discerned with an authentic standard, which was chemically synthesized via S-methylation of compound 1 to the corresponding thioether derivative 2 followed by peroxide-mediated oxidative desulfurization/intramolecular cyclization presumably via an electrophilic sulfoxide intermediate (see the Supplemental Data for the detailed synthetic protocol). Metabolites M2 (tR = 9.19 minutes) and M3 (tR = 8.75 minutes) were rat-specific metabolites with an identical exact mass [295.0747 (M + H)+] and CID spectra (see Supplemental Fig. 4 for a representative CID spectra of M3), implying that these metabolites were isomeric phenols derived from P450-mediated O-demethylations in compound 1.
Consistent with the metabolic stability results, M1–M3 were only detected in trace quantities in human liver microsomal incubations of compound 1 in the presence of NADPH. Compound 1 (1 μM) appeared to be stable (t1/2 > 120 minutes) toward metabolic turnover in NADPH-supplemented human kidney microsomes, with minimal amount of M1 (80 nM) formed during the course of the 60-minute incubation.
Compound 1 was devoid of reactive metabolite formation in NADPH-supplemented rat, dog, and human liver microsomes as inferred from the lack of GSH conjugates formed when GSH (5 mM) was included in the microsomal incubations (data not shown). Incidentally, inclusion of excess GSH significantly attenuated oxidative desulfurization of compound 1 (to M1) in liver microsomal incubations from rats and dogs (Supplemental Fig. 5). In the presence of GSH, compound 1 was virtually resistant to metabolic turnover in NADPH-supplemented dog liver microsomes [t1/2 (− GSH) = 11.2 ± 0.4 minutes; t1/2 (+ GSH) > 120 minutes]. In contrast, the impact of GSH on the overall metabolic stability of compound 1 in NADPH-supplemented rat liver microsomes was less severe [t1/2 (− GSH) = 8.6 ± 0.4; t1/2 (+ GSH) 49.7 ± 1.7 minutes].
Qualitative examination of metabolite formation in NADPH- and GSH-supplemented rat liver microsomal incubations of compound 1 (10 μM) revealed that the formation of the O-demethylated metabolites M2 and M3 was not impacted in the presence of the thiol nucleophile, which was in contrast to the complete disappearance of M1 (Fig. 3).

HPLC-UV chromatogram of an incubation mixture of compound 1 (10 μM) in NADPH-supplemented rat liver microsomes in the absence or presence of GSH.
Identification of Enzymes Responsible for Oxidative Desulfuration of Compound 1 to M1.
Incubations of compound 1 (1 μM) in NADPH-supplemented rat or dog liver microsomes, which had been subjected to heat treatment (50°C) for 5 minutes in the absence of NADPH cofactor, induced metabolic resistance in compound 1 and virtually abrogated the formation of M1, as shown in a representative plot of an incubation mixture of compound 1 in heat-inactivated rat liver microsomes (Fig. 4). This implies a potential role for a FMO isoform(s) in oxidative desulfurization.

Oxidative desulfurization of compound 1 (1 μM, ●) to M1 (□) in NADPH-supplemented rat liver microsomes in the (A) absence or (B) presence of heat inactivation (5 minutes, 50°C). Symbols depict mean and error bars for standard deviation.
Incubations of compound 1 (1 μM) in 0.5 mg/ml human recombinant FMO1, FMO3, and FMO5 in the presence of NADPH revealed that FMO1 was principally responsible for the formation of M1, with a minor contribution from FMO3 (Fig. 5). The contribution of FMO5 toward M1 formation was insignificant in this analysis; as such, the enzyme kinetics experiments were not pursued. The reactions with FMO1 and FMO3 were linear as a function of incubation time (5–60 minutes) and protein concentration up to 1.0 mg/ml of microsomal protein (results not shown).

Oxidative desulfurization of compound 1 (1 μM) to M1 in human recombinant FMO1, FMO3, and FMO5. Incubations were conducted using 0.5 mg/ml supersomes in the presence of NADPH (1.3 mM) for 5 minutes at 37°C. Symbols depict mean and error bars for standard deviation.
The effects of substrate concentrations on oxidative desulfurization of compound 1 by recombinant human FMO1 and FMO3 were investigated, and the results are shown in Fig. 6. Oxidation of compound 1 to M1 by FMO1 followed Michaelis-Menten kinetics (Fig. 6A), with Km, Vmax, and CLint ± standard error values of 209 ± 12 μM, 20.4 ± 0.6 nmol/min/mg protein, and 97.7 μl/min/mg protein, respectively. In the case of FMO3, the Michaelis-Menten plot (see Fig. 6B) showed that conversion of compound 1 to M1 was linear up to the highest substrate concentration of 300 μM, indicating that the apparent KM value was >300 μM. Therefore, the KM and Vmax values for FMO3 could not be determined. The corresponding CLint value calculated from the slope of the Michaelis-Menten plot was 0.54 μl/min/mg protein.

Kinetics of oxidative desulfurization of compound 1 to M1 by (A) human recombinant FMO1 (0.1 mg/ml microsomal protein) and (B) FMO3 (1 mg/ml). Incubations were conducted in the presence of NADPH (1.3 mM) at 37°C for 60 minutes in triplicate. Symbols depict mean and error bars for standard deviation.
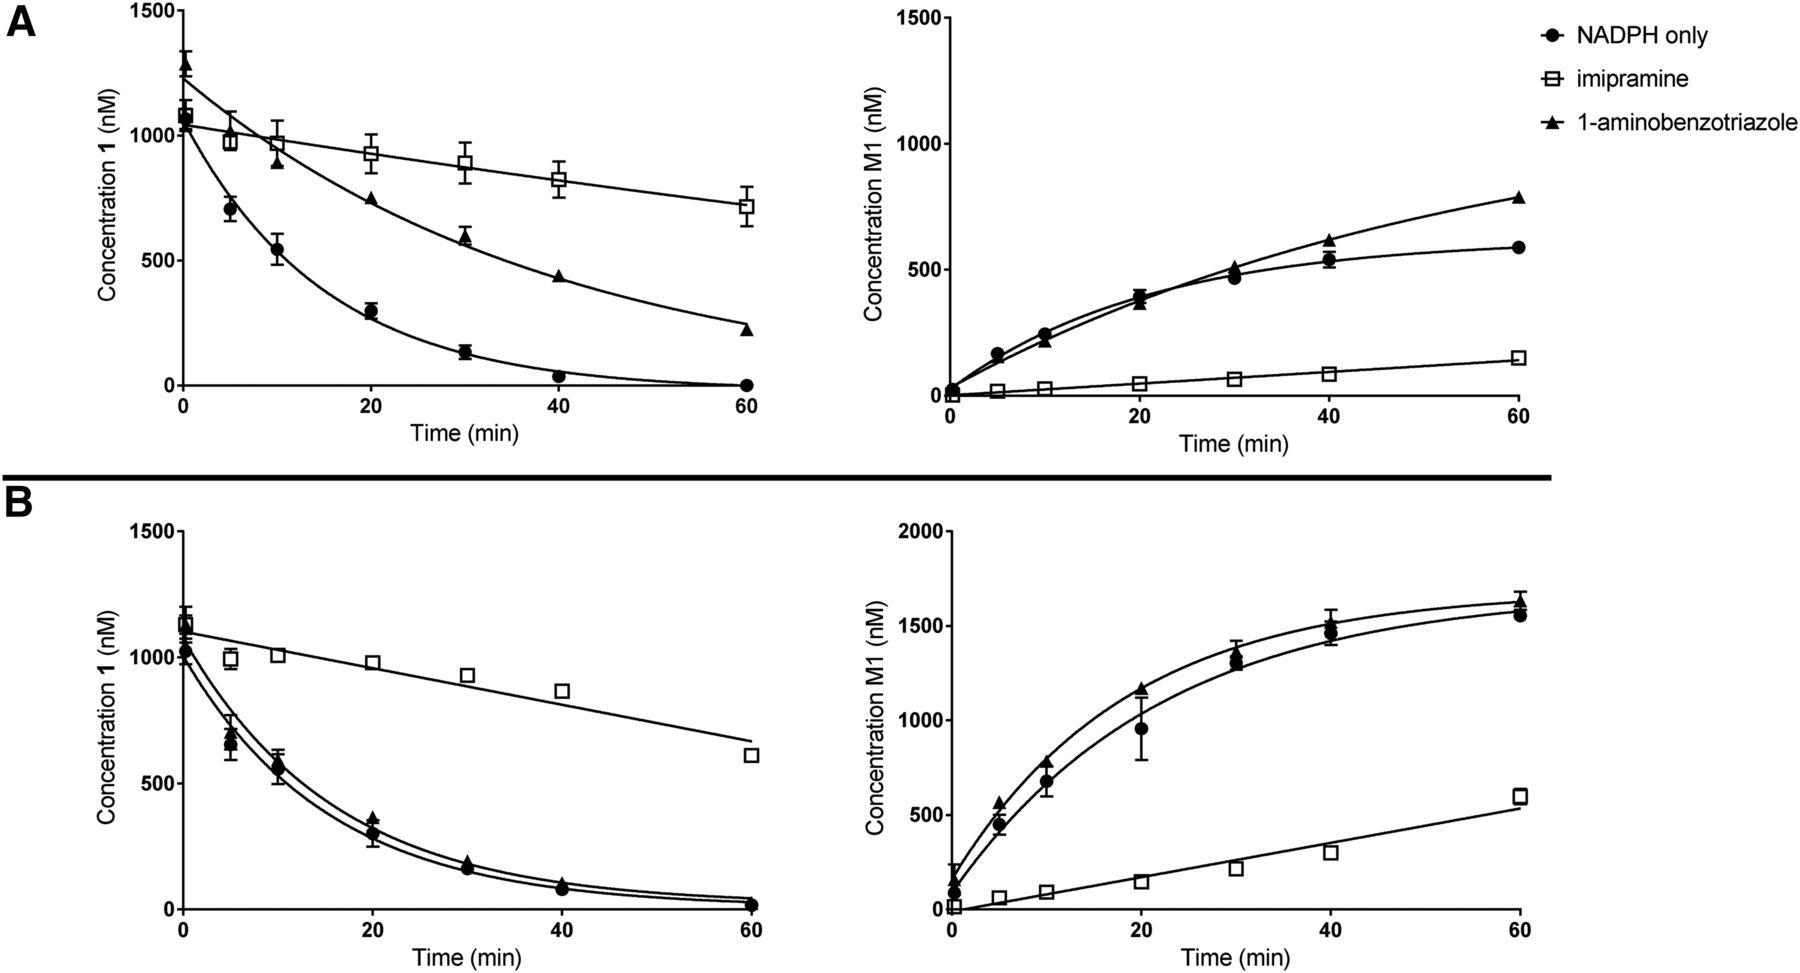
Consistent with these observations, conversion of compound 1 to M1 in NADPH-supplemented rat and dog liver microsomes was strongly inhibited upon coincubation with imipramine (250 μM), a selective inhibitor of FMO1 (Dixit and Roche, 1984; Lee et al., 2009; Yamazaki et al., 2014), as reflected from changes in t1/2 from 8.6 to ∼90 minutes (rats) and 11 to 81 minutes (dogs). In contrast, the effect of the nonselective P450 inactivator 1-aminobenzotriazole (1 mM) (Caldwell et al., 2005; Strelevitz et al., 2006; Boily et al., 2015; Parrish et al., 2015) on oxidative desulfurization was less severe (rat: t1/2 from 8.6 to 25 minutes; dog: t1/2 from 11.0 to 12 minutes (Fig. 7).

Oxidative desulfurization of compound 1 (1 μM) to M1 in NADPH-supplemented (A) rat and (B) dog liver microsomes in the absence or presence of FMO1 and P450 inhibitors, imipramine (250 μM) and 1-aminobenzotriazole (1000 μM), respectively. Symbols depict mean and error bars for standard deviation.
Intravenous Pharmacokinetics of Compound 1 after Single Doses to Rats and Dogs.
The pharmacokinetic parameters describing the disposition of compound 1 and M1 after administration of compound 1 to Wistar-Han rats and Beagle dogs are shown in Table 1 and Supplemental Fig. 6. Compound 1 demonstrated moderate to high CLp (rat CLp = 73 ± 13 ml/min/kg; dog CLp = 12 ± 3 ml/min/kg), and a moderate Vdss (rat Vdss = 1.4 ± 0.5 l/kg; dog Vdss = 1.3 ± 0.3 l/kg) resulting in terminal elimination t1/2 values of 0.4 ± 0.2 and 5.3 ± 0.8 hours, respectively, in rats and dogs. M1 was also detected in the circulation after i.v. administration of compound 1 to rats and dogs.
Mean pharmacokinetic parameters of compound 1 and cyclic ether metabolite M1 in after intravenous (1 mg/kg) administration of compound 1 to Wistar-Han rats and beagle dogs
Pharmacokinetic parameters are expressed as mean ± S.D.
The corresponding AUC0–∞ values of compound 1 and M1 in rats were 233 ± 37 and 49.8 ± 11.2 ng.h/ml, respectively, whereas the corresponding AUC0–∞ values of compound 1 and M1 in dogs were 1450 ± 310 and 769 ± 136 ng.h/ml, respectively. M1 had a slightly longer elimination t1/2 (relative to compound 1) in rats and dogs. Renal excretion of unchanged compound 1 (<1% in rats and ∼1.1% in dogs) and unchanged M1 (∼4.7% in rats and ∼14.2% in dogs) was relatively low.
Discussion
Concerns over the liberation of indiscriminate electrophilic species during MPO-mediated oxidation of N1-substituted-6-aryl-2-thiouracils were minimized by ensuring a high partition ratio for MPO inactivation and by tethering nucleophilic functional groups in proximity of the thiouracil sulfur. Our medicinal chemistry strategy was also weighted toward the design of compounds in the lower range of lipophilicity (logD < 1.5, topologic polar surface area < 100 Å2) to minimize the potential for oxidative metabolism/bioactivation of the thiouracil motif in human liver.
Apart from peroxidases, enzymatic bioactivation of thioureas and related analogs (e.g., thiones, thiocarbamides, etc.) to electrophilic intermediates by mammalian P450 and/or FMO isoforms can also lead to toxicity (Poulsen et al., 1979; Neal and Halpert, 1982; Decker and Doerge, 1992; Onderwater et al., 1999, 2004; Smith and Crespi, 2002; Henderson et al., 2004; Ji et al., 2007). For instance, the cases of clinical hepatotoxicity and/or nephrotoxicity that were noted with the antithyroid drug methimazole (Martinez-Lopez et al., 1962) and the antiparasitic agent thiabendazole (Manivel et al., 1987) have been causally linked with their metabolism to the proximal toxicants N-methylthiourea and thioformamide, respectively, via an initial P450-catalyzed oxidative ring scission of the 2-mercaptobenzimidazole and thiazole motifs present in these drugs. S-oxidation of the N-methylthiourea and thioformamide metabolites to reactive metabolites by FMO enzymes is believed to represent the key step resulting in toxicity (Mizutani et al., 1993, 2000).
Consistent with our design philosophy, the N1-substituted-6-aryl-2-thiouracil class of MPO inhibitors (represented in our present study by compound 1) were stable toward metabolism in NADPH-supplemented human liver microsomes and/or cryopreserved human hepatocytes (Ruggeri et al., 2015), and they were latent to the formation of reactive species, as judged from the absence of GSH conjugates in human recombinant MPO and human liver microsomes supplemented with an excess of the thiol nucleophile. Compound 1 was also devoid of reversible and time-dependent inhibitory effects against major human P450 enzymes (Pfizer data on file), which made it an attractive candidate for advancement in preclinical toxicity studies.
In contrast with the metabolic resistance in human hepatic tissue, compound 1 was converted to cyclic ether M1 in NADPH-supplemented rat and dog liver microsomes. Heat inactivation, which abolishes FMO activity while preserving P450 activity (Ziegler, 1980), provided circumstantial evidence for the involvement of an FMO isoform(s) in the formation of M1. Consistent with this initial finding, the nonselective P450 inactivator 1-aminobenzotriazole had little effect on the conversion of compound 1 to M1 in rat and dog liver microsomes. In contrast, the FMO1 competitive inhibitor imipramine dramatically reduced the oxidative desulfurization in rat and dog liver microsomes, respectively, implying that the conversion of compound 1 to M1 in rat and dog liver microsomes is facilitated primarily by FMO1 rather than P450 isoforms. The possibility of imipramine’s inhibitory effects occurring through inhibition of rat P450 isoforms (Murray and Field, 1992; Masubuchi et al., 1995) can be ruled out on the basis of the results obtained with 1-aminobenzotriazole.
Mammalian FMOs (E.C.1.14.12.8) comprise a group of flavin adenine dinucleotide-containing enzymes that use NADPH and molecular oxygen to generate a 4α-hydroperoxyflavin intermediate, which mediates the two-electron oxidation of soft, highly polarizable nucleophilic heteroatom (nitrogen, sulfur, and phosphorus)–containing xenobiotics (Hines et al., 1994; Cashman, 1995; Cashman et al., 1995; Ziegler, 2002; Krueger and Williams, 2005; Phillips and Shephard, 2008). Our findings on the facile decomposition of compound 1 to M1 in the presence of H2O2 and FMO1 are consistent with the notion that FMO1 will generally oxygenate any nucleophilic heteroatom-containing compound that can be oxidized by H2O2 and/or peracids (Bruice et al., 1983).
To date, five distinct forms of FMO (i.e., FMO1–5) have been identified (Lawton et al., 1994; Hernandez et al., 2004). Examinations of adult human liver mRNA indicate high FMO3 (and FMO5) expression but low FMO1 expression (Dolphin et al., 1996; Koukouritaki et al., 2002; Koukouritaki and Hines, 2005; Hines, 2006; Zhang and Cashman, 2006; Shimizu et al., 2011; Chen et al., 2016). In contrast, rat livers have been shown to express high levels of FMO1 protein (Itoh et al., 1993; Cherrington et al., 1998; Lattard et al., 2002a; Yamazaki et al., 2014). Expression of FMO1 and FMO3 in dog liver has also been reported with 84%–89% amino acid sequence identity to the corresponding orthologs from rat and human (Ripp et al., 1999; Lattard et al., 2002b; Stevens et al., 2003). As such, dog FMO1 and dog FMO3 exhibit only 56% identities in primary amino acid sequence (Lattard et al., 2002b).
To identify the specific FMO isoform responsible for the oxidative desulfurization of compound 1, we conducted studies using recombinant human FMO isoforms. FMO3 and FMO5 were used because they represent the isoforms most abundant in human liver, and FMO1 was used because it is the ortholog of the form most abundant in adult rat and dog liver. The formation of M1 was principally mediated by recombinant FMO1 with little to no contribution from FMO3 or FMO5 (apparent CLint for M1 formation by FMO1 was 154-fold higher than that by FMO3), which is consistent with the inhibitory effects of imipramine on oxidative desulfurization of compound 1 in rat and dog liver microsomes.
Overall, these results suggest that liver microsomal FMO1 could contribute to the relatively high FMO-mediated oxidative desulfurization of compound 1 in rat and dog liver microsomes and that lower expression of FMO1 in human livers is a major determinant of oxidation potential in livers from preclinical species and humans. The in vitro metabolic instability of compound 1 also manifested in moderate to high CLp in rats and dogs with significant circulating M1 concentrations measured in both species, which provided an in vivo context for the in vitro findings, especially when considering that renal excretion of compound 1 in unchanged form was negligible in rats and dogs.
Additional case studies on species differences in FMO-mediated metabolism have also appeared in the literature, which strengthen our observations on the selective nature of FMO1-mediated oxidative desulfurization in compound 1. For instance, a recent report from Liu et al., (2013) demonstrated that quinuclidine ring N-oxidation in a selective α7 neuronal acetylcholine receptor agonist ABT-107 (5-[6-[[(3R)-1-azabicyclo[2.2.2]octan-3-yl]oxy]pyridazin-3-yl]-1H-indole) occurred primarily in liver microsomes from rats and dogs (but not in humans), and was also principally mediated by FMO1.
Because mRNA expression levels for FMO1 are higher in the human kidney (relative to the liver) (Dolphin et al., 1996; Zhang and Cashman, 2006; Chen et al., 2016), we also examined the oxidative desulfurization of compound 1 in NADPH-supplemented human kidney microsomes. Compared with recombinant FMO1, compound 1 was relatively stable in kidney microsomes with a minimal amount of M1 (∼80 nM) formed in a NADPH-dependent fashion. Because of the unknown amount of FMO in the commercial preparation of the human kidney microsomes, no rate comparisons can be made between recombinant and microsomal preparations at the present time.
Mammalian FMOs typically display high activity toward S-oxidation in thioureas, thiones, and thiocarbamides. The initial oxygenation of the sulfur atom produces the electrophilic sulfenic acid (R-SOH) species that is capable of reacting with nucleophiles, including GSH (Poulsen et al., 1979; Neal and Halpert, 1982; Krieter et al., 1984; Decker and Doerge, 1992; Onderwater et al., 1999; Kim and Ziegler, 2000; Smith and Crespi, 2002; Henderson et al., 2004). The sulfenic acid derivatives can undergo redox cycling in the presence of GSH coupled with the oxidation of GSH to GSSG. The sulfenic acid metabolite can also undergo a second oxidation by FMO to the unstable sulfinic acid (R-SO2H), which is more reactive than the sulfenic acid metabolite and can damage the cell directly or alkylate proteins (Onderwater et al., 1999, 2004; Ji et al., 2007).
Our investigations on the oxidative desulfurization of compound 1 to M1 (Fig. 8) largely parallel the mechanistic insights noted in the literature. For example, addition of excess GSH essentially eliminated the conversion of compound 1 to M1 in NADPH-supplemented rat and dog liver microsomes, suggesting that the initial FMO1-mediated S-oxygenation of compound 1 leads to the corresponding sulfenic acid derivative 3, which undergoes redox cycling to the parent compound 1 in a GSH-dependent fashion (presumably via oxidation of GSH to GSSG). A second oxidation of the sulfenic acid derivative 3 yields the more electrophilic sulfinic acid species 4, which is trapped intramolecularly (perhaps in a diffusion-controlled fashion) by the pendant alcohol motif on the N1-substitutent in compound 1.

Proposed mechanism of oxidative desulfurization of compound 1 to M1 in NADPH-supplemented rat and dog liver microsomes.
In conclusion, our studies underscore one of the limitations of rats and dogs as surrogates of adult human FMO-dependent drug metabolism studies. The conclusions from previous animal studies that lacked significant amounts of liver FMO3 (i.e., rats and dogs) may need to be reconsidered. From a drug discovery perspective, our findings provide a cautionary note against the use of allometric scaling of clearance from animals to human without a thorough knowledge of the overall disposition/metabolic elimination mechanism of the molecule(s) under consideration.
Authorship Contributions
Participated in research design: Eng, Sharma, Wolford, Kalgutkar.
Conducted experiments: Eng, Sharma, Conn.
Contributed new reagents or analytic tools: Conn, Ruggeri.
Performed data analysis: Eng, Sharma, Wolford, Dalvie, Kalgutkar.
Wrote or contributed to the writing of the manuscript: Eng, Dalvie, Buckbinder, Ruggeri, Di, Kalgutkar.
Footnotes
- Received February 22, 2016.
- Accepted April 13, 2016.
↵
 This article has supplemental material available at dmd.aspetjournals.org.

Abbreviations
- ABT-107
- 5-[6-[[(3R)-1-azabicyclo[2.2.2]octan-3-yl]oxy]pyridazin-3-yl]-1H-indole
- AUC0–∞
- area under the plasma concentration–time curve from zero to infinity
- CID
- collision-induced dissociation
- CLint
- intrinsic clearance
- CLp
- plasma clearance
- compound 1
- 6-(2,4-dimethoxyphenyl)-1-(2-hydroxyethyl)-2-thioxo-2,3-dihydropyrimidin-4(1H)-one
- DMSO
- dimethylsulfoxide
- FMO
- flavin-containing monooxygenase
- GSH
- glutathione
- HPLC
- high-performance liquid chromatography
- kel
- terminal rate constant
- KM
- Michaelis-Menten constant
- LC-MS/MS
- liquid chromatography tandem mass spectrometry
- M1
- 5-(2,4-dimethoxyphenyl)-2,3-dihydro-7H-oxazolo[3,2-a]pyrimidin-7-one
- MPO
- myeloperoxidase
- P450
- cytochrome P450
- PTU
- propylthiouracil
- t1/2
- half-life
- tR
- retention time
- TPO
- thyroid peroxidase
- Vdss
- steady-state distribution volume
- Vmax
- maximum rate of oxidative desulfurization
- Copyright © 2016 by The American Society for Pharmacology and Experimental Therapeutics


