


Abstract
(R)-2-((2-(1H-pyrrolo[2,3-b]pyridin-3-yl)pyrimidin-4-yl)amino)-2-methyl-N-(2,2,2-trifluoroethyl)butanamide (VX-509, decernotinib) is an oral Janus kinase 3 inhibitor that has been studied in patients with rheumatoid arthritis. Patients with rheumatoid arthritis often receive multiple medications, such as statins and steroids, to manage the signs and symptoms of comorbidities, which increases the chances of drug-drug interactions (DDIs). Mechanism-based inhibition is a subset of time-dependent inhibition (TDI) and occurs when a molecule forms a reactive metabolite which irreversibly binds and inactivates drug-metabolizing enzymes, potentially increasing the systemic load to toxic concentrations. Traditionally, perpetrating compounds are screened using human liver microsomes (HLMs); however, this system may be inadequate when the precipitant is activated by a non–cytochrome P450 (P450)–mediated pathway. Even though studies assessing competitive inhibition and TDI using HLM suggested a low risk for CYP3A4-mediated DDI in the clinic, VX-509 increased the area under the curve of midazolam, atorvastatin, and methyl-prednisolone by approximately 12.0-, 2.7-, and 4.3-fold, respectively. Metabolite identification studies using human liver cytosol indicated that VX-509 is converted to an oxidative metabolite, which is the perpetrator of the DDIs observed in the clinic. As opposed to HLM, hepatocytes contain the full complement of drug-metabolizing enzymes and transporters and can be used to assess TDI arising from non-P450–mediated metabolic pathways. In the current study, we highlight the role of aldehyde oxidase in the formation of the hydroxyl-metabolite of VX-509, which is involved in clinically significant TDI-based DDIs and represents an additional example in which a system-dependent prediction of TDI would be evident.
Introduction
Assessment of time-dependent inhibition (TDI), especially of CYP3A4, is an important parameter for preclinical and clinical development of drugs (Parkinson et al., 2010). Due to their ready availability, low cost, and ease of use, pooled human liver microsomes (HLMs) are a commonly used in vitro system to evaluate the TDI potential of new chemical entities (Grimm et al., 2009). However, HLMs do not contain key cytosolic enzymes, which may be involved in the formation of metabolites that could cause TDI (Tornio et al., 2014). Because hepatocytes are an intact cellular system, not only is their cytochrome P450 (P450) activity preserved, but other microsomal enzymes with different cofactor requirements and nonmicrosomal drug metabolic enzymes are also active. The utility of hepatocytes for TDI prediction is highlighted by a few classic examples where nonmicrosomal enzymes were involved in the formation of metabolites which perpetrated the TDI. For both gemfibrozil and clopidogrel, glucuronide metabolites were formed which caused TDI of CYP2C8 (Ogilvie et al., 2006; Tornio et al., 2014), whereas Reese et al. (2008) reported that the ability of bupropion to inhibit CYP2D6 depends, at least in part, on its reduction presumably by carbonyl reductase (CBR) or aldo-ketoreductase (AKR) (Reese et al., 2008). Both CBR and AKR are NADPH-dependent enzymes present in cytosol (Penning, 2015).
Similar to AKR and CBR, aldehyde oxidase (AO) is present in the cytosolic fraction, and thus standard metabolic studies using HLMs do not capture AO-mediated metabolism. AO belongs to a family of enzymes referred to as molybdenum cofactor–containing enzymes that also include xanthine oxidase (Hutzler et al., 2012). AO is predominantly expressed in the liver, lung, and kidney, and is present in the intestine (Moriwaki et al., 2001; Ueda et al., 2005; Sahi et al., 2008). It is involved in the phase I metabolism of xenobiotics, including anti-infectives, anticancer compounds, antiepileptics, and antipsychotics (Rashidi et al., 1997; Al-Salmy, 2001; Beedham et al., 2003; Obach, 2004; Obach et al., 2004). A major challenge with understanding and properly characterizing AO metabolism in preclinical studies is that AO expression levels vary markedly across species, with the highest activity reported in monkey and human, and relatively lower activity in guinea pig, rat, and mouse and no activity reported in dog (Wurzinger and Hartenstein, 1974; Beedham et al., 1987; Kawashima et al., 1999; Abu-Zahra et al., 2000; Austin et al., 2001). Additional complications include substantial variability in AO activity among cryopreserved human hepatocyte lots, necessitating internal characterization for in vivo extrapolation (Hutzler et al., 2014).
Although preclinical in vivo studies have demonstrated a drug-drug interaction (DDI) due to inhibition of AO by hydralazine in guinea pig and rabbit (Johnson et al., 1985), there are currently no reported clinical DDIs related solely to AO. There is evidence to suggest that AO contributes to the pharmacokinetic interaction between zaleplon and cimetidine (Renwick et al., 2002); however, cimetidine is known to inhibit P450 enzymes and renal organic anion and cation transporters (Somogyi, 1996; Sahi, 2005), so the specific contribution of AO to the observed DDI is not known. Recently, a group of scientists, under the auspices of the Drug Metabolism Leadership Group of the Innovation and Quality Consortium, conducted an evaluation of having a metabolite as the sole contributor to P450 inhibition–based DDIs. After a thorough review of the literature and analysis of frequently prescribed drugs, the group concluded that the risk of P450 inhibition caused by a metabolite alone is low (Yu et al., 2015). In the current study, we highlight the role of AO in the formation of the hydroxyl metabolite of decernotinib [(R)-2-((2-(1H-pyrrolo[2,3-b]pyridin-3-yl)pyrimidin-4-yl)amino)-2-methyl-N-(2,2,2-trifluoroethyl)butanamide (VX-509)], which may be the major contributor involved in a TDI-based DDI. Based upon preclinical studies conducted in HLMs, VX-509 was deemed to have a low risk of causing a DDI due to inhibition of CYP3A4; however, in clinical studies in which VX-509 was coadministered with midazolam, atorvastatin, and methylprednisolone, a 12.0-, 2.7-, and 4.3-fold increase in area under the curve (AUC) was observed for these CYP3A4 substrates (Huang et al., 2014). This is an additional example in which a system-dependent prediction of TDI is evident, emphasizing the advantage of using human hepatocytes, as opposed to HLMs, to assess DDI risk.
Materials and Methods
Materials.
Mixed-gender pooled HLMs were purchased from BD Gentest (Woburn, MA). 6β-Hydroxytestosterone, clarithromycin, dimethylsulfoxide, erythromycin, hydralazine, ketoconazole, mibefradil, midazolam, mifepristone, NADPH, phthalazine, phthalazone, testosterone, troleandomycin, and verapamil were purchased from Sigma-Aldrich (St. Louis, MO). Potassium phosphate buffers were prepared internally with salts purchased from Sigma-Aldrich. VX-509, M3, and the analytical internal standard were synthesized at Vertex Pharmaceuticals Incorporated (Boston, MA). Luciferin-IPA (LIPA) and CellTiter-Fluor viability reagents were obtained from Promega (Madison, WI). Universal Cryopreservation Recovery Medium was purchased from In Vitro ADMET Laboratories (Columbia, MD). Fluorescent acridine orange and propidium iodide staining solution was purchased from Nexcelom (Lawrence, MA). Phosphate-buffered saline, Williams’ E medium, primary hepatocyte plating, and maintenance supplements were acquired from Life Technologies (Carlsbad, CA). White/clear collagen I–coated 96-well plates were obtained from Corning (Corning, NY). Precommercial stage recombinant AO preparations were generously provided as a gift by Alice Gao of Corning, and were characterized internally for activity. Human and monkey cytosol was purchased from XenoTech (Lenexa, KS). Plateable cryopreserved hepatocytes were purchased from In Vitro ADMET Laboratories (lots HH1007 and HH8004), Life Technologies (lot Hu8123), and Celsis IVT (lots BPB and YOW; Baltimore, MD).
Reversible Inhibition of CYP3A4 Using Human Liver Microsomes.
The potential of VX-509 and M3 to inhibit CYP3A4 was evaluated in pooled, mixed-gender HLMs. The incubation mixtures were prepared in 100 mM potassium phosphate buffer plus 1 mM EDTA (pH 7.4) with a final concentration of 0.25 mg/ml microsomal protein and 2 mM NADPH. The test articles VX-509 and M3 were evaluated at eight concentrations ranging from 0 to 75 μM, and ketoconazole, a specific inhibitor of CYP3A4, was similarly included as a positive control. CYP3A4 substrates were used at Km-equivalent concentrations: 40 µM testosterone or 2.5 µM midazolam. CYP3A4 activity was quantified as the presence of the reaction-specific metabolites, 6β-hydroxytestosterone and 1′-hydroxymidazolam. The reactions were incubated in triplicate for 10 minutes in a 37°C shaking incubator. Following incubation, the samples were quenched with 1.5 volumes of acetonitrile containing stable isotope–labeled internal standards: 1 µM 6β-hydroxytestosterone-d3 or 0.05 µM 1′-hydroxymidazolam-13C3. Mixtures were centrifuged for 20 minutes at 2200g, and supernatants were collected for analysis by liquid chromatography–tandem mass spectrometry (LC-MS/MS). Percent inhibition for each concentration of VX-509, M3, or positive control was calculated relative to vehicle control (no inhibitor). IC50 values were calculated in Galileo LIMS (version 3.3; Thermo Scientific, Waltham, MA) using a sigmoidal inhibition model.
Time-Dependent Inhibition of CYP3A4 Using Human Liver Microsomes.
The potential of VX-509 and M3 to inactivate CYP3A4 in a time-dependent manner was also evaluated in HLMs. VX-509 or M3 was combined with 1 mg/ml HLMs supplemented with NADPH for up to 30 minutes in the absence of substrate. Initial concentrations of the test articles during the preincubation ranged from 0 to 50 μM, and 10 µM mifepristone was included as the positive control. Following preincubation, remaining CYP3A4 activity was assessed by 10-fold dilution into substrate mixtures containing 250 μM testosterone and NADPH. Following 10-minute incubation, samples were quenched with 1.5 volumes of internal standard solution containing 1 µM 6β-hydroxytestosterone-d3 in acetonitrile. The samples were centrifuged for 20 minutes at 2200g, and supernatants were collected for analysis by LC-MS/MS. The residual CYP3A4 activity was determined at each concentration and preincubation time, and was normalized relative to the solvent controls.
M3 Metabolite Generation in Liver Cytosol and Recombinant Aldehyde Oxidase.
Liver cytosol incubation mixtures contained 1 mg/ml human or monkey cytosol and 10 μM VX-509 in 400 μl of phosphate buffer. The incubations were conducted for 120 minutes in a 37°C water bath. Aliquots (200 μl) were removed at the onset and conclusion of the incubation, and were quenched by the addition of 3 volumes of ice-cold acetonitrile. The samples were vortexed and centrifuged at 14,000g for 20 minutes. The supernatants were transferred and dried in a centrifuge vacuum, and reconstituted in 100 μl of water/acetonitrile (95:5). The reconstitutes were analyzed by high-performance liquid chromatography/high-resolution mass spectrometry for the identification of VX-509 metabolites.
Recombinant AO isolates were used at a final protein concentration of 0.5 mg/ml. Solutions of VX-509 or control were prepared at 1 and 10 μM in 25 mM phosphate buffer (pH 7.4) and incubated with shaking at 37°C. At designated time points, aliquots were removed to plates containing 2 volumes of acetonitrile internal solution on ice. The samples were vortexed and centrifuged for 20 minutes at 2200g, and the supernatants were collected for analysis by LC-MS/MS.
Aldehyde Oxidase Activity in Human Hepatocyte Lots.
AO activity for each donor of cryopreserved hepatocytes was determined using phthalazine as a substrate and monitoring the appearance of the reaction-specific metabolite, phthalazone. Phthalazine was added to plated hepatocytes at concentrations ranging from 0.1 to 100 μM in Williams’ E medium supplemented with 15 mM HEPES. Cells were incubated in a humidified chamber at 37°C and 5% CO2, and aliquots of the supernatant were removed at time points up to 120 minutes and quenched in 4 volumes of ice-cold acetonitrile containing an internal standard. The samples were vortexed and centrifuged for 20 minutes at 2200g. The supernatants were transferred to new 96-well plates for analysis by LC-MS/MS. The interpolated concentration of phthalazone metabolite per well was plotted against incubation time to determine the initial velocity (v) at each concentration of substrate. Nonlinear fits of reaction velocity against nominal substrate concentration [S] were obtained using Prism 6 software (GraphPad Software, Inc., San Diego, CA) according to the following Michaelis-Menten equation, where Vmax represents the maximal velocity and Km is the drug concentration at the half-maximal velocity:
 (1)
(1)Liquid Chromatography–Mass Spectrometry Analysis.
Samples (5 μl) were injected into a Unisol C18 reversed-phase column (2.1 × 30 mm, 5 μm; Agela Technologies, Newark, DE) using a CTC Analytics PAL (LEAP) autosampler (CTC Analytics AG, Zwingen, Switzerland) and Agilent 1100 series binary pumps (Agilent Technologies, Palo Alto, CA). An API 4000 mass spectrometer (AB Sciex, Foster City, CA) using electrospray ionization in positive multiple reaction monitoring mode was used to detect the following m/z transitions: 6β-hydroxytestosterone (305 > 269), 6β-hydroxytestosterone-d3 (308 > 272), 1′-hydroxymidazolam (342 > 203), and 1′-hydroxymidazolam-13C3 (345 > 206). A similarly configured system with an API 5500 mass spectrometer (AB Sciex) was used for the following m/z transitions: VX-509 (393.2 > 266.4), M3 (409.2 > 282.2), phthalazine (131.1 > 77.2), and phthalazone (147.1 > 90.0). Injection volumes were increased to 20 μl to increase sensitivity when analyzing M3 samples from the recombinant AO experiment. The analytes were eluted using a gradient method with a flow rate from 0.8 to 1.8 ml/min. Mobile phase A was 10 mM ammonium acetate in water (pH 4.0), and mobile phase B was 50:50 acetonitrile/methanol. Peak areas were determined using Analyst software (version 1.6; AB Sciex) and expressed as a ratio of the analyte to internal standard. The peak area ratios from testosterone and midazolam metabolism experiments were used for relative activity calculations. Concentrations of VX-509, M3, phthalazine, and phthalazone were interpolated from calibration curves.
High-resolution mass spectrometry analyses were performed using an LTQ-Orbitrap Discovery (Thermo Scientific) with electrospray ionization in the positive mode with a heated electrospray interface. The system was equipped with a Thermo Accela pump and autosampler and a HALO C18 fused core column (2.1 × 100 mm, 2.7 µm; MAC-MOD Analytical, Chadds Ford, PA). Mobile phase A was water/acetonitrile (95:5) with 0.1% formic acid, and mobile phase B was acetonitrile/water (95:5) with 0.1% formic acid. The program started and stayed at 5% B for 1 minute at 0.30 ml/min, and separation was achieved with a linear gradient of 5–25% B over 13 minutes, 25–95% B over 1 minute, followed by a 2-minute rinse with 95% B. The column was re-equilibrated at initial conditions for 6 minutes. To minimize contamination of the mass spectrometer source, the first half minute of each run was diverted to waste using the switching valve.
Analysis of cytosol samples was performed using the data-dependent acquisition technique to determine the possible structures of the metabolites. The scan event cycle was used as a Fourier transform full-scan mass spectrum with m/z 100–1200 at 30,000 resolution, and the most abundant ion from the full scan or in the parent mass list (m/z of 393.2, 409.2, 413.2, 425.2, 427.2, 585.2, 601.2) triggered a dependent MS2 collision-induced dissociation scan. The most abundant product ion in the MS2 scan was set to further trigger a MS3 scan. Minimum signal required was 20,000 counts for MS1, 1000 counts for MS2, and 32% for MS3, and isolation width was 2 amu with 0.250 activation Q. Data were processed using Xcalibur 2.0 software (Thermo Scientific).
Hepatocyte Culture.
Cryopreserved hepatocytes (Table 1) were thawed in a 37°C water bath for 2 minutes and transferred into a warm conical tube of Universal Cryopreservation Recovery Medium. Cells were centrifuged at 100g for 10 minutes at room temperature. Supernatant was discarded, and pelleted hepatocytes were gently resuspended in hepatocyte plating medium. Viable cell concentration was determined by fluorescent acridine orange/propidium iodide staining using a Nexcelom Cellometer, and hepatocytes were seeded in collagen-coated, white, clear-bottom, 96-well plates at a density of 8 × 10⁴ cells/well. Plates were incubated in a humidified chamber at 37°C and 5% CO2 for 4 hours to allow cell attachment. Plating medium was replaced with maintenance medium and incubated overnight prior to initiating metabolism experiments.
Hepatocyte donor demographic information
Time-Dependent Inhibition of CYP3A4 using Plated Cryopreserved Human Hepatocytes.
The enzyme kinetic assay was adapted from the procedure described by Doshi and Li (2011). Inhibitor solutions were prepared from stocks dissolved in acetonitrile, so that the final concentration of organic solvent in all incubations was 0.5%. After approximately 24 hours in culture, maintenance medium was removed to waste by plate inversion. Hepatocyte monolayers were washed once and covered with 50 µl of fresh medium. At designated times, 50 µl of 2× inhibitor or vehicle-containing solutions was added in triplicate to initiate the preincubation period. Compounds were tested at nine concentrations ranging from 0.1-50 µM (except the potent inhibitors mibefradil and troleandomycin, which were assayed from 0.01 to 5 µM). Several (four to six) time points were collected up to 30 minutes to ensure linearity of inactivation, with each preincubation time point separated on individual 96-well plates. Once the preincubation period elapsed, test inhibition solutions were quickly removed by inversion and gently washed three times in phosphate-buffered saline buffer. To minimize competitive inhibition, hepatocytes were subsequently incubated in maintenance medium for a 60-minute equilibration period prior to introducing the probe substrate. Remaining CYP3A4 activity in the hepatocytes was quantified as conversion of LIPA, a specific luminogenic substrate (Doshi and Li, 2011). Pilot studies with LIPA determined activity to be linear in the assay format through 120 minutes, with a Km of 3.3 µM. Next, medium was replaced with LIPA substrate (3 µM) and incubated for 30 minutes. Fifty microliters of incubate was transferred to a separate white-walled plate and combined with 50 µl Luciferin Detection Reagent (Promega). Luminescence was quantified using a Tecan Infinite F200 reader (Männedorf, Switzerland).
Plated hepatocyte IC50 shift experiments were performed similarly; however, the 60-minute equilibration period was omitted. Instead of washing away the test inhibitor, luminogenic substrate was added to wells in an equal volume of 2× solution containing matching concentrations of test inhibitor. For experiments to inhibit AO, 25 µM hydralazine was preloaded for 30 minutes and subsequently included at a matching concentration and equivalent volume in test inhibitor and substrate solutions.
Viability Determination.
The relative quantity of viable hepatocytes was assessed following all LIPA incubations to ensure that differences in activity were not attributable to hepatocyte loss or toxicity. The CellTiter-Fluor reagent (Promega) is a fluorogenic peptide substrate cleaved by constitutively expressed live-cell proteases. The reagent was prepared and incubated according to the manufacturer’s protocol. Fluorescence was measured using a Tecan Safire reader.
Data Analysis.
CYP3A4 activity, as measured by luminescent detection of luciferin cleaved from the luciferin-IPA substrate, was normalized to viability assay data. The relative viability of individual wells was used to control for variation in hepatocyte quantity attributable to loss during assay-wash and medium-replacement steps. If relative viability of a well was less than 80%, it was removed from the analysis. Relative viability was calculated and applied as follows:
 (2)
(2) (3)
(3)where RLU is the relative light unit obtained by the luminescence reader. Normalized CYP3A4 activity results were expressed relative to solvent-treated conditions at each time point according to the following equation:
 (4)
(4)The natural log of the percentage of activity remaining was plotted against preincubation time to determine the initial slope (−kobs) at each concentration of inhibitor. Apparent kinetic parameters of inactivation were determined by nonlinear regression of kobs against the nominal concentration ([I]). Nonlinear fits were obtained using Prism 6 software (GraphPad Software, Inc.) according to the following equation, where kinact represents the maximal inactivation velocity, and KI is the drug concentration at the half-maximal inactivation rate:
 (5)
(5)The in vitro inactivation parameters kinact and KI were used to estimate clinical DDIs affecting the CYP3A4 clearance pathway. The magnitude of interaction relates the systemic exposure of a CYP3A4 substrate administered in combination with an inhibitor, relative to its exposure in monotherapy. The AUC ratio (fold change of midazolam AUC) was predicted using the following equation:
 (6)
(6)where AUCi/AUC is the predicted fold change of clinical midazolam exposure when coadministered with an inhibitor (AUCi) relative to the control state (AUC), fm(CYP3A4) is the fraction of total clearance attributable to CYP3A4 (midazolam, 0.93), Fg is the fraction of substrate that passes intact through the intestine (midazolam, 0.57), [I]in vivo is the free systemic concentration of inactivator (Cmax × fu), and kdeg, CYP3A4 is the enzyme’s in vivo degradation constant in the gut (0.00048 minute−1) or hepatocyte (0.00032 minute−1) (Albaugh et al., 2012).
The enterocytic concentration of inactivator ([I]g) during absorption was calculated as follows:
 (7)
(7)where D is the oral dose, ka is the absorption rate constant (0.03 minute−1), and Qg is intestinal blood flow (248 ml/min). Fa is the fraction of inactivator absorbed, and was assumed to be complete (Fa = 1) for a top-limit estimation (Albaugh et al., 2012).
Results
System-Dependent Inhibition of CYP3A4 by VX-509 and M3 Metabolite.
The potential for VX-509 to reversibly inhibit CYP3A4 was evaluated using HLMs. VX-509 was found to be a weak competitive inhibitor using testosterone or midazolam as substrate (IC50 = 10 and 28 µM, respectively). To determine the additional liability of TDI, VX-509 was preincubated with NADPH-fortified HLM for up to 30 minutes before the reactions were diluted into probe substrate solution (testosterone). At test concentrations up to 50 µM, there was no discernible inactivation of CYP3A4 with exposure to VX-509 over time. When using microsomal fractions, the rate of inactivation did not reach significance (kobs = 0.003 minute−1; Fig. 1). This value is similar to the vehicle control and much lower than what is considered a meaningful result based upon internal validation data (not shown) for the assay (kobs > 0.012 minute−1). As expected, mifepristone, the positive control, decreased CYP3A4 activity with time (kobs = 0.05 minute−1).

Inactivation plots of the natural log of the percentage of CYP3A4 activity remaining relative to control versus preincubation time. The inactivation rate constants (kobs) for VX-509 and its metabolite (M3) were determined as the negative slope for experiments containing either HLMs or human hepatocytes (HHep). The probe substrate used for the studies with HLM was testosterone, whereas LIPA was used for the human hepatocyte studies. Following exposure to 50 µM VX-509, observation of TDI was system-dependent, with kobs of 0.003 minute−1 in HLM compared with 0.017 minute−1 in HHep. In contrast to similar incubations with the parent molecule, rapid TDI is reproduced in the HLM assay with 1 µM M3 (kobs = 0.047 minute−1). The system-dependent outcome is attributable to the deficiency of aldehyde oxidase in HLM preparations. Aldehyde oxidase is necessary to metabolize VX-509 to the reactive M3 species, which inactivates CYP3A4.
Although the liver microsomal assay suggests VX-509 has low risk for TDI, a contrasting positive result was observed by using intact human hepatocytes. After 30-minute exposure to 50 µM VX-509, the remaining CYP3A4 activity in hepatocytes was reduced to 67% relative to vehicle. The measured decrease in activity over time was linear through 30-minute preincubation, and kobs was calculated as 0.017 minute−1 (Fig. 1), a significantly different outcome from the negative TDI finding with HLMs.
Despite the inability to observe TDI in microsomal incubations with the parent molecule, its hydroxyl M3 metabolite gives a strong TDI response in the same assay (Fig. 1). With kobs = 0.047 minute−1, M3 is a potent time-dependent inhibitor of CYP3A4. M3 was also assessed as a competitive inhibitor of CYP3A4 and found to have an IC50 of 0.5 µM with testosterone and 2.4 µM with midazolam.
M3 Metabolite Formation and Structural Determination.
The M3 metabolite of VX-509 was initially produced by incubating VX-509 in liver cytosol (Fig. 2). A greater concentration of M3 was formed in monkey cytosol relative to human (Fig. 3, A and B), which is consistent with findings that monkey liver preparations generally have higher AO activity than human liver preparations (Sahi et al., 2008). The M3 metabolite was also observed when VX-509 was incubated in a preparation of recombinant aldehyde oxidase isolate, further confirming AO’s implication in the pathway. The resultant M3 concentration in the reactions increased linearly over the course of a 60-minute experiment (Fig. 3C). P450 phenotyping studies with VX-509 using supersomes indicated that M3 is formed at very low levels, primarily by CYP3A4, which could be the reason for the lack of in vitro CYP3A4 TDI observation when using microsomes.

Chemical structure of VX-509 and the proposed scheme of its oxidation via aldehyde oxidase to form M3 metabolite. M3 is a potent time-dependent inhibitor of CYP3A4.

LC-MS chromatograms showing formation of M3 (11.2 minutes) from a 2-hour incubation of 10 μM VX-509 (12.3–12.4 minutes) in monkey (A) and human cytosol (B). (C) Time-linear increase in M3 concentration when 1 µM VX-509 was combined with aldehyde oxidase isolates. Error bars represent the standard deviation. RT, retention time.
In addition to LC-MS methods, the structure of M3 was characterized using nuclear magnetic resonance (NMR) spectroscopy (Supplemental Fig. 1). There are 12 protons observed in VX-509 and 11 in the M3 metabolite (Supplemental Figs. 2-4). The missing proton is a singlet at position 1 (8.17 ppm), the only one not coupled to other protons in the two-dimensional homonuclear correlation spectroscopy (COSY) spectrum (Supplemental Figs. 5 and 6). The same number of nonequivalent carbon atoms is present in both compounds as shown in the broad-band decoupled carbon spectra (18 total) (Supplementary Figs. 7-9). In the Distortionless Enhancement by Polarization Transfer 135 experiment for CHn multiplicity determination (similar to an Attached Proton Test: CH and CH3 carbon groups are positive, CH2 is negative in intensity, and quaternary carbons are not observed), the CH peak at 130.76 ppm disappears from the VX-509 spectrum, but an additional quaternary peak can be seen in the carbon spectrum of the M3 metabolite (Supplementary Fig. 10). The chemical shift suggests a carbonyl group has taken the place of the methane carbon at position 1. Further confirmatory NMR scans were performed to correlate proton-carbon single bonds (Supplementary Figs. 11 and 12) and long-range proton carbon associations (Supplementary Figs. 13 and 14).
A chemical standard of the proposed metabolite was synthesized, and the structure was independently verified by NMR. The synthetic standard was also confirmed by liquid chromatography coelution with M3 generated by in vitro incubations (Figs. 4 and 5).

Liquid chromatography retention time of VX-509 and M3 from synthetic standards (A) and in vitro monkey cytosol incubation (B). RT, retention time.

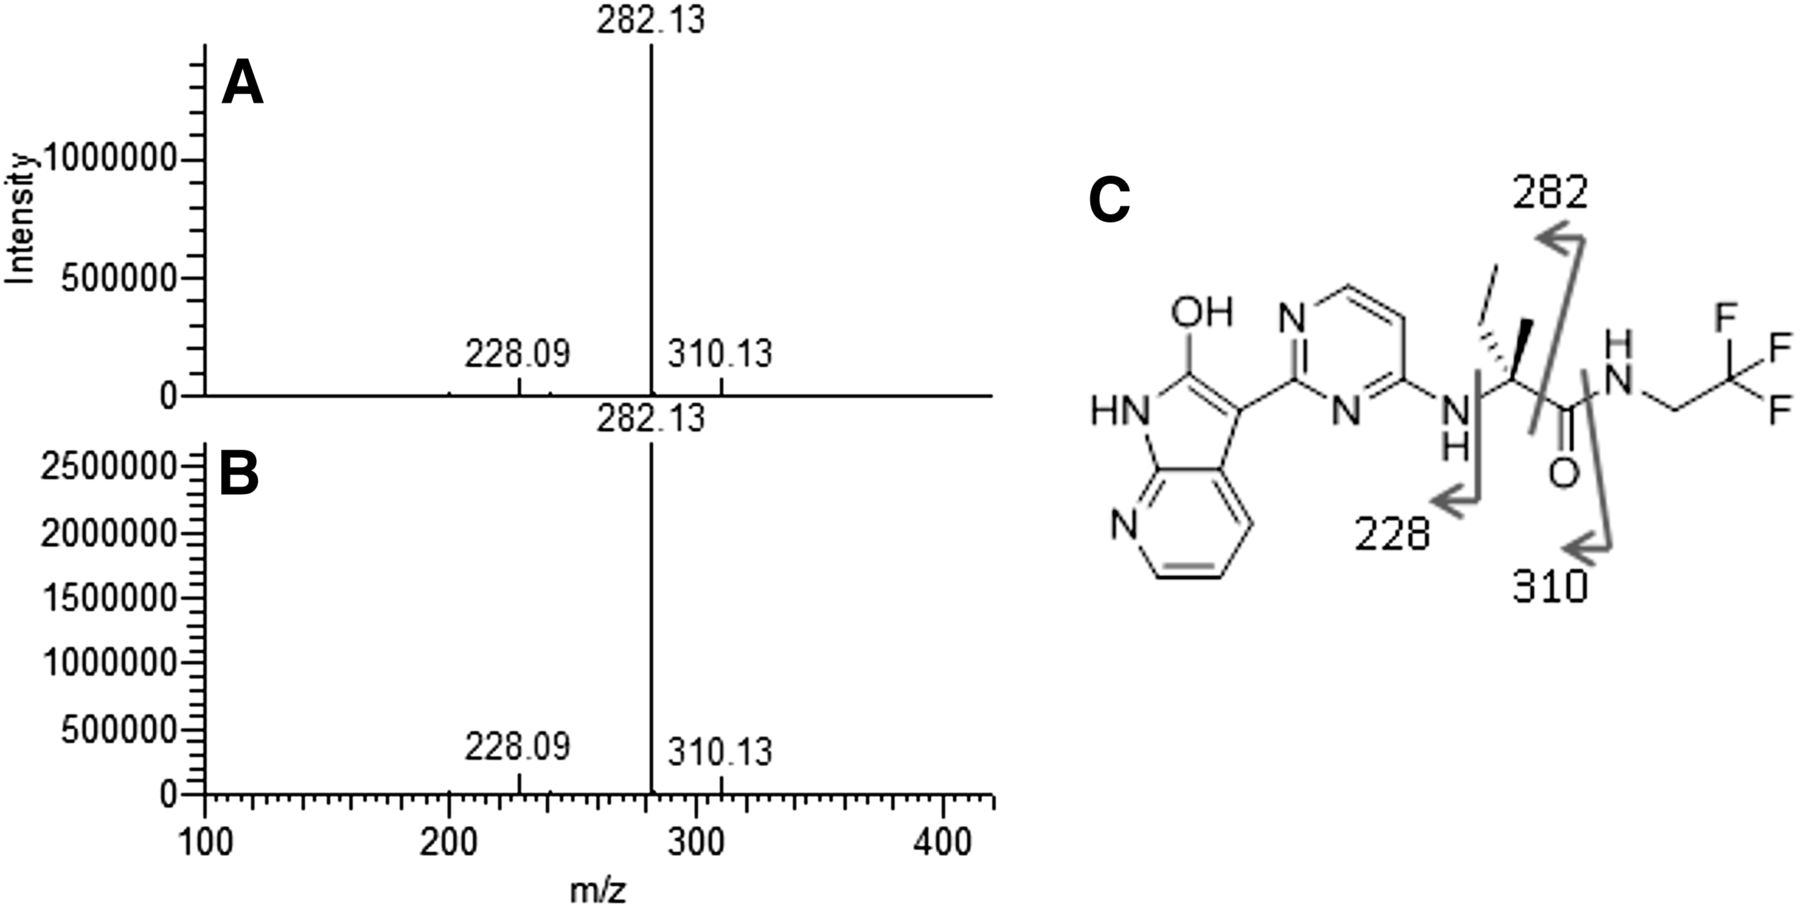
MS2 fragmentation of M3 standard (A) and M3 from in vitro monkey cytosol incubation (B). (C) Sites of fragmentation on M3 structure.
Aldehyde Oxidase Activity in Cultured Human Hepatocytes.
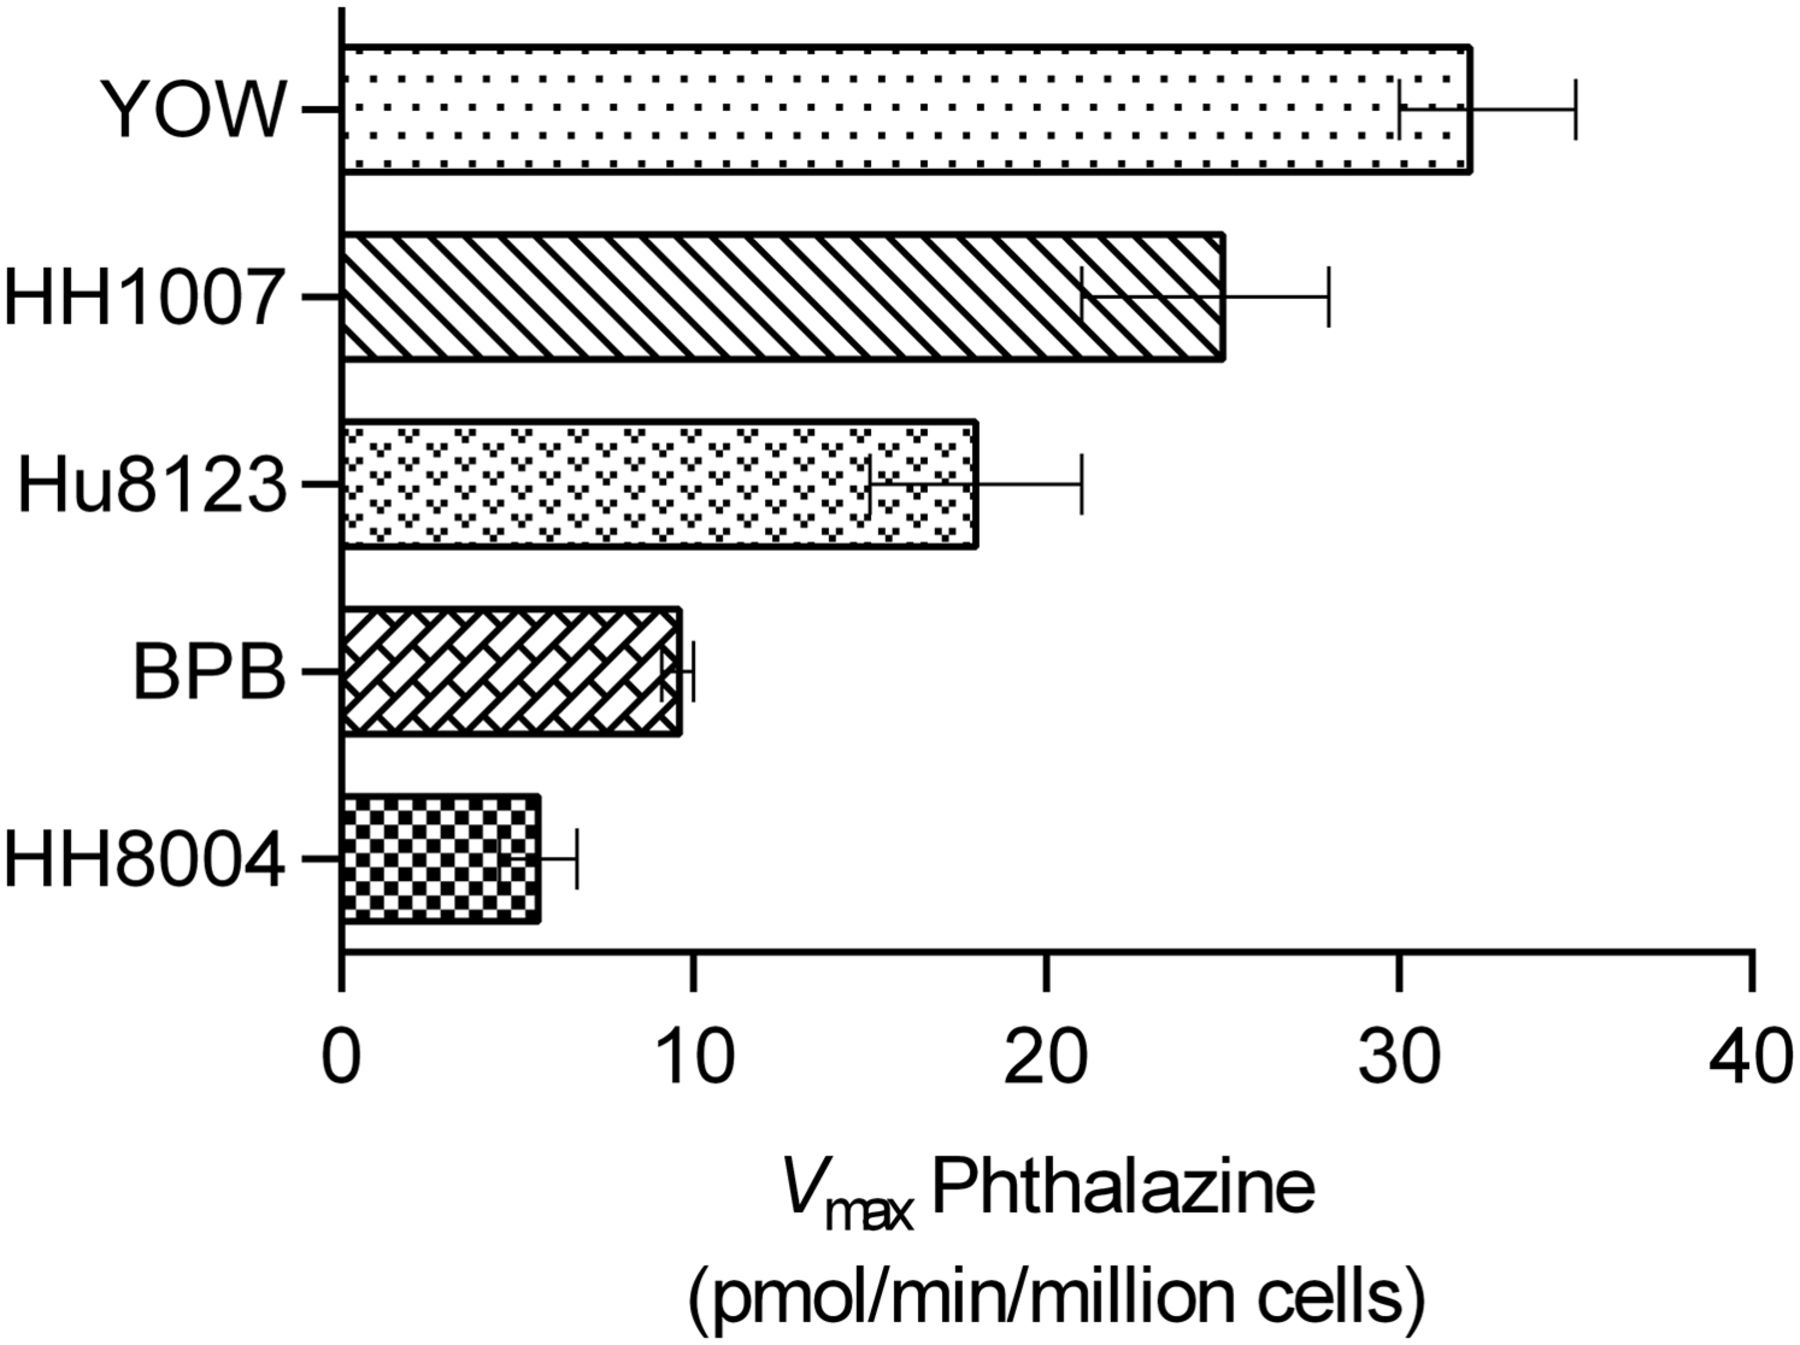
Five cryopreserved lots of hepatocytes were assessed for AO activity. The apparent activity was measured using the formation of the metabolite phthalazone from phthalazine, as measurable in hepatocyte incubation medium. Phthalazine was found to be a high-affinity substrate for AO in the assay, with fairly consistent Km between 0.4 and 0.8 µM. AO activity (Vmax) ranged from 5.6 to 32 pmol/min/million cells in the various preparations, with YOW at the top of the range and HH8004 at the low end (Fig. 6). The characterization of AO activity provided confidence that these lots of cryopreserved hepatocytes were suitable for cultured TDI experiments with VX-509.

Comparison of hepatocyte donor capacity to metabolize phthalazine via aldehyde oxidase. Activity was determined as the maximal velocity (Vmax) and ranged from 32 (YOW) to 5.6 pmol/min/million cells (HH8004). Error bars represent the 95% confidence interval of the best-fit Vmax. The Km was fairly consistent between lots, from 0.4 to 0.8 µM (not shown).
Calibration of Hepatocyte CYP3A4 TDI Assessment with Published Data.
The inactivation constants for the validation set derived using donor HH8004 are reported in Table 2, including the ratio of kinact/KI. Mibefradil and troleandomycin were observed to have strong inactivation potential in the assay, with KI values of 0.2 and 0.1 µM and kinact values of 0.2 and 0.04 minute−1, respectively. The ratio of kinact/KI also suggests that mibefradil and troleandomycin are the most potent time-dependent inhibitors in the set, with respective inactivation ratios of 1400 and 345 ml/min·µmol. These values are in agreement with what was determined by Albaugh et al. (2012), who similarly evaluated a plated hepatocyte assay, but used midazolam as probe substrate. Verapamil and clarithromycin were observed to have relatively moderate inactivation potential. The KI was determined to be 1.6 and 5.2 µM, and kinact was 0.02 and 0.07 for verapamil and clarithromycin, respectively. The KI of 1.6 µM corresponds to the reported value of 1.9 µM (Albaugh et al., 2012). The lower kinact of 0.02 minute−1 in our assay compared with 0.08 minute−1 accounts for the difference in inactivation ratios (13 vs. 74). Clarithromycin data are in agreement within the groups (kinact: 0.07, 0.09; KI: 5.2, 8.1; kinact/KI: 13, 11). Erythromycin was determined to have a kinact of 0.08 minute−1 and KI of 10 µM. The inactivation constants reported by McGinnity et al. (2006) are concordant between laboratories (kinact = 0.07 minute−1, KI = 11 µM).
Comparison of kinetic inactivation parameters with published values using similar plated hepatocyte assays
In vitro parameters of inactivation were used to predict DDI, and were compared with published clinical study data. The kinact and KI for each compound were determined using plated hepatocytes (Table 2). These values, along with clinical study data from Table 3, were input into eq. 5 (Obach et al., 2006) to estimate the fold AUC reduction of midazolam, a clinical CYP3A4 substrate (Table 4). Troleandomycin and mibefradil were predicted to perpetrate the largest increases in midazolam exposure, at 24- and 16-fold, respectively. This compared well with the clinical observation of 15- and 9-fold increases, respectively. Next, clarithromycin was predicted to increase AUC 12-fold, which was favorable against the published study data (7-fold). Finally, erythromycin and verapamil were both predicted to increase exposure of midazolam 4-fold due to TDI of CYP3A4, which is accurate when compared to the clinical situation that was reported as 3- and 4-fold. The predictions using these in vitro parameters tended to slightly overpredict the clinical response for this series of compounds; however, the static model used does not take into account the potential of P450 induction. All predicted DDIs were within 2-fold of the observed clinical response and correctly rank-ordered the drugs’ capacity for DDI.
Summary of clinical parameters applied to drug-drug interaction predictions
Prediction of drug-drug interactions from in vitro parameters of time-dependent inhibition
Hepatocyte CYP3A4 IC50 Shift TDI Assessment for VX-509.
Using plated hepatocytes for IC50 shift studies (lot HH1007), time-dependent CYP3A4 inhibition was observed in the presence of VX-509, indicating that the in vitro system contains the key enzymatic intermediary necessary to convert the parent to the inactivating M3 species. The IC50 of VX-509 was determined to be 6.2 µM; however, the inhibitory potency increases nearly 2.5-fold following a 30-minute preincubation (2.5 µM) (Fig. 7). To determine if the effect was inhibitable through AO, parallel experiments were performed in the presence of an AO inhibitor, hydralazine (25 µM). At this concentration, hydralazine is specific, inhibiting >90% of AO activity with negligible effect on CYP3A4 (Strelevitz et al., 2012). In hydralazine-containing wells, there was no time-dependent effect of VX-509 against CYP3A4, with IC50 = 7.4 and 6.3 µM in 0- and 30-minute preincubation groups. The IC50 ratio in the presence of hydralazine is not statistically distinguishable from 1 (P = 0.13); however, without AO inhibition, the observed 2.5-fold IC50 shift is significant (P < 0.0001).

IC50 shift plot of percentage of CYP3A4 activity remaining with increasing concentration of VX-509. (A) In human hepatocytes (HHep), the IC50 at which VX-509 inhibits CYP3A4 shifts significantly from 6.2 to 2.5 µM following preincubation, indicating time-dependent inhibition. (B) In simultaneous experiments containing 25 µM hydralazine, an inhibitor of aldehyde oxidase, no IC50 shift is observed (IC50 = 7.4 and 6.3 µM at 0 and 30 minutes, respectively). Each data point represents the mean of triplicate wells, and error bars reflect the standard deviation.
Hepatocyte CYP3A4 Kinetic TDI Assessment for VX-509.
In a clinical DDI study, VX-509 increased the exposure of midazolam 12-fold (AUC). To determine if this DDI can be predicted using hepatocytes, VX-509 was incubated using five different cryopreserved donors (Table 1), including a five-donor pooled plateable lot (8004). Even with the degree of discrepancies observed between lots (Fig. 8), when using plated hepatocytes, VX-509 is a clear TDI of CYP3A4, with the observed kinact ranging from 0.02 to 0.08 minute−1 and KI ranging from 1.3 to 5.2 µM (Fig. 9). When these assay-determined inactivation parameters are input into eq. 5 along with the dose, systemic concentration, and plasma protein binding data (Table 3), we predict that VX-509 would be a significant perpetrator of DDI in the clinical setting. The predicted AUC increase of midazolam when codosed with VX-509 ranged from 9- to 21-fold, which brackets the clinically observed value of 12-fold (Table 5) (Huang et al., 2014). Although the parent molecule, VX-509, does not inhibit CYP3A4 in a microsomal system, its M3 metabolite is observed to be a potent TDI perpetrator under similar conditions. Using HLMs, M3 was found to have a kinact of 0.07 minute−1 and KI of 0.4 µM. Similar to the VX-509 hepatocyte results, microsomal inactivation data with the reactive M3 metabolite predict a 13-fold AUC increase. However, HLM is an inadequate system to capture the time-dependent liability when assaying VX-509, and results in a false negative for the clinical DDI.

Plot of in vitro inactivation parameters determined using multiple donors of human hepatocytes. The ratios of kinact to KI for five drugs and VX-509 are presented and compared with published values.

Nonlinear regression of kobs against concentration of VX-509 to determine kinact and KI in five lots of hepatocytes [YOW (A), HH1007 (B), BPB (C), Hu8123 (D), and HH8004 (E)]. Data are presented in Table 5.
Prediction of VX-509 drug-drug interaction from in vitro parameters of time-dependent inhibition
Discussion
In vitro approaches are increasingly being used to predict clinical DDI risks associated with new chemical entities. Successful predictions can result in decreased compound attrition during drug development due to unexpected DDIs in the clinic and can consequently reduce the cost and time associated with failed clinical trials. Because of the primary role of P450 enzymes in drug disposition, there is a need for better tools to effectively predict the potential for clinical DDI from in vitro data when the inhibition is mechanism-based (Gorski et al., 1998; Kharasch et al., 2004; Okudaira et al., 2007). Although TDI is generally evaluated using HLM, there are several classic examples which illustrate the limitations of this model when the perpetrating metabolite is formed via a non-P450–mediated pathway (Backman et al., 2002; Guzey et al., 2002; Tornio et al., 2014).
Gemfibrozil inhibits the metabolism of the potent cholesterol-lowering drug cerivastatin, which was withdrawn from the U.S., European, and Japanese markets because it caused a relatively high incidence of rhabdomyolysis (Backman et al., 2002). Initial in vitro studies to account for the pharmacokinetic interaction between gemfibrozil and cerivastatin revealed that the potency with which gemfibrozil inhibited OATP1B1, CYP3A4, and CYP2C8 was not significant enough to account for its effect on clinically observed cerivastatin pharmacokinetics. Further studies indicated that gemfibrozil is extensively conjugated to form a relatively stable acyl glucuronide (Shitara et al., 2004), which is a potent TDI of CYP2C8 (Ogilvie et al., 2006). In fact, the IC50 value for CYP2C8 inhibition by gemfibrozil in hepatocytes (IC50 = 1.7 µM) is 88-fold lower than the corresponding IC50 value obtained with studies using HLMs (IC50 = 150 µM), which corresponds well to the published IC50 value for CYP2C8 inhibition in HLM with gemfibrozil glucuronide (IC50 = 1.8 µM) (Ogilvie et al., 2006). Similarly, recent data suggest that glucuronidation converts clopidogrel to a strong TDI of CYP2C8, which results in significant DDIs with cerivastatin and repaglinide (Tornio et al., 2014). In this example as well, clopidogrel was converted to the acyl-β-d-glucuronide, and in vitro studies with HLM indicate this to be a potent CYP2C8 TDI. Finally, even though bupropion is primarily metabolized by CYP2B6, it causes clinically significant inhibition of the metabolism of several CYP2D6 substrates, including dextromethorphan (Guzey et al., 2002; Kotlyar et al., 2005). Reese et al. (2008) reported that the ability of bupropion to inhibit CYP2D6 depends, at least in part, on its reduction to erythro- and threo-hydroxybupropion presumably by CBR or AKR, both of which are enzymes present in cytosol (Reese et al., 2008; Penning, 2015). In HLMs, bupropion is a relatively weak competitive inhibitor of CYP2D6 (IC50 = 79 µM). In human hepatocytes, however, bupropion is a relatively potent inhibitor of CYP2D6 with a 30-minute preincubation, resulting in an IC50 of 9.2 µM (Reese et al., 2008; Parkinson et al., 2010). In all three of the aforementioned examples, human hepatocytes have been shown to be the more appropriate in vitro system to predict clinical outcome.
The success of human hepatocytes for TDI-based DDIs can be directly ascribed to the fact that the hepatocytes have an intact plasma membrane with the full complement of hepatic drug metabolic enzymes and transporters together with key cofactors which allow for complete and uninterrupted metabolism to occur (Hewitt et al., 2007; Godoy et al., 2013). As such, hepatocytes represent a system that is more physiologically relevant and offers the opportunity to conduct longer incubations. Traditionally, TDI assessment is conducted using pooled human hepatocytes in suspension (Zhao, 2008; Xu et al., 2009; Mao et al., 2016); however, although the use of cultured hepatocytes can be time- and labor-intensive with lower throughput, there are certainly key advantages to using cultured hepatocytes as opposed to hepatocytes in suspension. First, the use of cultured hepatocytes for TDI assessment becomes particularly useful when mechanistic studies are being conducted for compounds which both induce and inhibit metabolic enzymes. Several publications highlight the work conducted in sandwich-cultured hepatocytes to provide a mechanistic understanding of clinically observed DDIs for human immunodeficiency virus protease inhibitors which are known to be inducers and TDIs of multiple P450s (Kirby et al., 2011a,b). Another advantage of using cultured hepatocytes is that hepatocytes maintain their polarity in culture (Lundquist et al., 2014), which is particularly important when perpetrators of DDIs are also substrates of uptake and efflux transporters. Earlier, we described the DDIs observed between gemfibrozil and cerivastatin as well as bupropion and dextromethorphan, where the involvement of transporters in the observed DDI cannot be excluded (Parkinson et al., 2010).
Albaugh et al. (2012) assessed the utility of freshly prepared plated hepatocytes, cryopreserved plated hepatocytes, and plated HepaRG cells for the estimation of TDI parameters using a subset of compounds with clinically observed DDIs due to CYP3A4 TDI. In general, the estimated DDIs derived from each of the tested systems agreed with the clinically reported DDI within approximately 2-fold. Our studies were conducted using plated cryopreserved hepatocytes due to the availability of cells from multiple donors. One major advantage of this is that the lots can be validated using known TDIs with clinically observed DDIs (Tables 2 and 4), which also provides the opportunity to assess the risk of DDIs with compounds in development compared with known TDIs in the clinic. Similar to Albaugh et al. (2012), the AUC changes predicted across different lots resulted in fairly similar outcomes (Fig. 8). The inactivation constants for the validation set derived using the pooled donor HH8004 are reported in Table 2, including the ratio of kinact/KI. These values are in agreement with what was determined by Albaugh et al. (2012) using a similar approach. In vitro parameters of inactivation were used to predict DDI and were compared with published clinical study data. The predictions using these in vitro parameters tended to slightly overpredict the clinical response for this series of compounds; however, the static model used does not take into account the potential of P450 induction (Table 4). All predicted DDIs were within 2-fold of the observed clinical response, and we were able to correctly rank-order the drugs’ capacity for DDI.
Hutzler et al. (2014) concluded that AO activity in cryopreserved hepatocytes more closely represented the activity observed in fresh hepatocytes that were incubated immediately after isolation for the same donors (within 81% of fresh, range 48–100%). Activity of AO in cryopreserved hepatocytes from 75 donors varied by at least 17-fold (≤5.4–90 ml/min per kilogram of body weight), with 63% of the donors having higher activity than a pooled 19-donor lot (34.2 ml/min per kilogram). All of the aforementioned studies assessed AO activity in suspended hepatocytes with no reported assessment of activity in monocultured hepatocytes. Given the involvement of AO in the formation of metabolite M3, we sought to verify that the AO pathway is functional in the cryopreserved hepatocyte batches that were used. To our knowledge, no other groups have looked at AO activity in monocultured human hepatocytes using phthalazine as an AO substrate and monitored the formation of the AO-specific metabolite phthalazone (Obach, 2004; Obach et al., 2004). We characterized the difference in phthalazone formation across the five lots of hepatocytes (Fig. 6), which could be due to slightly different handling, by vendors, when harvesting the hepatocytes (Duley et al., 1985). Having confirmed the functionality of the AO pathway in our assay and batches of hepatocytes, we conducted TDI experiments with VX-509 and were able to successfully determine KI and kinact data, which was not possible using HLMs (Table 5). Using these data generated in hepatocytes, we were able to predict the clinically observed DDI with midazolam in all five hepatocyte donors (Table 5). Interestingly, the DDI predictions roughly correspond to phthalazine Vmax for respective donors, suggesting AO activity could impact the severity of TDI observed in vitro. As an additional step to further establish the involvement of AO in the observed TDI, we conducted studies in the presence and absence of hydralazine, which is known to be a specific inhibitor of AO in human hepatocytes at concentrations of 25–50 µM (Strelevitz et al., 2012). As can be seen in Fig. 7, the presence of hydralazine shifts the IC50 from 2.5 to 6.3 μM.
In this study, we provide a mechanistic basis for the DDI that was observed in the clinic when VX-509 was coadministered with midazolam, atorvastatin, and methylprednisolone (Huang et al., 2014). We identified a hydroxyl metabolite (M3) of VX-509 which is formed via the AO pathway, which may be the perpetrator of the observed DDIs (Fig. 2). AO is a cytosolic enzyme not present in HLM, and the example of VX-509 adds to the system-dependent prediction of TDI with human hepatocytes.
Acknowledgments
The authors thank Lifang Sun, Khisal Alvi, John Pietryka, and Brian Boucher for NMR analyses.
Authorship Contributions
Participated in research design: Zetterberg, Liao, Tsao, Laitinen, Chakilam, Hariparsad.
Conducted experiments: Zetterberg, Liao, Laitinen, Maltais.
Performed data analysis: Zetterberg, Liao, Tsao, Laitinen.
Wrote or contributed to the writing of the manuscript: Zetterberg, Liao, Tsao, Hariparsad.
Footnotes
- Received April 25, 2016.
- Accepted June 10, 2016.
↵
 This article has supplemental rial available at dmd.aspetjournals.org.

Abbreviations
- AKR
- aldo-ketoreductase
- AO
- aldehyde oxidase
- AUC
- area under the curve
- CBR
- carbonyl reductase
- DDI
- drug-drug interaction
- HLM
- human liver microsome
- LC-MS/MS
- liquid chromatography–tandem mass spectrometry
- LIPA
- Luciferin-IPA
- MS
- mass spectrometry
- P450
- cytochrome P450
- TDI
- time-dependent inhibition
- VX-509
- (R)-2-((2-(1H-pyrrolo[2,3-b]pyridin-3-yl)pyrimidin-4-yl)amino)-2-methyl-N-(2,2,2-trifluoroethyl)butanamide
- Copyright © 2016 by The American Society for Pharmacology and Experimental Therapeutics


