


Abstract
Although ocular transport and delivery have been well studied, metabolism in the eye is not well documented, even for clinically available medications such as levobunolol, a potent and nonselective β-adrenergic receptor antagonist. Recently, we reported an in vitro methodology that could be used to evaluate ocular metabolism across preclinical species and humans. The current investigation provides detailed in vitro ocular and liver metabolism of levobunolol in rat, rabbit, and human S9 fractions, including the formation of equipotent active metabolite, dihydrolevobunolol, with the help of high-resolution mass spectrometry. 11 of the 16 metabolites of levobunolol identified herein, including a direct acetyl conjugate of levobunolol observed in all ocular and liver fractions, have not been reported in the literature. The study documents the identification of six human ocular metabolites that have never been reported. The current investigation presents evidence for ocular and hepatic metabolism of levobunolol via non-cytochrome P450 pathways, which have not been comprehensively investigated to date. Our results indicated that rat liver S9 and human ocular S9 fractions formed the most metabolites. Furthermore, liver was a poor in vitro surrogate for eye, and rat and rabbit were poor surrogates for human in terms of the rate and extent of levobunolol metabolism.
Introduction
Although many ocular diseases are limited to treatment of symptoms, an unmet medical need to treat the cause has been the driving force for a variety of ophthalmic drugs in pharmaceutical research and development. Several marketed drugs have been evaluated for topical ocular application (Chastain, 2003). Ocular delivery and transport are well documented; however, ocular metabolism is not well studied. There is sparse evidence for drug-metabolizing enzymes in ocular tissues of some animals—for example, ketoreductase activity in rabbits (Lee et al., 1988), monoamine oxidase in cows (Sparks et al., 1981), and cytochrome P450 mRNA in rats (Nakamura et al., 2005) and humans (Zhang et al., 2008). Recently, we reported a novel in vitro approach to investigate ocular metabolism (Bushee et al., 2015) in an effort to develop a simple, robust, and reproducible model to study ocular disposition of xenobiotics across preclinical species and humans.
Levobunolol (LB) [(S)-5-(3-(tert-butylamino)-2-hydroxypropoxy)-3,4-dihydronaphthalen-1(2H)-one] is the levo-rotatory isomer of bunolol, a potent, nonselective antagonist of β-adrenergic receptors. Although it was initially aimed at cardiovascular pharmacodynamics (Novack, 1986). LB has been used for treatment of primary open-angle glaucoma and ocular hypertension for nearly three decades (Zimmerman, 1993). LB has been approved in the United States for glaucoma due to effective reduction of intraocular pressure and has been well studied for its physicochemical properties, efficacy, selectivity, pharmacodynamic effects, and other side effects in rabbits and humans (Lesar, 1987; Zimmerman, 1993; Frishman et al., 2001). LB is clinically administered as 0.5% solution eye drops. Peak plasma concentrations are achieved between 1 and 3 hours, and the reduction of intraocular pressure is documented to last up to 12 hours with no reports of accumulation of the drug after repeated instillation. After systemic administration, LB showed a total plasma clearance of 0.66 L/h and a large apparent volume of distribution equal to 5.5 L/kg. The elimination half-life was reported to be approximately 6 hours, and when applied topically at pharmacological doses, an accumulation index of 1 has been reported (Gonzalez and Clissold, 1987).
LB has been reported to be metabolized to an equipotent active metabolite, dihydrolevobunolol (DHLB), with a similar systemic half-life. It has been reported that DHLB binds to β-adrenergic receptors with an affinity constant of 3.9 nM, as compared with 6.7 nM for LB (Woodward et al., 1987; Di Carlo et al., 1977). In the eye, formation of DHLB is thought to occur deeper inside the corneal epithelium, and may be limited by passage of LB through the outer layers of corneal epithelium (Ashton et al., 1991). In addition to investigation of DHLB formation, hepatic metabolism of LB has been reported in preclinical species and humans. However, apart from formation of the active metabolite in the corneal epithelium and iris-ciliary body (Lee et al., 1988), LB has not been investigated in detail for its metabolism in the eye.
The objectives of the present investigation were to: 1) contrast the rate and extent of DHLB formation with overall metabolism of LB in ocular and liver subcellular fractions, and 2) investigate the role of ocular and hepatic non–cytochrome P450 metabolism in the disposition of LB. To the best of our knowledge, our investigation is the first comprehensive documentation of in vitro ocular metabolism of LB in rats, rabbits, and humans.
Materials and Methods
Chemicals and Reagents.
LB was obtained from the compound database at Novartis Institutes for BioMedical Research (Cambridge, MA). Ocular S9 fractions (OS9) for rat (ROS9) (5 mg/ml protein content, donor pool of 200 male Sprague-Dawley rats), rabbit (RbtOS9) (5 mg/ml protein content, donor pool of 75 male New Zealand white Rabbits), and human (HOS9) (5 mg/ml protein content, donor pool of 11 mixed gender) were custom ordered from XenoTech LLC (Lenexa, KS). OS9 and liver S9 fractions (LS9) were prepared in accordance with industry standard protocols by the vendors. OS9 were custom prepared from each eye following enucleation and removal of the lens, to aid homogenization. OS9 were derived from the whole eye, consisting of choroid, sclera, retina, aqueous humor, vitreous humor, iris, and ciliary body. LS9 fractions for rat (RLS9) (20 mg/ml protein content, donor pool of 400 male Sprague-Dawley rats) and rabbit (RbtLS9) (20 mg/ml protein content, donor pool of 8 male New Zealand White rabbits) were obtained from XenoTech LLC. Human liver S9 fractions (HLS9) (20 mg/ml protein content, donor pool of 50 mixed gender) were obtained from BD Biosciences (San Jose, CA). All S9 fractions were frozen and stored at −80°C until use. Alamethicin from Trichoderma viride and NADPH were purchased from MP Biomedicals (Solon, OH). Solvents were mass spectrometry grade and were procured through Mallinckrodt Baker (Phillipsburg, NJ). All other reagents were purchased from Sigma-Aldrich (St. Louis, MO).
In Vitro Incubations with LB for Rate and Extent of Metabolism in Ocular and Liver S9 Fractions.
Incubations with LS9 and OS9 were performed in accordance with commonly accepted protocols and by modification of previously reported in vitro protocols (Dalvie et al., 2009). For parent depletion experiments, the final protein concentration of OS9 fractions (ROS9, RbtOS9, and HOS9) was 1.25 mg/ml, and that of LS9 fractions (RLS9, RbtLS9, and HLS9) was 0.31 mg/ml, and the concentration of LB was 1 µM based on linearity with respect to protein and time (data not shown). The protein concentrations were consistent with the fact that levels of drug-metabolizing enzymes are lower in extrahepatic tissues, and that an eye constitutes multiple complex cell types (Mohutsky et al., 2008). For metabolite identification experiments, the final protein concentration of OS9 fractions (ROS9, RbtOS9, and HOS9) and LS9 fractions (RLS9, RbtLS9, and HLS9) was 1.25 mg/ml, and the concentration of LB was 10 µM in accordance with commonly accepted in vitro metabolite identification procedures (Dalvie et al., 2009; Gunduz et al., 2010). The modifications specific to this study include the following for S9 fractions. Alamethicin (25 µg/mg protein) and ethylene diamine tetra-acetic acid (0.1 mM) were added to potassium phosphate buffer (100 mM, pH ∼7.4) and placed on ice for 15 minutes. To this reaction mixture, MgCl2 (1 mM), saccharolactone (5 mM), acetyl-CoA (1 mM), S-adenosyl methionine (0.1 mM), and 3′-phosphoadenosine-5′-phosphosulfate (0.1 mM) were added, and the mixture was preincubated for 5 minutes at 37°C in a shaking heating block (Eppendorf North America, Hauppauge, NY). NADPH (1 mM) and uridine-5′- diphosphoglucuronic acid (5 mM) were added thereafter. Finally, the reaction was started by adding LB. The incubations were carried out for 60 minutes, with an intermittent aliquot withdrawn at 30 minutes for rate experiments relating to depletion of the parent compound, LB. At each time, the reaction was quenched by adding ice-cold acetonitrile. An aliquot at 0 minutes served as a control arm for both the parent depletion and metabolite identification experiments. The quenched reaction was vortex mixed for 1 minute, followed by centrifugation for 10 minutes at 4630 × g. The supernatant from LB depletion experiments was directly injected for liquid chromatography high-resolution mass spectrometry with data-dependent scanning (LC-MSn) analysis. The supernatant from metabolite identification experiments was dried under nitrogen gas, and the residue was reconstituted in 100-µl initial mobile phase conditions, vortex mixed, and analyzed for presence of metabolites. Sample and data analyses are detailed later.
LC-MSn Method for LB Depletion in Ocular and Liver S9 Fractions.
Samples for depletion of LB were analyzed with an Orbitrap Elite mass spectrometer (Thermo Scientific, Waltham, MA) equipped with an Agilent 1100 series HPLC (Agilent Technologies, Santa Clara, CA) and a CTC PAL autosampler (Leap Technologies, Carrboro, NC). Samples were separated on an ACE C18 analytical column (3 μm, 2.1 × 30 mm; Advanced Chromatography Technologies Ltd., Aberdeen, Scotland) equipped with a guard column (0.94 × 0.62 × 0.25 in.; Analytical Sales, Pompton Plains, NJ) over a 10-minute gradient at a 0.25-ml/min flow rate. Mobile phase A consisted of 10 mM ammonium formate buffer, and mobile phase B consisted of acetonitrile. The analyte and metabolites (20-μl injections) were separated over a gradient which began with 10% B for 1 minute, followed by an increase of B to 90% over 4 minutes. This was held for 2 minutes before returning to 10% B over 1 minute and re-equilibrating the column for an additional 2 minutes. The Orbitrap Elite was calibrated in positive electrospray ionization mode, and samples were analyzed under general MS tune parameters. These source parameters included a capillary temperature of 275°C; heated source temperature of 300°C; sheath, auxillary, and sweep gases at 40, 30, and 2 (arbitrary units); source voltage of 4 kV; and a 6% S-lens level. Full scans and collision-induced dissociation (CID) tandem mass spectrometry (MS2) (top two most intense ions from full scan) scans were collected at 30,000 and 15,000 resolution, respectively. MS2 scan events used an isolation width of 1.9, normalized collision energy of 35, and a default charge state of 1. At least eight scans were collected across the LB peak area.
LC-MSn Method for LB Metabolite Identification in Ocular and Liver S9 Fractions.
The samples generated for metabolite identification were analyzed with an Orbitrap‐XL mass spectrometer (Thermo Scientific) by a data‐dependent scanning method with accurate mass measurements. Orbitrap‐XL was interfaced with a 3X Ti HPLC pump and a CTC PAL autosampler (Leap Technologies) as detailed in earlier reported protocols (Bushee and Argikar, 2011) with the following modifications. The analytes were injected as 20-µl aliquots and were separated on a Waters Atlantis T3 analytical column (5 μm, 2.1 × 150 mm; Waters, Milford, MA) with a 35-minute gradient elution method. Sample aliquots were eluted with a flow rate of 0.25 ml/min with B held at 5% over the first 3 minutes. The percentage of B was then linearly increased to 95% over the next 25 minutes and held for 3 minutes thereafter. The column was returned and re-equilibrated at 5% B over the last 4 minutes.
The Orbitrap was calibrated according to the manufacturer’s instructions. The samples were analyzed in positive electrospray ionization mode with capillary voltage of 35 V. MS scan events consisted of a full scan acquired in Fourier Transformation Mass Spectrometry mode at 30,000 resolution and data-dependent scans (a total of nine scan events) by CID and higher energy collision dissociation (HCD). The spectra were obtained with normalized collision energy of 45, charge state of 1, an isolation width of 1.7, and an activation time of 30 milliseconds, as documented previously (Dunne et al., 2013). Stepped normalized collision energy was not enabled. Xcalibur (version 2.0.7 SP1; Thermo Scientific) was used for LC-MSn data acquisition and analysis. Ions depicted at m/z 164 and 195 are resonance overtones associated with this particular Orbitrap instrument and are observed in all exact mass measurements. These ions are unrelated to LB or its metabolites.
Results
LB HCD Product Ion Spectrum Characterization.
In the LC-MSn conditions described earlier, LB showed a protonated molecular ion of 292 and eluting at 14.44 minutes (Fig. 1). HCD product ion spectra provided the following diagnostic fragment ions at m/z 236, 219, 201, 175, and 163. Cleavage of the t-butyl moiety and subsequent loss of ammonia afforded fragment ion m/z 236 and 219, respectively. Loss of water from ion m/z 219 resulted in fragment ion m/z 201. Fragment ion m/z 175 was confirmed by accurate mass measurements to be the ((5-oxo-5,6,7,8-tetrahydronaphthalen-1-yl)oxy)methylium ion. Fragmentation of the ether bond afforded fragment ion m/z 163.

LB base peak chromatogram (A) and HCD MS2 of protonated molecular ion ([M+H]+) m/z 292.1907 (B).
Structural elucidation of M11, DHLB, Reductive Metabolite of LB.
M11 has a protonated m/z value of 294, 2 amu higher than the parent. M11 was retained on the column until 13.11 minutes. Accurate mass measurements strongly indicated the elemental composition to be C17H27NO3, suggesting a net addition of two hydrogen atoms compared with LB. CID MS2 spectrum shows fragment ion m/z 220, which corresponds to the loss of water and the t-butyl group from protonated molecular ion (Supplemental Fig. 1K). M11 was thus identified as DHLB in the liver and ocular S9 fractions in all species.
Structural Rationalization of M1–M10 and M12–M16.
Key MSn fragments for each metabolite and retention times are listed in Table 1. Identification of M1 (Supplemental Fig. 1A), M2 (Supplemental Fig. 1B), M3 (Supplemental Fig. 1C), M4 (Supplemental Fig. 1D), M5 (Supplemental Fig. 1E), M6 (Supplemental Fig. 1F), M7 (Supplemental Fig. 1G), M8 (Supplemental Fig. 1H), M9 (Supplemental Fig. 1I), M10 (Supplemental Fig. 1J), M11 (Supplemental Fig. 1K), M12 (Supplemental Fig. 1L), M13 (Supplemental Fig. 1M), M14 (Supplemental Fig. 1N), M15 (Supplemental Fig. 1O), and M16 (Supplemental Fig. 1P), based on MS2 spectra, is described in detail in the supplemental figures. Eleven of the 16 metabolites of LB identified have never been previously reported. This includes an acetylated primary metabolite of LB, which was found in all OS9 and LS9.
Metabolites of LB
Structures and high-resolution LC-MSn data of in vitro LB metabolites identified in rat, rabbit, and human LS9 and OS9. Proposed metabolite structures are shown, and alternative sites of conjugative metabolism are noted with dashed arrows. Fragmentation is provided for the proposed structures; however, the site of protonation is not provided. A retention time for each metabolite is provided.
LB (1 µM) Depletion in Ocular and Liver S9 Fractions.
RLS9 and RbtLS9 turned over LB such that approximately 40% or less remained after 60 minutes. Less than 15% of LB turnover was observed in HLS9, ROS9, RbtOS9, and HOS9 over an incubation period of 60 minutes. A parent depletion profile with respect to time is illustrated in Fig. 3A.
Discussion
In the present investigation, we determined that LB was metabolized to 16 different metabolites, 11 of which have never been reported. This is the first investigation that characterizes biotransformation pathways of LB in ocular subcellular fractions from rats, rabbits, and humans, via non–cytochrome P450 pathways, which have not been comprehensively investigated to date. Eleven of the 16 metabolites of LB identified in this investigation have not been reported in the literature. This includes a direct acetyl conjugate of LB, which was observed in all OS9 and LS9. Importantly, the study is the first report of six human ocular metabolites of LB. Our results indicated that the liver was a poor in vitro surrogate for the eye, and rats and rabbits were poor surrogates for humans in terms of the rate and extent of levobunolol metabolism. Overall, the rates of metabolism were remarkably lower in OS9 compared with LS9. The extent of metabolism of LB is illustrated as a schematic pathway in Fig. 2. No relationship was observed between rate and extent of metabolism of LB in subcellular fractions from either the liver or eye for any species.
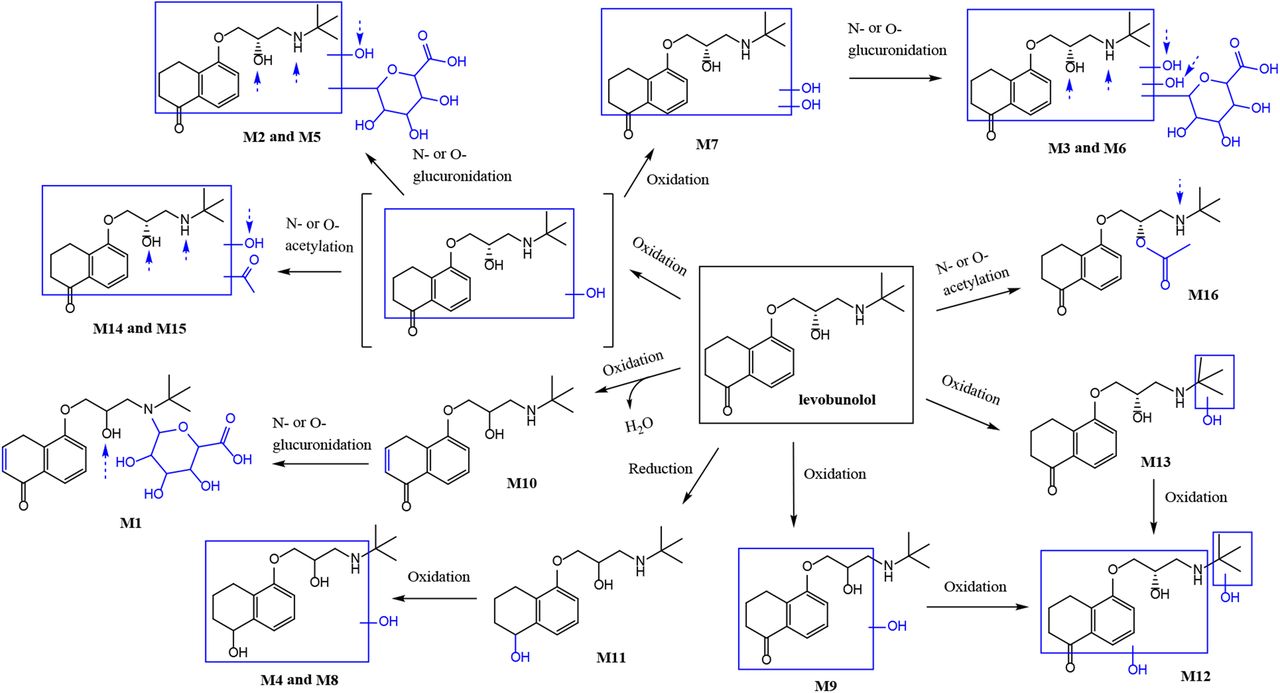
Proposed metabolic scheme for LB in rat, rabbit, and human ocular and liver S9 fractions. Alternative sites of conjugative metabolism are denoted with dashed arrows.
LB was metabolized via reduction to DHLB (M11) in all ocular and liver fractions. In our experiments, the relative formation of M11 (as a percentage of the highest MS peak area) at the end of the incubation period was in the following order: RbtLS9 (1) > HOS9, HLS9 (0.8) > RLS9 (0.2) > RbtOS9 (0.1) > > ROS9 (0.01), as shown in Fig. 3B. Quantification of M11 was not possible without an authentic reference standard. Thus, formation of M11 was highest in RbtLS9, followed by HLS9 and HOS9. For humans, comparable formation of M11 was observed between LS9 and OS9 fractions. For rats and rabbits, formation of M11 was approximately 10-fold lower in ocular S9 when compared with liver S9 fractions. However, M11 in RLS9 fractions was approximately 10-fold lower than in RbtLS9. Collectively, these observations point toward organ and species differences in formation of M11 and provide a new perspective on the increased duration of action of LB due to its active metabolite, DHLB (M11). M11 has previously been identified in urine of rats, dogs, and humans (Leinweber et al., 1977, 1978a,b). M11 has been reported as a pharmacologically active metabolite (Woodward et al., 1987). Formation of DHLB has been characterized in rabbit corneal epithelium and iris-ciliary body in conjunction with transcorneal passage of LB (Chen et al., 1987; Tang-Liu et al., 1987, 1988). In the eye, ketone reductases have been shown to form DHLB from LB, as studied in rabbits (Lee et al., 1988; Ashton et al., 1991).

(A) Depletion of LB (1 µM) in OS9 and LS9 fractions across rats, rabbits, and humans over 60 minutes. Data are represented as mean values of duplicate experiments. Values represent percentage of LB remaining. (B) Relative formation of DHLB, the active metabolite of LB (M11), in OS9 and LS9 across rats, rabbits, and humans is presented as a percentage of the highest MS peak area of M11 at 60 minutes (i.e., RbtLS9 = 100%). Incubations for metabolite identification were carried out at 10 µM LB concentration. Absolute quantification was not possible without an authentic reference standard.
We identified this metabolite even in LS9 from rats, rabbits, and humans, suggesting a strong contribution of carbonyl reductases expressed in the liver. Reduction of LB to M11 has been reported to occur in cytosol, but not microsomes, and is NADPH- (Lee et al., 1988) and pH-dependent (Tang-Liu et al., 1988). Overall, the literature hints at a possible liver cytosolic role (Leinweber et al., 1972) and an even weaker role of an unknown enzyme system in rat and human erythrocytes (Leinweber and Di Carlo, 1974). Lee and coworkers showed via inhibition studies that carbonyl reductases from the short-chain dehydrogenase/reductase family—CBR1, CBR3, and possibly 11β-HSD—play a major role in formation of M11. Carbonyl reductases from the aldoketo reductase family, AKR1B1 and ABKR1B10, along with alcohol dehydrogenase and NADPH dependent quinone reductases may play a minor role. Despite the liver’s predominant drug-metabolizing capacity, the role of liver in formation of this metabolite has not been fully identified until now. It is also possible that the overall contribution of the corneal fractions to the formation of this metabolite may have been overestimated in the previous reports. To the best of the authors’ knowledge, the alternative hepatic enzymes described earlier have not been well characterized in ocular tissues. This finding on ocular and liver formation of M11 also needs to be taken into account for systemically administered LB and for accurate calculation of the fraction of topically (ocular) administered LB that escapes the eye into systemic circulation, as documented previously.
Additionally, DHLB (M11) was further metabolized to two hydroxylated metabolites, M4 in LS9 and M8 in OS9. Previously, a hydroxylated metabolite was identified in dog urine (Leinweber et al., 1977). Overall, the formation of M4 and M8 was not observed to be remarkably different in the relevant fractions. Thus, it is unlikely that the downstream metabolism could have affected the relative formation of M11 observed in the systems studied herein. The overall duration of action of DHLB, and in part LB, will depend on the net result of competing metabolic pathways for formation of DHLB in the eye, liver, and other organs in combination with additional metabolic pathways leading to biotransformation of LB.
Two other monohydroxylated metabolites of LB were identified as M9 and M13. M9 has been previously reported as a urinary metabolite (Vollmer et al., 1986), but M13 has never been reported until now. M12, a dihydroxylated metabolite of LB, with one site of hydroxylation confined to the 3-amino-2-hydroxypropoxy-3,4-dihydronaphthalen-1(2H)-one moiety and the other localized on the t-butyl group, may have resulted from oxidation of either M9 or M13. Collectively, these metabolites illustrate a previously unreported liver-specific metabolic pathway of LB in rats and humans. This investigation is the first report on the identification of M10, an oxidative unsaturation metabolite of LB. M10 may have resulted from oxidation of the aliphatic portion of the 3,4-dihydronaphthalen-1(2H)-one moiety, followed by dehydration, thus being lower by 2 amu than LB. In RLS9 and RbtLS9, M10 underwent subsequent glucuronidation to form an N- or O-glucuronide, M1. This is the first documentation of a secondary glucuronide metabolite of LB. M2 and M5 were identified as glucuronide conjugates of hydroxy-LB. Previously, only one glucuronide metabolite of hydroxy-LB was reported in mouse and rat urine. M14 and M15 were characterized as acetyl conjugates of hydroxy-LB. In addition, the two hydroxy-LB metabolites identified in this study have not been previously reported. M7, a dihydroxylated metabolite of LB, was further metabolized to form two glucuronide conjugates, M3 and M6. It is possible that M3 and M6 may have resulted from oxidation of glucuronide metabolites M2 and M5, a pathway documented for certain glucuronides (Argikar, 2012), but whether this pathway exists cannot be ascertained in the present investigation.
Considerable species and organ specificity was observed in the in vitro metabolism of LB (Fig. 2; Table 1). Both M1 and M10 were liver-specific metabolites. Whereas M10 was observed in LS9 from rats, rabbits, and humans, M1 was only observed in RLS9 and RbtLS9. M9, M11, and M16 were observed in both OS9 and LS9 fractions of all of the species. In contrast, oxidative metabolites such as M4 and M13 were present in RLS9 and HLS9, whereas M12 was present in RLS9 only. M7 and M8, two oxidative metabolites resulting from completely different biotransformation pathways, were present only in HOS9 and all LS9. Secondary metabolites illustrated similar species and organ specificity. Overall, these metabolites and the observed biotransformation pathways suggest that liver metabolism is a poor surrogate for ocular metabolism. Our research thus far indicates that metabolism in the eye is best studied in ocular fractions for a given species of interest. Metabolism studies in the OS9 and LS9 fractions for rats and rabbits are likely to complement those in human ocular and liver fractions.
In summary, our investigation presents a comprehensive documentation of metabolic fate of LB in OS9 and LS9 fractions from rats, rabbits, and humans. The present investigation documents a total of 11 new primary and secondary metabolites and thus presents new insights into metabolic pathways of a clinical drug. Finally, our studies revealed seven metabolites of LB in OS9 from rats, rabbits, and humans. The direct relevance of this model to the whole eye as opposed to the use of liver fractions and ease of application will enable future studies on comprehensive ocular biotransformation pathways of drugs being developed for ocular indications.
Acknowledgments
The authors thank Reiner Aichholz, Charles Babu, and Bing Wang for helpful discussions.
Authorship Contributions
Participated in research design: Argikar, Dumouchel, Dunne.
Conducted experiments: Argikar, Dumouchel, Dunne, Saran, Cirello, Gunduz.
Contributed new reagents or analytic tools: Argikar, Dumouchel, Dunne.
Performed data analysis: Argikar, Dumouchel, Dunne, Saran, Cirello, Gunduz.
Wrote or contributed to the writing of the manuscript: Argikar, Dumouchel, Dunne, Saran, Cirello, Gunduz.
Footnotes
- Received March 8, 2016.
- Accepted May 13, 2016.
↵
 This article has supplemental material available at dmd.aspetjournals.org.

Abbreviations
- CID
- collision-induced dissociation
- DHLB
- dihydrolevobunolol
- HCD
- higher energy collision dissociation
- HLS9
- human liver S9 fractions
- HOS9
- human ocular S9 fractions
- LC-MSn
- liquid chromatography high-resolution mass spectrometry with data-dependent scanning
- LB
- levobunolol
- LS9
- liver S9 fractions
- MS2
- tandem mass spectrometry
- OS9
- ocular S9 fractions
- RbtLS9
- S9 liver fractions for rabbit
- RbtOS9
- rabbit ocular S9 fractions
- RLS9
- S9 liver fractions for rat
- ROS9
- ocular S9 fractions for rat
- Copyright © 2016 by The American Society for Pharmacology and Experimental Therapeutics


