


Abstract
Axitinib is an inhibitor of tyrosine kinase vascular endothelin growth factor receptors 1, 2, and 3. The ATP-binding cassette (ABC) and solute carrier (SLC) transport properties of axitinib were determined in selected cellular systems. Axitinib exhibited high passive permeability in all cell lines evaluated (Papp ≥ 6 × 10⁻⁶ cm/s). Active efflux was observed in Caco-2 cells, and further evaluation in multidrug resistance gene 1 (MDR1) or breast cancer resistance protein (BCRP) transfected Madin-Darby canine kidney cells type 2 (MDCK) cells indicated that axitinib is at most only a weak substrate for P-glycoprotein (P-gp) but not BCRP. Axitinib showed incomplete inhibition of P-gp-mediated transport of digoxin in Caco-2 cells and BCRP transport of topotecan in BCRP-transfected MDCK cells with IC50 values of 3 μM and 4.4 μM, respectively. Axitinib (10 mg) did not pose a risk for systemic drug interactions with P-gp or BCRP per regulatory guidance. A potential risk for drug interactions through inhibition of P-gp and BCRP in the gastrointestinal tract was identified because an axitinib dose of 10 mg divided by 250 mL was greater than 10-fold the IC50 for each transporter. However, a GastroPlus simulation that considered the low solubility of axitinib resulted in lower intestinal concentrations and suggested a low potential for gastrointestinal interactions with P-gp and BCRP substrates. Organic anion transporting polypeptide 1B1 (OATP1B1) and OATP1B3 transfected human embryonic kidney 293 (HEK293) cells transported axitinib to a minor extent but uptake into suspended hepatocytes was not inhibited by rifamycin SV suggesting that high passive permeability predominates. Mouse whole-body autoradiography revealed that [14C]axitinib-equivalents showed rapid absorption and distribution to all tissues except the brain. This suggests that efflux transport of axitinib may occur at the mouse blood-brain barrier.
Introduction
Axitinib (AG-013736), N-methyl-2-[[3-[(1E)-2-(pyridin-2-yl)ethenyl]-1H-indazol-6-yl]sulfanyl]benzamide (Fig. 1), is an orally dosed inhibitor of vascular endothelial growth factor receptors (VEGFR) 1, 2, and 3 (Hu-Lowe et al., 2008). VEGFR regulates angiogenesis, which is the formation of new blood vessels from the existing vasculature. New blood vessels are necessary for rapid tumor growth (Folkman et al., 1971). Most solid tumors in breast, lung, renal, colorectal, and liver tissues express high levels of VEGFR compared with normal tissues (Hanahan and Folkman, 1996). The mechanism of action for VEGFR inhibitors such as axitinib is to reduce the vascularization of solid tumors and consequently to minimize tumor growth.

Molecular structure of axitinib.
A phase I clinical trial investigated the tolerability, pharmacokinetics, and clinical activity of axitinib (Rugo et al., 2005). The dose-limiting toxicities were elevated blood pressure (an extension of the pharmacology), hemoptysis, and stomatitis. The pharmacokinetics were studied over an oral dose range from 2–20 mg twice daily; the Tmax and half-life ranged from 1.7–6.0 hours and 1.7–4.8 hours, respectively. Axitinib produced confirmed partial responses in three patients, and a dosage of 5 mg twice daily was selected for the phase II studies. In subsequent clinical trials, axitinib was active in cancers of the kidney (Rixe et al., 2007) and thyroid (Cohen et al., 2008). A multicenter international phase III clinical trial confirmed that axitinib was well tolerated, with a similar adverse event profile as sorafenib, demonstrating a significant increase in progression-free survival in advanced renal cell carcinoma patients compared with sorafenib (Rini et al., 2011). In early 2012, axitinib received approval from the U.S. Food and Drug Administration (U.S. FDA) for treatment of advanced renal cell carcinoma in patients who had failed one prior systemic therapy.
Axitinib is a member of the tyrosine kinase inhibitors (TKIs), which, as a class, have similarities in absorption, metabolism, and transport characteristics. Many (but not all) have good to complete absorption, with fraction absorbed values greater than 0.3 and some in the 0.6 to 1.0 range (Hartmann et al., 2009). Most are substrates for cytochrome P450s and the efflux transporters P-glycoprotein (P-gp) and breast cancer resistance protein (BCRP). Axitinib is metabolized primarily by cytochrome P450 (CYP3A) with minor contributions from CYP1A2, CYP2C19, and UGT1A1 (Zientek, 2010; Pithavala et al., 2012). Metabolism and efflux may contribute to the variable absorption, distribution, and elimination of these medicines. To focus on the transporter aspect, tyrosine kinase inhibitors (such as imatinib, erlotinib, sunitinib, and lapatinib) are inhibitors of efflux transporters (P-gp and BCRP), and, to varying degrees, they interact with organic anion-transporting polypeptides (OATP), organic anion transporters (OAT), organic cation transporters (OCT), and carnitine/organic cation transporter (OCTN) (van Erp et al., 2009; Dohse et al., 2010). OATP transporters can be rate limiting in the clearance of drugs (Shimizu et al., 2005) and may contribute to patient variability especially if OATP1B1 is involved due to polymorphisms associated with this hepatic uptake transporter (Nishizato et al., 2003). We investigated the role of efflux and uptake transporters in the disposition and drug interaction potential of axitinib. Poller et al. (2011) previously demonstrated that axitinib is a substrate for P-gp and BCRP in rodent knockout and cell-based in vitro models. Early studies conducted in our laboratory suggested differing results for these efflux transporters, and the work herein attempts to understand this discrepancy as well as examine other transporter-related characteristics. Also, with ongoing interest in drug-drug interaction (DDI) potentials relating to P-gp efflux and the significance of these effects, proposals using modeling and simulation are beginning to be included in regulatory filings for new drugs. We examined GastroPlus, version 6.0 (Simulations Plus, Inc., Lancaster, CA), a drug absorption and physiologic-based pharmacokinetic modeling and simulation software program, to better understand the pH-dependent solubility of axitinib and how this characteristic may relate to the DDI potential.
Materials and Methods
Chemicals
The chemicals and compounds used in these studies were purchased from Sigma-Aldrich (St. Louis, MO) unless otherwise indicated. Topotecan was obtained from Toronto Research Chemicals (North York, ON, Canada) and Ko143 [3-(6-isobutyl-9-methoxy-1,4-dioxo-1,2,3,4,6,7,12,12a-octahydropyrazino[1′,2′:1,6]pyrido[3,4-b]indol-3-yl)-propionic acid tert-butyl ester] was obtained from Tocris Bioscience (Ellisville, MO). Axitinib and talinolol were synthesized by Pfizer, Inc. Axitinib has exhibited instability to light when in solution, so to minimize degradation during our studies the solutions were protected from light. Caco-2 and Madin-Darby canine kidney cells type 2 (MDCK) cells were obtained from the American Type Culture Collection (ATCC, Manassas, VA). The multidrug resistance gene 1 (MDR1) transfected MDCK cells were obtained externally (Schinkel et al., 1995; Evers et al., 2000), The breast cancer resistance protein (BCRP) transfected MDCK cell stocks and low efflux MDCK (MDCK-LE) cells selected for low expression of canine Mdr1 were prepared internally at Pfizer, Inc. (Xiao et al., 2006; Di et al., 2011). OATP-transfected human embryonic kidney 293 (HEK293) cells (and nontransfected wild-type HEK293 cells) were obtained from Prof. Dietrich Keppler (Konig et al., 2000a,b). Cell culture components and buffers including Dulbeccos’s modified Eagle medium (DMEM), penicillin/streptomycin (10,000/10,000), minimum essential medium with nonessential amino acids (MEM-NEAA), minimum essential medium-α (MEM-α), modified Eagle medium with Earle salts (MEM with Earle Salts, cat. no. 11090-081), Glutamax-I, Hanks’ balanced salt solution (HBSS), Williams’ Medium E (WEM), Trypsin-EDTA, and materials for Western blot analysis were purchased from Life Technologies (Carlsbad, CA) and Santa Cruz Biotechnologies (Santa Cruz, CA) for antibodies Mdr(G-1) and Mdr(C-19). Fetal bovine serum (FBS) and heat-inactivated FBS were obtained from Sigma-Aldrich.
Solubility Determinations
Several solubility studies were conducted to guide the conduct and interpretation of transport studies and modeling in GastroPlus. The solubility of axitinib under experimental conditions and at equilibrium were determined in HBSS transport buffer in the presence of 0.5 or 1% dimethylsulfoxide (DMSO). Axitinib was added to HBSS transport buffer in DMSO at a concentration of 10 µM and was incubated at 37°C for 3 hours for simulated use. Equilibrium solubility in HBSS buffer was determined by adding 1 mg axitinib to 2 mL HBSS containing either 0.5 or 1% DMSO and incubating at 37°C for 2–3 days. After the incubation, the samples were centrifuged to separate the undissolved drug, and the solution concentration of axitinib determined by high-performance liquid chromatography/ultraviolet (HPLC/UV) analysis.
Equilibrium solubility determinations were assessed over a range of pH values to generate the input values for GastroPlus. The measurements were made in 20 mM sodium phosphate and 20 mM sodium acetate buffer for pH >2.0 and in dilute hydrochloric acid solution for pH <2.0 (0.06 M HCl and 0.1 M HCl for pH 1.7 and 1.1, respectively). Excess solid was equilibrated for 24 hours with stirring at 37°C. The samples were filtered through Millipore HV 0.45 µm filters, and the supernatant was collected and concentration quantitated by HPLC. A calibration curve was used over a range of 0.2–70 µg/mL.
Permeability and Transporter Evaluations
Caco-2 Cell Permeability.
Caco-2 cells were cultivated under aseptic conditions at 37°C in an atmosphere of 90% relative humidity, 95% air, and 5% CO2 in culture medium consisting of Dulbeccos's modified Eagle medium (DMEM), 10% FBS, 1% penicillin/streptomycin solution and 1% MEM-NEAA in 175 cm2 culture flasks and passaged when cells reached 75% to 85% confluency with Trypsin-EDTA solution (0.25%). Caco-2 cells at passages 30 through 50 were seeded onto Corning Costar 24-well cell culture devices (Sigma-Aldrich). The 24-well cultures were maintained with medium that was replaced every 3 to 4 days and were used in experiments on days 21–23 after seeding. One day before the study, the base plate was exchanged for a fresh one and media was changed. The cell monolayers were rinsed in HBSS, pH 7.4, and equilibrated in this buffer for 1 hour before the experiments; the plates then were placed on the deck of a Tecan Genesis robotic system (Tecan, Durham, NC).
To begin the experiment, 300 µL of dosing solution was added to the apical (A) chamber for apical to basolateral (AB) transport studies, or 750 µL to the basolateral (B) chamber for basolateral to apical (BA) transport studies with blank buffer added to the receiver chambers (800 µL or 300 µL for AB and BA studies, respectively). Samples were collected at 5 minutes and at 2 hours for donor and at 1 hour and 2 hours for receiver samples. The receiver chambers were replenished with fresh HBSS after the 1-hour sampling. Donor samples were diluted 10 times with fresh HBSS after collection. The samples were analyzed by liquid chromatography-tandem mass spectrometry (LC-MS/MS).
After the study, cell monolayers were incubated for 1 hour with buffer containing 0.1 mg/ml Lucifer yellow (dosed on the apical side, monitor for appearance on the basolateral side) to verify using a criteria of <1% transported that the monolayer integrity had not been compromised during the study.
MDR1-MDCK and BCRP-MDCK-LE Cell Permeability and Efflux Transport Determination.
The in vitro assessment of axitinib included the determination of efflux across monolayers of MDCK cells transfected with human MDR1 (P-gp) and BCRP. BCRP was transfected into MDCK cells that were selected for low expression of canine P-gp and is referred to as BCRP-MDCK-LE. The MDCK-LE cells are a clonal isolate of MDCK wild-type cells selected for low background efflux activity (Di et al., 2011). All cells were maintained similarly to the Caco-2 cells described in the previous section with the exception of the cells grown on 96-well Millicell cell culture devices (Millipore, Billerica, MA) and maintained on media prepared with MEM-α supplemented with 1% MEM-NEAA, 1% Glutamax-I, 1% penicillin/streptomycin, and 10% FBS. The AB and BA flux were determined, and the calculated BA/AB ratios of the transfected cells was used to assess the potential of axitinib to be a substrate for one or more of these efflux transporters.
The experiments were conducted at 37°C, 95% air, 5% CO2, with axitinib dosed either on the apical (for AB determinations) or the basolateral (for BA) compartment. The donor samples were collected at time zero, and the donor and receiver samples were collected at 60-minutes’ incubation. Digoxin and topotecan were used as the positive controls for MDR1 and BCRP transport, respectively, at 2 µM. The marker compound atenolol was measured for monolayer integrity in each well, with Papp < 1.5 × 10⁻⁶ cm/s as the criteria for data acceptance.
OATP-Transfected HEK293 Cell-Substrate Evaluation.
HEK293 cells and cells transfected by the individual OATP transporters OATP1B1, OATP1B3, or OATP2B1 were maintained in growth medium containing MEM with Earle salts supplemented with heat-inactivated FBS (10%), penicillin/streptomycin (1%), and, for the transfected cell lines, G418 (geneticin) at 400 µg/ml. Cells were seeded onto 24-well BD Biocoat poly-d-lysine coated plates (BD Biosciences, Bedford, MA) at a cell density of 2.5 × 10⁵ cells/ml, 1 ml per well. The medium was replaced daily, and on the second day after seeding, the media were changed with medium containing MEM + 10% FBS + penicillin/streptomycin, and 10 mM sodium butyrate.
On day 3, the cells were first washed (3 × 1 ml) with prewarmed HBSS, pH 7.4. The uptake experiments were then conducted. HBSS spiked with 4 μM of test compound (250 µl) was added to rinsed plated cells and incubated for 4 minutes at 37°C followed by rapid aspiration of dosing solution and successive rinses (3 times) with ice-cold buffer. The test compound was extracted from the cell layer with 0.75 mL 75/25% (v/v) acetonitrile/H2O including 0.01 μM buspirone as the internal standard, with a brief scraping of the cells to maximize recovery of the sample followed by transfer to a polypropylene deep 96-well plate and centrifuged for 10 minutes at ∼2500 rpm.
The supernatant (240 μL) was transferred to a shallow 96-well plate (deep and shallow 96-well plates; Nalge Nunc International, Rochester, NY) for bioanalytic evaluation by LC-MS/MS. To account for passive uptake and nonspecific binding, the uptake study was performed in parallel using the nontransfected control cell line HEK293.
Hepatocyte Suspension Active Uptake Assay.
Cryopreserved human hepatocytes (Lot RCP; Celsis In Vitro Technologies, Baltimore, MD) were quickly thawed at 37°C and immediately suspended in warm Williams’ Medium E. Suspended hepatocytes were centrifuged at 50 × g for three minutes at room temperature. The cell pellet was resuspended in 2 ml (per vial) of Krebs-Henseleit buffer (KH; Sigma) and diluted to a final density of 2 × 10⁶ viable cells/mL. Aliquots (200 µL) were transferred to round bottom tubes and placed on ice. Stock solutions of axitinib and rosuvastatin (both test compounds), and rifamycin SV (inhibitor) were prepared in DMSO. The hepatocytes were prewarmed for 3 minutes in a 37°C water bath with gentle agitation, then 200 µL of prewarmed dosing solution (KH buffer spiked with the appropriate stock solution of axitinib or rosuvastatin with and without rifamycin SV) was added to start the incubation. At time points 0.5, 1.0, and 1.5 minutes, 100 µL was taken from the incubation mixture and transferred to a centrifuge tube containing oil (mineral and silicone mix) with a bottom layer of 2 M ammonium acetate and immediately centrifuged for 10 seconds at 14,000 rpm. The hepatocytes were drawn through the liquid layers and pelleted to the bottom of the tube.
After centrifugation, the tubes were placed on ice. The centrifuge tubes were cut just below the oil layer, and the remaining ammonium acetate was removed by aspiration. The cell pellets were resuspended in 50µL Milli-Q water and transferred to a 96-well plate followed by addition of methanol (100 µl) containing internal standard (buspirone 0.03 µM). After vortexing and centrifugation at 2000 rpm for 10 minutes, the supernatant was transferred to a new 96-well plate for LC-MS/MS analysis. Standard curves for axitinib and rosuvastatin were prepared in matrix using the excess suspended hepatocytes to calculate the concentration values for each sample.
Caco-2 Digoxin IC50 Determination.
The inhibition of digoxin efflux across Caco-2 cell monolayers by axitinib was assessed using methods as previously described elsewhere (Cook et al., 2010). Briefly, Caco-2 cells (passage 26) were plated in 24-well transwell plates containing 1 µm pore size inserts (Becton Dickinson, Cowley, UK), at a seeding density of 1.6 × 10⁵ cells/mL and seeding volume of 250 µL. The assay was performed on day 22 after seeding, with media replaced every other day.
The transepithelial electrical resistance (TEER) levels were measured before the experiment to ensure monolayer integrity. The efflux of [3H]-digoxin (5 μM) was determined after a 2-hour incubation in the presence of increasing concentrations of axitinib. The same experiment was repeated using ketoconazole as a positive control inhibitor. The IC50 values were fitted as described in the Data analysis section.
BCRP-MDCK-LE Topotecan IC50 Determination.
The receiver concentrations of the AB and BA transport were measured to determine the net secretory flux of topotecan (known BCRP substrate) by itself and in the presence of Ko143 (known BCRP inhibitor) or axitinib to determine inhibition of BCRP efflux. The permeability of atenolol was determined, which served as the monolayer integrity marker. The donor compartment consisted of topotecan at a single concentration alone of 2 µM and in the presence of increasing concentrations of Ko143 or axitinib. The receiver compartments consisted of blank HBSS and the matching donor concentrations of Ko143 or axitinib. Atenolol was added to each well at 10 μM on the donor compartment.
The study was conducted at 37°C and 5% CO2 using a Beckman Biomek FX automated robotic system functioning to load the donor and receiver solutions to the Millicell 96-well transport plates (Millipore) to start the incubation and to collect the donor samples at the time zero and donor and the receiver samples after 60-minute (substrate assays) or 120-minute (inhibitor assay) incubations. The samples were assayed by LC-MS/MS.
LC-MS/MS Methods.
The compounds of interest were introduced onto a Synergi Polar-RP (2 × 30 mm, 4 µm; Phenomenex, Torrance, CA) HPLC column with a CTC PAL autosampler (Leap Technologies, Carrboro, NC) and an integrated HPLC pumping system (Shimadzu Scientific Instruments, Columbia, MD). These compounds were then eluted and detected by an API 4000 triple quadrupole mass spectrometer (Applied Biosystems/MDS Sciex, Foster City, CA) fitted with a TurboIon Spray interface.
Mobile phase A was 0.1% aqueous formic acid, mobile phase B was 0.1% formic acid in acetonitrile, and the flow rate was 0.8 ml/min. The initial condition for the HPLC gradient was 99:1 (% v/v, A:B). This was held for 0.75 minutes. From 0.75 to 2.5 minutes, the mobile phase composition changed linearly to 5:95 (% v/v, A:B). This condition was held until 2.6 minutes. The gradient was returned in a linear fashion to 99:1 (% v/v, A:B) from 2.6 to 2.8 minutes and re-equilibrated until 3.5 minutes. The injection volume was 10 µl.
Multiple reaction monitoring was used to detect the compounds using the following transitions: 267→90, atenolol; 388→356, axitinib; 1203→86, cyclosporin A; 782→652, digoxin; 470→415, Ko143; 482→258, rosuvastatin; 364→309, talinolol; 422→378, topotecan. The peak area ratio of the analyte to the internal standard was determined for each injection and was used to determine the biologic response under consideration for the particular assay.
GastroPlus Simulations.
GastroPlus was used for the estimation of the mass of drug in solution in various regions of the gastrointestinal tract using the following input parameters; human Peff 2.4 × 10⁻⁴ cm/s, MW 386.47, Log D pH6.5 4.15, simulated intestinal fluid solubility 9.6 × 10⁻⁴ mg/mL, particle size 4µm (particle size standard deviation of 3 was applied), precipitation time 900 second, Diff. Coeff. 0.75 cm2/s × 105, particle radius 2 µm, and drug particle density 1.2 g/mL. GastroPlus simulation outputs estimated the dissolved axitinib mass (mg) at 0.08, 0.16, 0.24, 0.88, 1.04, 2, 4, 6, 8, 10, and 12 hours after the dose in the stomach, duodenum, jejunum 1 (upper), and jejunum 2 (lower) for each dosing condition.
To provide a conservative estimation of intestinal concentration, the sum of dissolved compound in stomach contents, duodenum, jejunum 1 (upper), and jejunum 2 (lower) across a 12-hour time window were used to determine the amount of drug in solution and to determine a maximum concentration in micromolar. The dissolved mass across the various GI regions was then summed to estimate the total dissolved mass at each time point and converted to concentration (µM). This was accomplished using the following equation: This provided the most conservative estimate of dissolved drug.
Whole-Body Autoradiography in Mice.
The tissue distribution of 14C-axitinib was determined in male and female pigmented mice (strain B6C3F1/Crl BR, Charles River Ltd., Margate, Kent, UK) by whole-body autoradiography (WBA) at 1, 4, 8, 24 and 48 hours after oral administration. All procedures performed on these animals were in accordance with regulations and established guidelines and were reviewed and approved by an Institutional Animal Care and Use Committee or through an ethical review process.
14C-Axitinib was administered orally by gavage at a nominal dose level of 50 mg/kg (105 μCi/kg). At the times listed earlier, the animals were sacrificed by cold-shock. (After deep anesthesia under halothane, each animal was placed in a restraining device and rapidly frozen by total immersion in a hexane-solid carbon dioxide mixture (approximately −80°C) for 30 minutes, then transferred to storage at −20°C.) For all animals, the legs, tail, and whiskers were trimmed off, and each frozen carcass was set in a block of frozen aqueous 2% (w/v) carboxymethylcellulose. The block was mounted onto the stage of a Leica CM3600 NT cryomicrotome maintained at about −20°C, and sagittal sections (nominal thickness 30 µm) were obtained (Milnes Packaging Group, Brighouse, West Yorkshire, UK). Imaging was conducted using Fuji imaging plates (type BAS-MS; Raytek Scientific Ltd., Sheffield, UK).
Data analysis.
Apparent permeability values (Papp), flux, net secretory flux, and IC50 values were calculated as previously reported elsewhere (Fenner et al., 2009). The drug interaction risk assessment was conducted according to the U.S. FDA and European Medicines Agency (EMA) guidance documents (CDER, 2012b; CHMP, 2012). The nomenclature proposed by Zhang et al. (2008) was used to refer to the concentration of inhibitor in systemic circulation [I1] and gastrointestinal tract [I2]. When the concentrations derived from GastroPlus simulation were used in the assessment, we referred to this as [Igut].
Results
Solubility Determination.
The equilibrium solubility characteristics of axitinib as a function of pH are shown in Fig. 2. Axitinib is highly soluble at low pH, but the solubility declines rapidly as the pH increases above 2.0. At the range near neutral pH, the solubility of axitinib was <1 µM. A series of solubility studies were conducted to ensure transport study data were reported using concentration ranges where axitinib was in solution. Additional solubility studies were performed to simulate experimental conditions during transport studies. When 10 µM axitinib was prepared in 0.5 or 1% DMSO in HBSS buffer (pH 7.4), and incubated at 37°C for 3 hours, the resulting solution concentration was 4.2 ± 2.2 µM and 2.4 ± 0.5 µM (mean ± S.D.), respectively. When the equilibrium solubility of axitinib was determined in 0.5% or 1% DMSO in HBSS buffer (pH 7.4), the resulting solution concentration was 0.31 ± 0.02 µM and 0.38 ± 0.06 µM (mean ± S.D.), respectively. This suggested that under the conditions used for transport studies, axitinib forms a supersaturated solution when solubilized using DMSO solvent even though the equilibrium solubility was considerably lower. Considering these results, data were reported for transport studies approximately up to 5 µM even though the experiments may have included higher concentrations.

The pH dependent solubility of axitinib, determined as described in Materials and Methods.
Permeability and Efflux.
The in vitro cellular permeability and efflux of axitinib was initially determined using Caco-2 cell monolayers. The Papp (AB), Papp (BA), and efflux ratio of axitinib (1 μM) in Caco-2 cells was 17 × 10−6 cm/s, 160 × 10−6 cm/s, and 9.7, respectively. This suggests that axitinib has high passive permeability with some efflux activity.
P-gp and BCRP Substrate Evaluation.
Evaluation of axitinib as a substrate for P-gp and BCRP was conducted in bidirectional transport studies in MDR1-transfected MDCK and BCRP-transfected MDCK-LE cell monolayers (Tables 1 and 2). The MDR1-MDCK cell transport studies using axitinib showed weak efflux over a concentration range from 1–5 µM with no concentration dependence. The weak efflux observed with axitinib in MDR1-MDCK cells was inhibited by cyclosporine A (CsA). The MDR1 cell system was verified using the positive control digoxin to demonstrate MDR1 efflux and inhibition by CsA.
Effect of increasing axitinib concentrations on efflux transport in MDR1-MDCK monolayers
Effect of increasing axitinib concentration on transport studies in BCRP-MDCK-LE cell monolayers
The BCRP-MDCK-LE cells transport studies using axitinib showed no efflux activity over a concentration range from 1–5 µM. The BCRP cell system was verified using the positive control topotecan to demonstrate BCRP efflux and inhibition by Ko143.
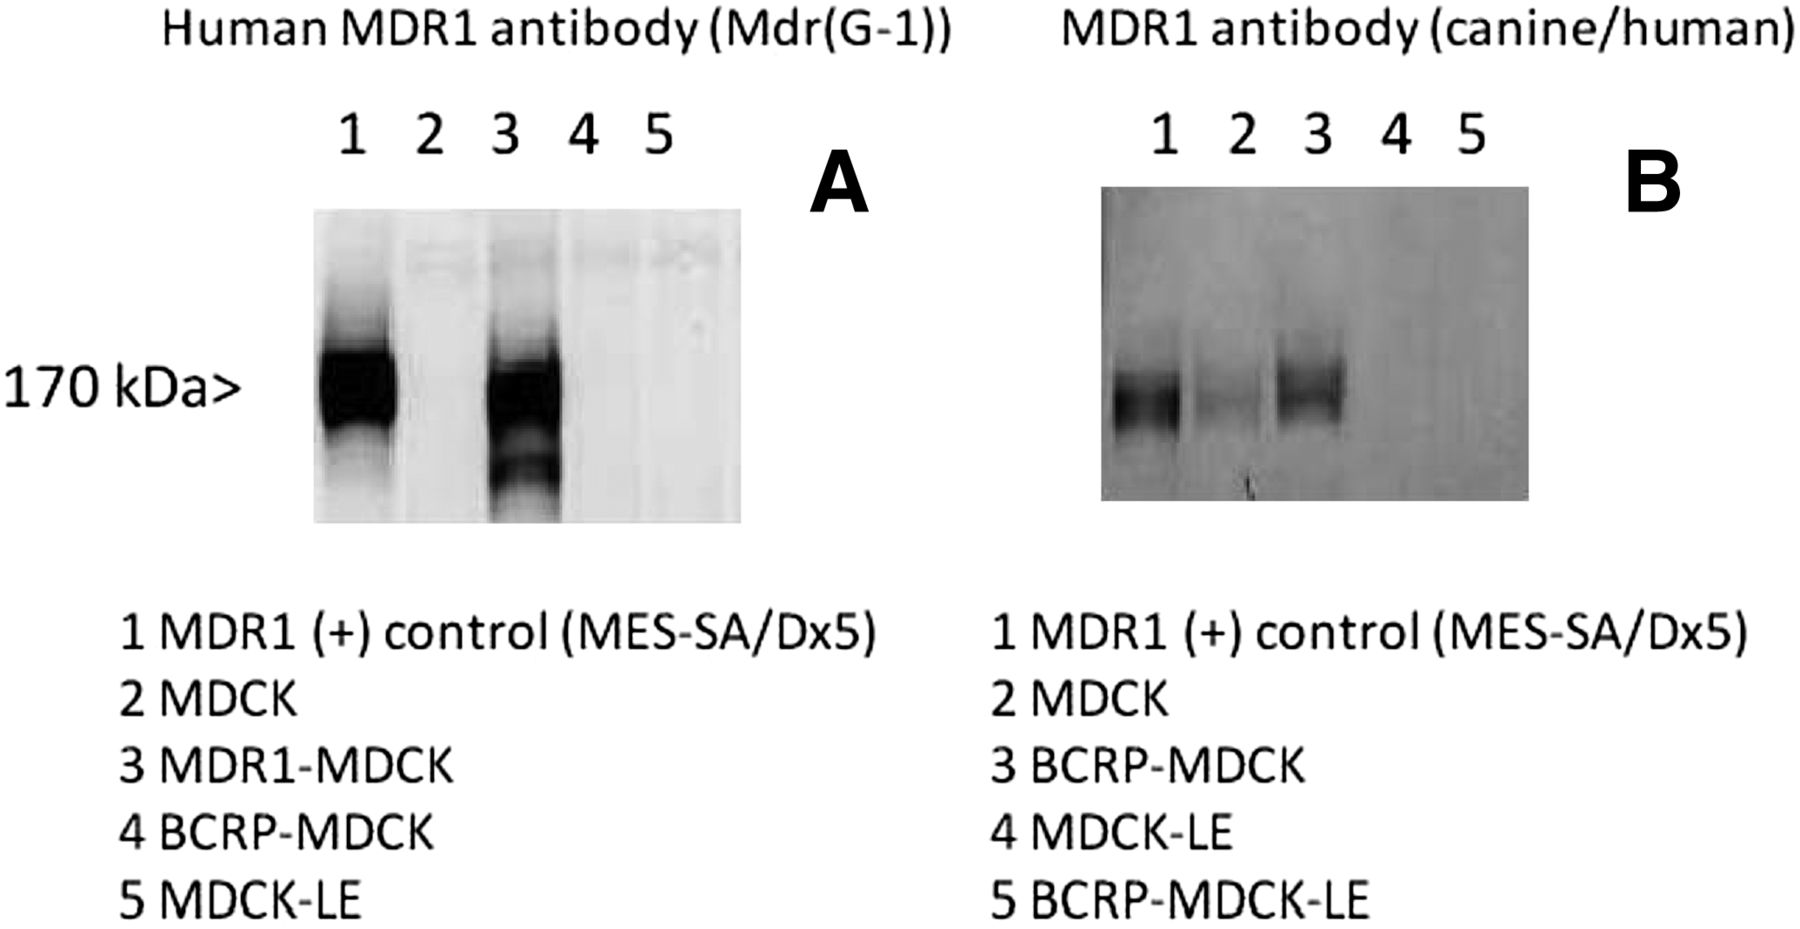
In our laboratory, transfection of wild type MDCK cells with BCRP resulted in an increased expression of native canine Mdr1 in comparison with the nontransfected MDCK cells. With BCRP-MDCK-LE cells, no canine Mdr1 signal was observed, as confirmed by Western blot analysis (Fig. 3). This enabled BCRP substrate activity to be evaluated without being confounded by canine Mdr1 expression. Taken together, our results suggest that axitinib is a weak substrate of P-gp and is not a substrate of BCRP.

Western blot evaluation of MDCK, MDCK-LE and transfected cell lines. The left panel (A) shows specific detection of human MDR1 in MDR1-MDCK cells (lane 3), whereas no signal was observed in the MDCK (lane 2), BCRP-MDCK (lane 4), or MDCK-LE (lane 5) cell extracts. The right panel (B) shows canine/human Mdr1 detection in MDCK (lane 2) and elevated expression in BCRP-MDCK (lane 3) cells. No canine Mdr1 was detected in MDCK-LE (lane 4) or BCRP-MDCK-LE (lane 5) cells. BCRP-MDCK and BCRP-MDCK-LE cells were positive in Western blots for BCRP (data not shown). Full experimental details are provided in Materials and Methods.
P-gp and BCRP Inhibition Evaluation.
P-gp inhibition was evaluated in the Caco-2 monolayer cell line with digoxin as the probe substrate. This is an accepted model to evaluate P-gp inhibition according to regulatory guidance (CDER, 2012b). The concentration range of axitinib in these studies ranged from 0.1 to 75 µM, but the evaluation of inhibition above 7 µM was limited, presumably due to poor solubility in pH 7.4 HBSS buffer. This resulted in the inhibition curves not achieving maximal inhibition (Fig. 4A). To better fit the inhibition curve, positive control inhibitor data for ketoconazole was used to define the maximum inhibition of digoxin flux (Fig. 4B). Determination of an IC50 value for axitinib, as described by Fenner et al. (2009), was then calculated from the resulting data.

(A) Degree of digoxin flux with increasing axitinib concentrations (●). The IC50 for axitinib as an inhibitor of digoxin efflux in Caco-2 cells was 3.0 µM when using the maximal inhibition of ketoconazole data for curve fitting. Inhibition was maximal at 7 µM and did not increase from 10 to 75 µM, presumably due to solubility limitations (○). (B) Degree of digoxin flux with increasing ketoconazole concentrations (●). The IC50 for ketoconazole as inhibitor of digoxin efflux in Caco-2 cells was 4.1 µM. Full experimental details are provided in Materials and Methods.
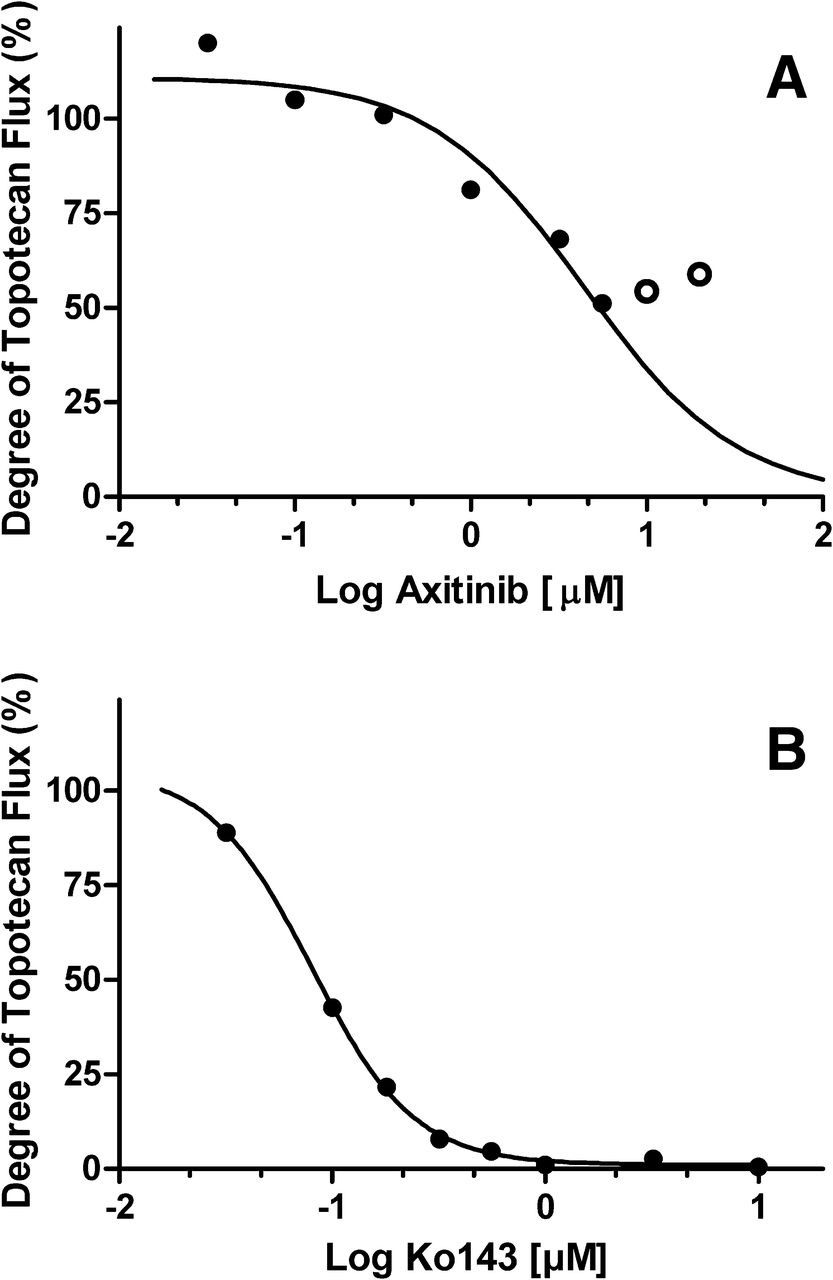
Axitinib decreased P-gp–mediated digoxin transport by 67% at 7 µM, resulting in an IC50 value of 3.0 µM by utilizing ketoconazole to define maximum inhibition. BCRP inhibition was evaluated in BCRP-MDCK-LE cells with topotecan as the probe substrate at a concentration range from 0.032 to 20 µM. Above 20 µM, axitinib-compromised monolayer integrity was observed, as evidenced by elevated Lucifer yellow permeability after the experiment (data not shown). Axitinib decreased BCRP-mediated efflux of topotecan to a maximum of 49% of nominal efflux at 5.6 µM, which did not decrease further at 10 or 20 µM presumably due to poor solubility (Fig. 5A). Ko143, the positive control inhibitor of BCRP, completely inhibited topotecan efflux with an IC50 of 0.08 µM (Fig. 5B). An IC50 value of 4.4 µM for axitinib in BCRP-mediated topotecan transport was estimated using Ko143 to define the maximum inhibition.

(A) Degree of topotecan flux with increasing axitinib concentrations (●). The IC50 for axitinib as an inhibitor of topotecan efflux in MDCK-LE-BCRP cells was 4.4 µM, assuming complete inhibition as observed with Ko143. Inhibition was maximal at 5.6 µM and did not increase at 10 and 20 µM, presumably due to solubility limitations (○). (B) Degree of topotecan flux with increasing Ko143 concentrations (●). The IC50 for Ko143 as an inhibitor of topotecan efflux in Caco-2 cells was 0.08 µM. Full experimental details are provided in Materials and Methods.
OATP1B1, OATP1B3, and OATP2B1 Evaluation.
To determine whether axitinib is a substrate for human hepatic uptake transporters, OATP1B1, OATP1B3, and OATP2B1 in vitro uptake studies were performed. Axitinib (concentration range: 0.5–4.0 µM) was not a substrate of OATP2B1 at any concentration evaluated. Axitinib was a substrate for both OATP1B1 and OATP1B3, where OATP1B3 demonstrated an approximately 2-fold greater uptake rate than OATP1B1 (Table 3).
Uptake rate for axitinib in OATP-transfected HEK293 cells
Hepatocyte Suspension: Active Uptake Assay.
The positive control hepatic uptake substrate rosuvastatin is transported by OATP1B1, OATP1B3, OATP2B1, and sodium-dependent taurocholic-cotransporting polypeptide (NTCP) (Ho et al., 2006), and uptake into sandwich culture human hepatocytes is completely inhibited by rifamycin SV (100 µM), an inhibitor of OATPs and NTCP (Mita et al., 2006; Bi et al., 2012). This system enables the functional evaluation of active uptake and passive diffusion mechanisms of drug entry into hepatocytes. Using suspended cryopreserved human hepatocytes, rosuvastatin (1 µM) linear uptake was demonstrated with nearly complete inhibition by rifamycin SV (100 µM) (Fig. 6). When axitinib was tested in the same system, compound accumulation into the hepatocytes reached a near maximum by 0.5 minutes, and little additional uptake was observed by 1.5 minutes. Addition of rifamycin SV (100 µM) did not inhibit axitinib uptake into hepatocytes. The results for axitinib indicate that passive diffusion was the primary hepatic uptake mechanism at 1 µM.

Human hepatocyte uptake of axitinib. (A) Uptake of axitinib (1 µM) and inhibition by rifamycin SV (no inhibition observed). (B) Uptake of the positive control rosuvastatin and inhibition by rifamycin SV (inhibition observed). Full experimental details are provided in Materials and Methods.
GastroPlus Simulation of Axitinib Intestinal Concentrations and Efflux Transporter Drug Interaction Risk Assessment.
Both U.S. FDA and EMA regulatory guidance recommend the assessment of drug interaction risk for efflux transporters systemically and at the level of the gastrointestinal tract (CDER, 2012b; CHMP, 2012). Both agencies recommend estimating the intestinal concentration by dividing the highest recommended dose by 250 mL. The risk assessment for intestinal drug interactions with efflux transporters is assessed by determining whether the ratio of the intestinal concentration [I2] divided by the IC50 or Ki value is >10. However, this does not consider whether the entire dose is in solution for drugs with low pH-dependent solubility. To investigate this possibility, Gastroplus software was used to simulate the intestinal concentration time profile of axitinib (data not shown) following the maximum recommended dose of 10 mg in the fed state (Inlyta, Pfizer Labs, New York, NY).
GastroPlus was used to estimate the total mass of drug in solution achieved in each area of the gastrointestinal tract, including the stomach, which was then summed to conservatively estimate total drug mass in solution. The GastroPlus estimate of total drug amount in solution was divided by 250 mL, resulting in a gut concentration ([Igut]) of 6.6 µM. This value was much lower than the [I2] of 104 µM when the total 10 mg dose/250 mL was used. The resulting [Igut]/IC50 versus [I2]/IC50 ratios were 2.2 versus 35 for P-gp and 1.5 versus 24 for BCRP.
Regulatory guidance also requires a risk assessment for systemic interaction with efflux transporters. The USFDA and EMA guidance differ in the use of total maximum plasma concentration (Cmax) or unbound plasma Cmax divided by IC50 or Ki and the use of a safety factor of 10 or 50, respectively. The highest dose of axitinib administered clinically is 10 mg twice daily, resulting in a mean total or unbound Cmax of 0.16 or 0.0008 µM, respectively (Rugo et al., 2005; CDER, 2012a). The total or unbound [I1]/IC50 was less than 0.1 or 0.02 (the respective thresholds for the U.S. FDA and EMA DDI guidance) for efflux transporter inhibition.
Whole-Body Autoradiography in Mice.
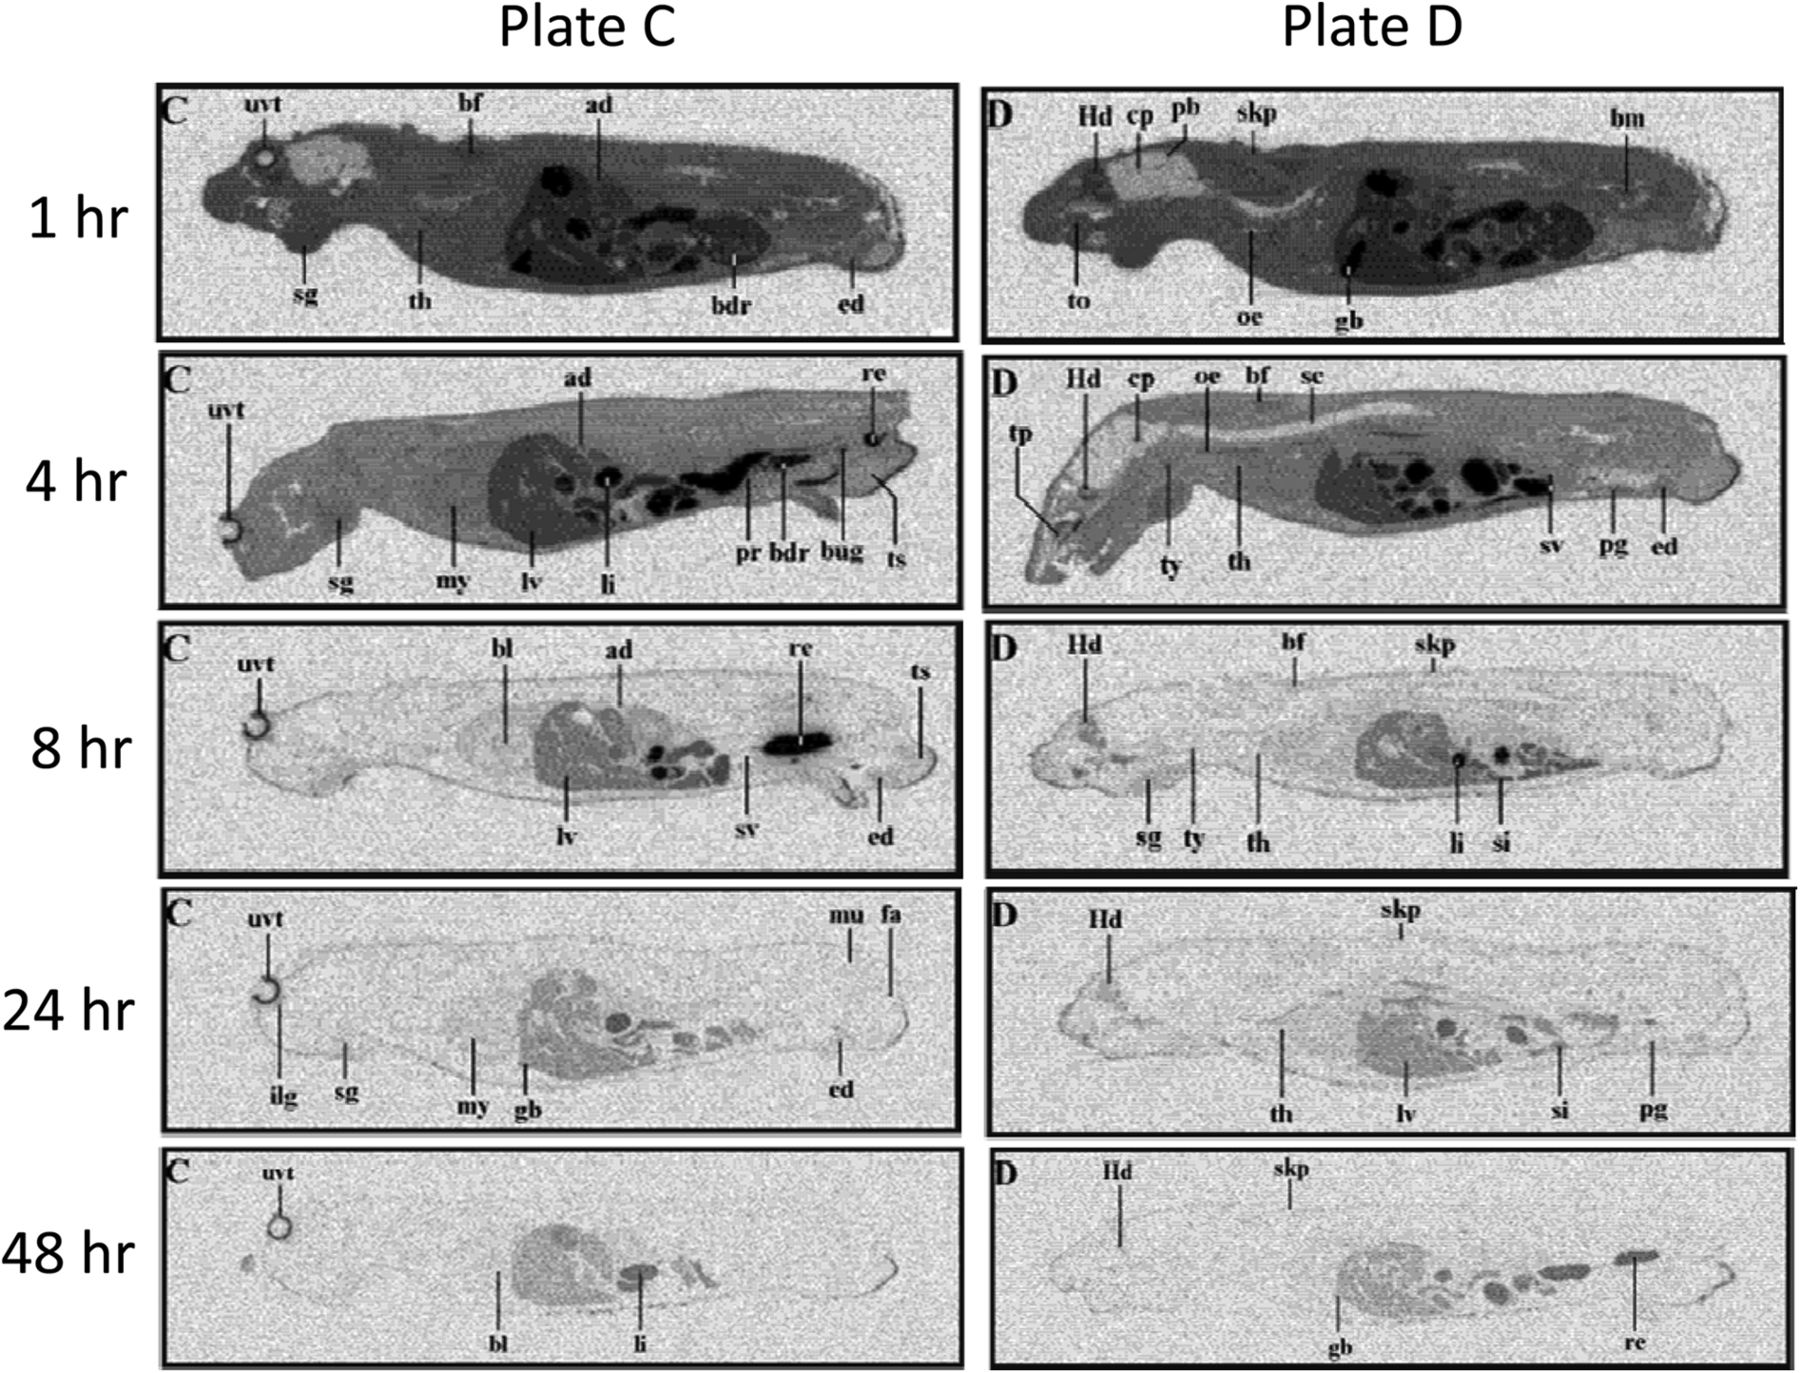
The tissue distribution of [14C]axitinib was determined in male pigmented mice by whole-body autoradiography at 1, 4, 8, 24, and 48 hours after oral administration. [14C]Axitinib was administered orally by gavage at a dose level of 50 mg/kg (105 μCi/kg). Maximum concentrations of radioactivity in mice generally occurred at 1 hour in all tissues (Fig. 7), indicating rapid absorption and radioactivity was widely distributed in all tissues. The highest level of axitinib-derived radioactive equivalents was present in the gall bladder, consistent with hepatic elimination of the drug (metabolism and transport). The radioactivity ratio in the gall bladder to blood at 1 hour after the dose was 24, and the next highest levels in the liver and stomach mucosa were 3.8 and 3.6, respectively. By 24 hours, most tissues measured contained concentrations of radioactivity below the limit of quantification with the exception pigment-containing tissues (skin and uveal tract). Low concentrations of radioactivity were detected in the brain. The brain to blood ratio was ∼0.09 at 1 hour after the dose, and the brain concentrations were below the limit of quantification at 4 hours after the dose.

Whole-body autoradiograms of male mouse at 1, 4, 8, 24, and 48 hours after a single oral 50 mg/kg dose of [14C]axitinib. The sections were exposed for 7 days and evaluated with Fuij Bio-Imaging Analyzer BAS 1500 (Raytek, Berlin, Germany) using the blood calibration standards for quantification. Electronic images were obtained by phosphor imaging. Two typical plates (C and D) are shown at each time point to allow identification of most organs. Abbreviations on the autoradiograms: ad, adrenal; bdr, bladder; bf, brown fat; bl, blood; bm, bone marrow; bug, bulbo-urethral gland; cp, choroid plexus; ed, epididymis; fa, white fat; gb, gall bladder; Hd, Harderian gland; li, large intestine; lv, liver; mu, muscle; my, myocardium; nm, nasal mucosa; oe, esophagus; pb, pineal body; pg, preputial gland pr, prostate; re, rectum; sc, spinal cord; sg, salivary glands; si, small intestine; skp, pigmented skin; sv, seminal vesicles; th, thymus; to, tongue; tp, tooth pulp; ts, testis; ty, thyroid; uvt, uveal tract. Full experimental details are provided in Materials and Methods.
Discussion
Axitinib inhibits cellular VEGF receptor tyrosine kinase phosphorylation and target-mediated functional activity (Hu-Lowe et al., 2008). It is a more selective inhibitor of VEGF receptor 1, 2, and 3, platelet-derived growth factor receptor (PDGFR), and stem cell factor receptor (c-KIT) than both sunitinib and sorafenib and has greater affinity for these targets (Goldstein et al., 2010). Axitinib is a low-molecular-weight, lipophilic, and weakly basic molecule with high permeability. Tyrosine kinase inhibitors, such as dasatinib, imatinib, gefitinib, sunitinib, and lapatinib, possess similar molecular characteristics, including multiple aromatic rings, a similar molecular weight (ranging from 398 to 494 AMU), and moderate hydrophobicity (logP values > 2), and they are most are primarily cleared via metabolism by CYP3A4. These chemical features are also typical for substrates of ATP-binding cassette (ABC) transporters (Polli et al., 2008; Chen et al., 2009; Oostendorp et al., 2009; Shukla et al., 2009; Carcaboso et al., 2010).
We found that axitinib showed efflux in Caco-2 cells, was a weak substrate for human P-gp, and was not a BCRP substrate using transfected cell lines. However, axitinib is an inhibitor of P-gp and BCRP. Axitinib inhibits VEGFR by forming a binding complex to the ATP catalytic binding site of the kinase domain (Bender et al., 2004; Solowiej et al., 2009). It is not known whether axitinib inhibits P-gp and BCRP by binding to the substrate or the ATP-binding site. Axitinib appeared to be a substrate for uptake by OATP1B1 and OATP1B3 in transfected cell systems. However, additional hepatocyte uptake studies showed that the OATP inhibitor rifamycin SV did not have any impact on the uptake of axitinib under the same conditions where rosuvastatin uptake was markedly inhibited.
Considering the physicochemical properties of axitinib, the high permeability, and the passive uptake into the hepatocyte, these results suggest that OATPs do not play a significant role in its hepatic disposition. Although we evaluated only OATPs in this study and it appeared that passive uptake of axitinib into hepatocytes predominated, we did not evaluate the potential role of other uptake transporters. Thus, considering the major uptake and efflux transporters we evaluated, it appears that transporters play a minor role in the absorption, distribution, and excretion of axitinib in humans.
Our finding that axitinib is at most only a weak substrate for MDR1 and not a BCRP substrate is in contrast to the recent publication by Poller et al. (2011), which identified axitinib as a good and moderate substrate for MDR1 and BCRP, respectively. We found that, over a concentration range of axitinib from 1 to 5 µM, the P-gp mediated efflux ratio in the MDR1-MDCK was ≤1.45, and our positive control substrate, digoxin, exhibited an efflux ratio of 24. BCRP efflux ratios of axitinib were near unity, and the efflux ratio of our positive control, topotecan, was greater than 14.
Recently, Di et al. (2011) reported that fluorescence-activated cell sorting (FACS)–selected low-efflux MDCKII cells (MDCK-LE) showed a much lower mRNA expression for canine P-gp than the parental wild-type MDCK cell line (dog Mdr1 >62-fold higher in MDCK cell line). It is possible that axitinib is a substrate for canine P-gp and that the MDR1-MDCK and BCRP-MDCK cell lines used by Poller et al. (2011) may contain higher levels of canine P-gp than our cell lines, resulting in the contrasting results between the two laboratories. Additionally, it was previously demonstrated that P-gp activity differs between species (Tang-Wai et al., 1995). This species-specific activity may account for the differences in axitinib efflux in the various systems. Interestingly, in the BCRP-transfected MDCK cells, higher levels of canine Mdr1 were present than in the wild-type MDCK cells based on Western blot analysis while expression was absent in the BCRP-MDCK-LE cell lines (Fig. 2). This emphasizes the importance of cross-laboratory evaluation of drug transporter substrate and inhibition properties.
Our in vivo quantitative whole-body autoradiography (QWBA) studies in mice provided an opportunity to compare the brain distribution of [14C]axitinib radioactive equivalents (Fig. 7) with the results obtained by Poller et al. (2011) where the parent drug was specifically measured. We confirmed their finding that axitinib has restricted mouse brain distribution, as the level of axitinib radioactive equivalents present in the brain was markedly lower than in whole blood or other tissues. Poller et al. (2011) went on to study the brain disposition of axitinib in abcg2−/−, abcb1a/b−/−, and triple knockout mice. These results showed no effect of abcg2−/−, a marked increase in brain exposure in abcb1a/b−/−, and an even greater increase in the triple knockout. The ability of P-gp and bcrp to work together to limit brain disposition has also been described for lapatinib and dasatinib (Chen et al., 2009; Polli et al., 2009). The results of Poller et al. (2011) suggested that the mouse mdr1 limits the brain distribution of axitinib, with the role of bcrp being unclear. Although axitinib, like several other tyrosine kinase inhibitors, exhibits poor central nervous system penetration in rodents, there is currently no information available for human central nervous system exposure after a longer duration of therapy with axitinib.
Axitinib is an inhibitor of MDR1 and BCRP in vitro with IC50 values of 3.0 and 4.4 µM, respectively. The assessment of drug interaction liability was based on the white paper on transporters in drug development (Giacomini et al., 2010) and the most recent U.S. FDA and EMA drug interaction guidance documents (CDER, 2012b; CHMP, 2012). Axitinib was below the guidance cutoff values for defining systemic drug interaction risk with efflux transporters. However, the [I2]/IC50 values were 35 and 24 for P-gp and BCRP, respectively, which exceeded the cutoff value of 10 when the total administered dose was used to estimate the intestinal concentration.
As shown in Fig. 2, axitinib is highly soluble at low pH, but its solubility declines rapidly as pH increases above 2.0, which suggests that in the intestinal regions where efflux transporters are located and pH is more neutral, the solution concentration of axitinib achieved might be limited. Therefore, the intestinal concentration estimate of 104 μM calculated from a 10 mg dose/250 mL is likely to overpredict the actual intestinal solution concentrations. We performed GastroPlus simulations to account for the extensive pH dependent solubility of axitinib, which conservatively estimated a lower intestinal solution concentration of 6.6 μM. By incorporating the GastroPlus simulated intestinal concentration of 6.6 μM, the results suggested that a clinical drug interaction study was not needed because the [Igut]/IC50 values were 2.2 and 1.5 for P-gp and BCRP, respectively.
This approach is consistent with the EMA guidance, which indicates that for low solubility compounds, the maximum concentration at the pH range of the GI tract can be used. Thus, the potential for axitinib to alter the pharmacokinetics of digoxin (a narrow therapeutic index chronic heart failure medicine) or drugs that are substrates for BCRP appears by this assessment to be low. This work demonstrated the utility of GastroPlus to simulate gastrointestinal concentrations to better predict the amount of the inhibitor in solution at the efflux transporter site, considering regional differences in pH and pH-dependent inhibitor solubility.
A conservative approach was used to sum the axitinib simulated to be in solution in each gastrointestinal region including the stomach where P-gp and BCRP are not expressed. If only the regions where efflux transporters are expressed were considered, the [Igut]/IC50 ratio would have been much lower for axitinib because the solubility is very low as pH becomes neutral. Further study would be necessary to determine which approach is most predictive. Finally. this application of GastroPlus appears well suited for consideration as an alternative in the DDI assessment of efflux transporters and enzymes expressed in the intestine for other drugs where the total dose/250 mL exceeds the aqueous solubility at pH values observed in the intestine.
Axitinib was shown to be a substrate of OATP1B1 and OATP1B3 in transfected HEK293 cells. However, in a functional assay with suspended human hepatocytes axitinib uptake was not altered by the uptake transport inhibitor rifamycin SV. Taken together, these results suggest that axitinib is a weak substrate for OATP1B1 and OATP1B3 and that passive diffusion is its main mechanism of entry into the hepatocyte when investigated at 1 µM. In early clinical trials with axitinib, variability in pharmacokinetics or drug exposure was observed. Intersubject variability has been associated with OATP1B1 genetic polymorphisms in patients taking various statins and irinotecan (Nozawa et al., 2005; Romaine et al., 2010). Because axitinib showed some OATP1B1 substrate activity, this observation led us to the hypothesis that an inactive phenotypic variant could be a factor in clinical PK variability. However, no significant association between the SLCO1B1 (T521C) genetic polymorphism and variability in axitinib plasma exposure was noted in a pooled analysis of 11 healthy volunteer studies during early clinical trials (Brennan et al., 2012). Thus, it is likely that the observed high permeability of axitinib overrides any potential differences in active hepatic uptake that could be exhibited by phenotypic variants of these transporters. This observation highlights that for a transporter to alter the disposition of a drug the active transporter process must play a significant role relative to the passive contribution.
Acknowledgments
The authors thank Yazdi Pithavala, Bo Feng, and Ellen Wu for thoughtful review and suggestions of our work, Anthony M. Campeta, Michelle Marra, and Perrine Hoerter for providing solubility data, and Ying Jiang and Sylvia Vekich for bioanalytic support of the studies. We also thank Covance Laboratories, Ltd. (North Yorkshire, England), for producing the mouse whole-body autoradiography data, and Chad Stoner, in memoriam, for his contributions to GastroPlus simulations.
Authorship Contributions
Participated in research design: Reyner, Sevidal, West, Fenner, Ullah, Lee.
Conducted experiments: Reyner, Sevidal, West, Ullah.
Performed data analysis: Clouser-Roche, Freiwald, Ullah, Reyner, Sevidal, West.
Wrote or contributed to the writing of the manuscript: Reyner, Lee, Ullah, Smith.
Footnotes
- Received January 18, 2013.
- Accepted May 31, 2013.
↵1 Current affiliation: Genentech, Inc., South San Francisco, California.
↵2 Current affiliation: Dart NeuroScience, LLC, San Diego, California.
↵3 Current affiliation: Ardea Biosciences, San Diego, California.
↵4 Current affiliation: NSF International, Ann Arbor, Michigan.
↵5 Current affiliation: AstraZeneca, Macclesfield, Cheshire, United Kingdom.
↵6 Current affiliation: F. Hoffman La-Roche, Grenzacherstrasse, Basel, Switzerland.
↵7 Current affiliation: QPS DMPK Hepatic Biosciences, Research Triangle Park, North Carolina.
Abbreviations
- AB
- apical to basolateral
- BA
- basolateral to apical
- BCRP
- breast cancer resistance protein
- CsA
- cyclosporine A
- CYP
- cytochrome P450
- DDI
- drug-drug interaction
- DMSO
- dimethylsulfoxide
- FBS
- fetal bovine serum
- HBSS
- Hanks’ balanced salt solution
- HEK293
- human embryonic kidney 293 cells
- HPLC
- high-performance liquid chromatography
- Ko143
- 3-(6-isobutyl-9-methoxy-1,4-dioxo-1,2,3,4,6,7,12,12a-octahydropyrazino[1′,2′:1,6]pyrido[3,4-b]indol-3-yl)-propionic acid tert-butyl ester
- LC-MS/MS
- liquid chromatography-tandem mass spectrometry
- MDCK
- Madin-Darby canine kidney cells type 2
- MDCK-LE
- MDCK low efflux cells
- MDR1
- multidrug resistance gene 1
- MEM
- minimum essential medium
- MEM-NEAA
- minimum essential medium with nonessential amino acids
- OATP
- organic anion transporting polypeptide
- Papp
- apparent permeability
- P-gp
- P-glycoprotein (or MDR1)
- VEGF
- vascular endothelial growth factor
- VEGFR
- vascular endothelial growth factor receptor
- Copyright © 2013 by The American Society for Pharmacology and Experimental Therapeutics


