


Abstract
Time-dependent inhibition (TDI) of cytochrome P450 enzymes is an important cause of drug-drug interactions. The standard approach to characterize the kinetics of TDI is to determine the rate of enzyme loss, kobs, at various inhibitor concentrations, [I], and replot the kobs versus [I] to obtain the key kinetic parameters, KI and kinact. In our companion manuscript (Part 1; Nagar et al., 2014) in this issue of Drug Metabolism and Disposition, we used simulated datasets to develop and test a new numerical method to analyze in vitro TDI data. Here, we have applied this numerical method to five TDI datasets. Experimental datasets include the inactivation of CYP2B6, CYP2C8, and CYP3A4. None of the datasets exhibited Michaelis-Menten–only kinetics, and the numerical method allowed use of more complex models to fit each dataset. Quasi-irreversible as well as partial inhibition kinetics were observed and parameterized. Three datasets required the use of a multiple-inhibitor binding model. The mechanistic and clinical implications provided by these analyses are discussed. Together with the results in Part 1, we have developed and applied a new numerical method for analysis of in vitro TDI data. This method appears to be generally applicable to model in vitro TDI data with atypical and complex kinetic schemes.
Introduction
Time-dependent inhibition (TDI) of cytochrome P450 (P450) enzymes is an important cause of drug-drug interactions (DDIs) (Ortiz de Montellano and Correia, 1995; Silverman, 1995; Obach et al., 2007; Grime et al., 2009). The standard approach to characterize the kinetics of TDI is to determine the rate of enzyme loss, kobs, at various inhibitor concentrations, [I], and replot the kobs versus [I] to obtain the binding constant, KI, and the inactivation rate constant, kinact (Grimm et al., 2009; Mohutsky and Hall, 2014). This standard replot method assumes Michaelis-Menten (MM) kinetics and irreversible inactivation. However, it is well-known that P450 kinetics can be complex due to multiple-substrate and multiple-inhibitor (EII) binding kinetics (Lu et al., 2001; Denisov et al., 2007; Kapelyukh et al., 2008; Korzekwa, 2014). Further, quasi-irreversible (Ortiz de Montellano and Correia, 1995; Murray, 1997; Lin and Lu, 1998) and partial-inactivation kinetics (Crowley and Hollenberg, 1995; Hollenberg et al., 2008) have been reported. Although a modification of the replot method can incorporate EII kinetics, the errors in the in vitro data tend to be magnified by the replot method and prevent parameter estimation (Nagar et al., 2014). Additionally, to our knowledge, reversible and partial inactivation cannot be evaluated with the replot method. Other methods have been used to simultaneously parameterize KI and kinact from integrated (Ernest et al., 2005) and steady-state equations (Burt et al., 2012), but these methods are not easily applied to complex and reversible kinetic schemes.
Applying in vitro kinetic parameters to predict in vivo DDIs requires estimates of kinact, KI, and the rate of enzyme resynthesis (kdeg) (Venkatakrishnan et al., 2007; Mohutsky and Hall, 2014). These in vitro–in vivo correlations (IVIVCs) are often unsuccessful and tend to overpredict DDIs (Wang, 2010). Although the origin of these failures is unknown, the inability to incorporate complex kinetic data may have prevented accurate determination of relevant kinetic parameters.
In our companion manuscript (Part 1; Nagar et al., 2014) in this issue of Drug Metabolism and Disposition, we describe a new numerical method to analyze in vitro TDI data. This method incorporates complex kinetic schemes, including EII, quasi-irreversible, and partial-inactivation kinetics. For MM kinetics, much better estimates of KI can be obtained with the numerical method compared with the standard replot method, and even IC50 shift data can provide meaningful parameter estimates. Whereas the replot method cannot identify the correct kinetic model at experimental errors of 2.5% or greater, the numerical method consistently predicts the correct model at errors of 10% or less.
In Part 1, the numerical method was applied to simulated data. Here, we use the numerical method to model five experimental TDI datasets. The goal of this research is to evaluate the use of the numerical method and compare the results to those obtained with the standard replot method.
Materials and Methods
Pooled human liver microsomes were purchased from Corning Life Sciences (Tewksbury, MA) and NADPH from Sigma-Aldrich (St. Louis, MO). The proprietary compounds used as inactivators were provided by Boehringer Ingelheim Pharmaceuticals Inc. (Ridgefield, CT). Known inactivators 2-phenyl-2-(1-piperidinyl)propane (PPP), gemfibrozil glucuronide, and troleandomycin (TAO) were purchased from Syncom (Groningen, The Netherlands), Toronto Research Chemicals (Toronto, ON, Canada), and Sigma-Aldrich, respectively. Midazolam, α-hydroxymidazolam, and α-hydroxymidazolam-D4 were all from Cerilliant (Reston, VA). Standard P450 probe substrates were obtained from various common commercial suppliers.
Methods
Experimental Procedures.
For the TAO-midazolam study, TAO (0–30 μM) was primary incubated at 37°C with a 0.5-mg/ml suspension of human liver microsomes in 100 mM potassium phosphate buffer, pH 7.4, containing 5 mM MgCl2. For each TAO concentration, four primary incubation times (0, 5, 15 and 30 minutes) were conducted in duplicate in the absence or presence of 1 mM β-NADPH. Final solvent concentration in the primary incubation was constant at 0.3% 1:1 (v/v) acetonitrile/methanol. Incubations containing 0.3% 1:1 acetonitrile/methanol (without TAO) were also performed to assess background (metabolism-independent) rate of inactivation. Loss of CYP3A enzyme activity resulting from this primary incubation was assessed using the CYP3A-selective probe substrate midazolam in a secondary incubation. In short, a small amount of the primary incubation mixture (5 μl) was added to 95 μl of 100 mM potassium phosphate buffer, pH 7.4, containing 5 mM MgCl2, 1 mM NADPH, and 50 μM midazolam. Following shaking incubation for 1.5 minutes at 37°C, reactions were terminated by addition of an equal volume of ice-cold acetonitrile containing α-hydroxymidazolam-D4 as liquid chromatography–tandem mass spectrometry internal standard. Quantitative analysis of α-hydroxymidazolam and labeled internal standard was performed using an Agilent 1200 series liquid chromatograph (Agilent Technologies, Palo Alto, CA) equipped with a Sciex API-4000 (triple quadrupole) mass spectrometer (MDS Sciex, Concord, ON, Canada). Chromatographic separation was achieved using an ACE C18 (30 × 2.1 mm, 3 μm) column (Advanced Chromatography Technologies, Aberdeen, Scotland) maintained at 50°C and a flow rate of 0.7 ml/min. The solvent system consisted of a 0.5-minute linear gradient from 0.1% formic acid in 10% acetonitrile to 0.1% formic acid in 90% acetonitrile, which was maintained for an additional 0.6 minute. The mass spectrometer was operated in multiple reaction monitoring mode. For α-hydroxymidazolam and α-hydroxymidazolam-D4, the ions monitored were 342/203 and 346/207, respectively, using a collision energy of 35 V. Integration of reaction product and internal standard peak areas was performed using Analyst software (v. 1.4.2; AB Sciex, Framingham, MA).
For datasets 2–5, incubation samples consisted of pooled human liver microsomes and various concentrations of the inactivator in potassium phosphate buffer (50 mM, pH 7.4). The samples were equilibrated at 37°C for 5 minutes. Reactions were initiated by the addition of the cofactor NADPH (2 mM). The final solvent concentration in the inactivation incubations was 1% (v/v). A control sample was included in which the inactivator was incubated at the highest test concentration in the absence of NADPH. At specific time points up to 35 minutes, an aliquot of the incubation (10 μl) was removed and diluted 20-fold by adding it to the incubation in which the enzyme activity was measured (secondary incubation). The activity incubation consisted of a standard P450 probe substrate and NADPH (2 mM) in potassium phosphate buffer (50 mM, pH 7.4) at 37°C incubated for 6 minutes. The concentrations of the probe substrates were approximately 5- to 10-fold the respective Km concentration. Reactions were stopped by removing an aliquot of the incubation mixture and adding it to a solution consisting of acidified organic solvent and an internal standard. The samples were filtered and centrifuged for 5 minutes at 3000 rpm and analyzed by liquid chromatography–tandem mass spectrometry to monitor the concentrations of the P450 probe substrate metabolite.
Model Fitting Procedure.
No assumptions were made concerning the mechanism or kinetics of inhibition. To demonstrate the process by which models are selected, the raw data for dataset 4 is provided in Table 1. To determine which of the models will be fit to the data and compared, the following general procedure was sequentially used.
The solvent control data (no inhibitor) are used to evaluate if enzyme loss (independent of inhibitor) must be included in all models for this dataset. For the data in Table 1, the solvent control data show a consistent decrease from 0.095 to 0.080 μM over a 30-minute period. This represents a 16% enzyme loss, necessitating the inclusion of enzyme loss pathways in the model. In the absence of mechanistic insight, this enzyme loss pathway was modeled to occur for every enzyme species.
An initial estimate of KI was obtained from the highest primary incubation time data. For the data in Table 1, the product concentration for the 30-minute primary incubation time is decreased by 50% at 50 μM inhibitor. This value was used to calculate the initial estimate for inhibitor release.
The competitive inhibition constant, Ki, can be estimated from the zero primary incubation time data. For the data in Table 1, the initial estimate of Ki is very different than that for KI, even after accounting for dilution. As discussed in Part 1, Ki should equal KI provided that MM kinetics apply and that there is minimal enzyme inactivation during the competitive portion of the experiment. Even if there is significant enzyme inactivation during substrate incubation, the numerical method will correctly parameterize the inhibition constant (KI = Ki) when MM kinetics apply. When the numerical method cannot correctly model such data with an MM scheme, an EII model should be tested.
An estimate of kinact can be obtained from the observed half-life (t1/2) at the highest inhibitor concentration. At saturating inhibitor concentration, kinact = 0.693/t1/2.
An estimate of the rate of product formation from ES (k3 in Figs. 1–6) can be obtained from the product formation at zero inhibitor concentration and zero primary incubation time.
Finally, a plot of the log percent remaining activity versus primary incubation time (PRA plot) should be inspected to determine if curvature is observed. As discussed in Part 1, concave upward curvature is indicative of either quasi-irreversible or partial-inactivation kinetics.
An example of raw data for in vitro TDI analyses
One repeat of dataset 4 is listed. TDI is a proprietary compound, and is a CYP3A4 inactivator. Midazolam was used as the substrate. Data are presented as concentration of metabolite formed (μM) at the end of a 6-minute incubation, with a 20-fold dilution upon addition of substrate at the end of the primary incubation time. The analysis of this dataset is provided in Table 5.

Scheme and PRA plot for the inhibition of CYP3A4 by TAO (dataset 1). The dashed lines represent the PRA plots with the standard replot method, and the solid lines depict the fit with the numerical method. (Inset) Replot of kobs versus [I] for the standard replot method. ln% remaining activity, natural log of the percent remaining activity.

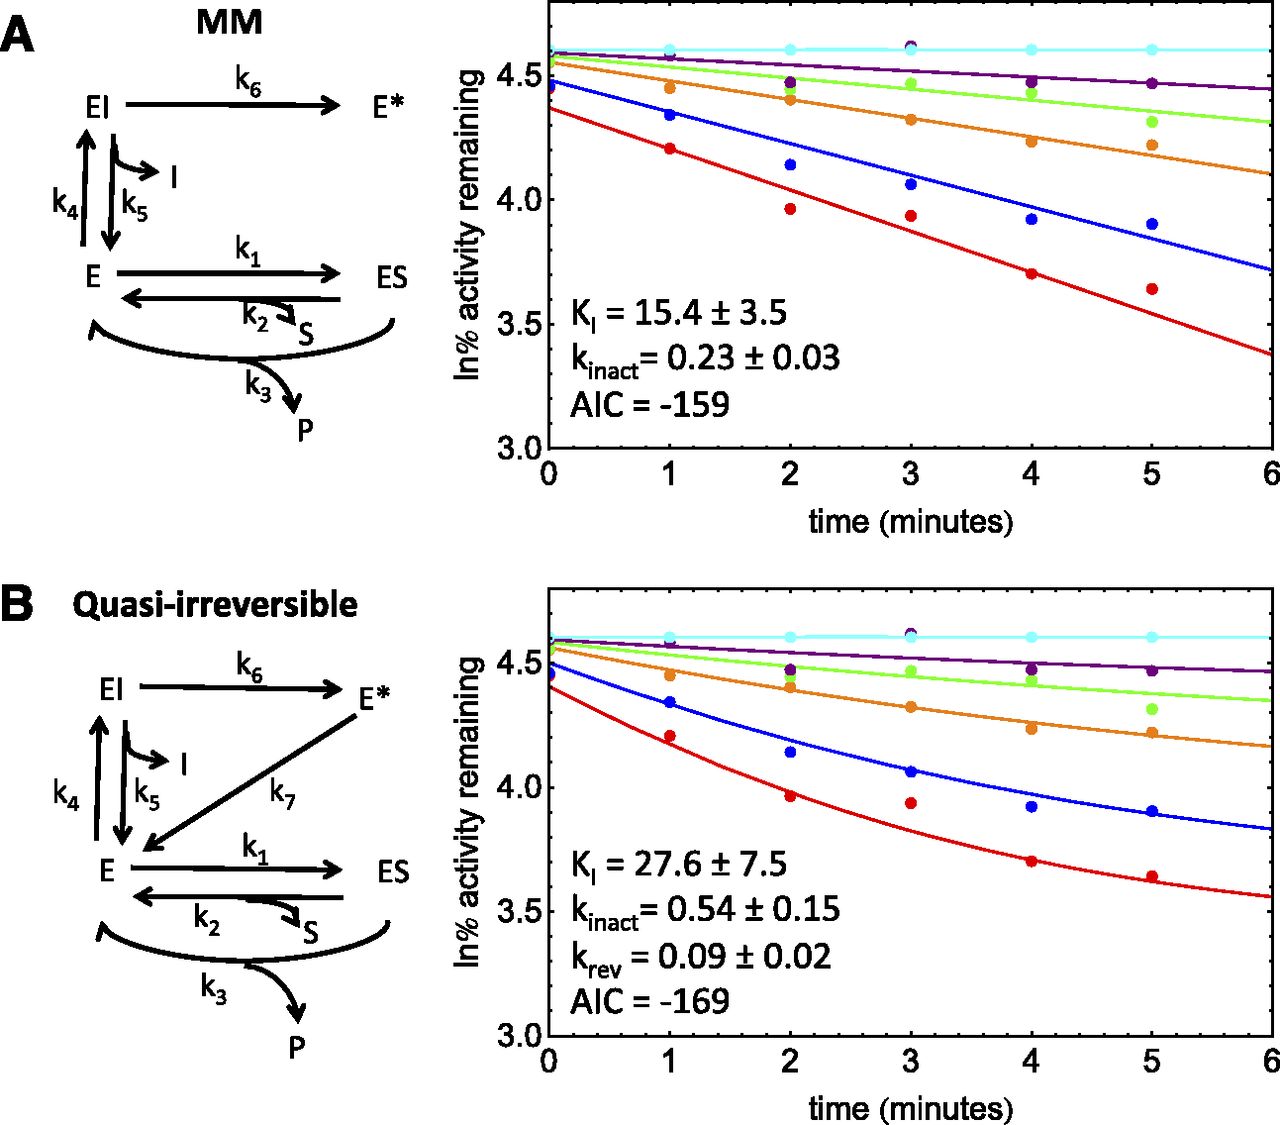
Schemes and PRA plots for the inhibition of CYP2C8 by gemfibrozil glucuronide (dataset 2). The PRA plots depict the fit with the numerical method for quasi-irreversible inactivation (A) and partial inactivation (B). ln% remaining activity, natural log of the percent remaining activity.

Scheme and PRA plot for the inhibition of CYP2B6 by PPP (dataset 3). The PRA plot depicts the fit with the numerical method. ln% remaining activity, natural log of the percent remaining activity.

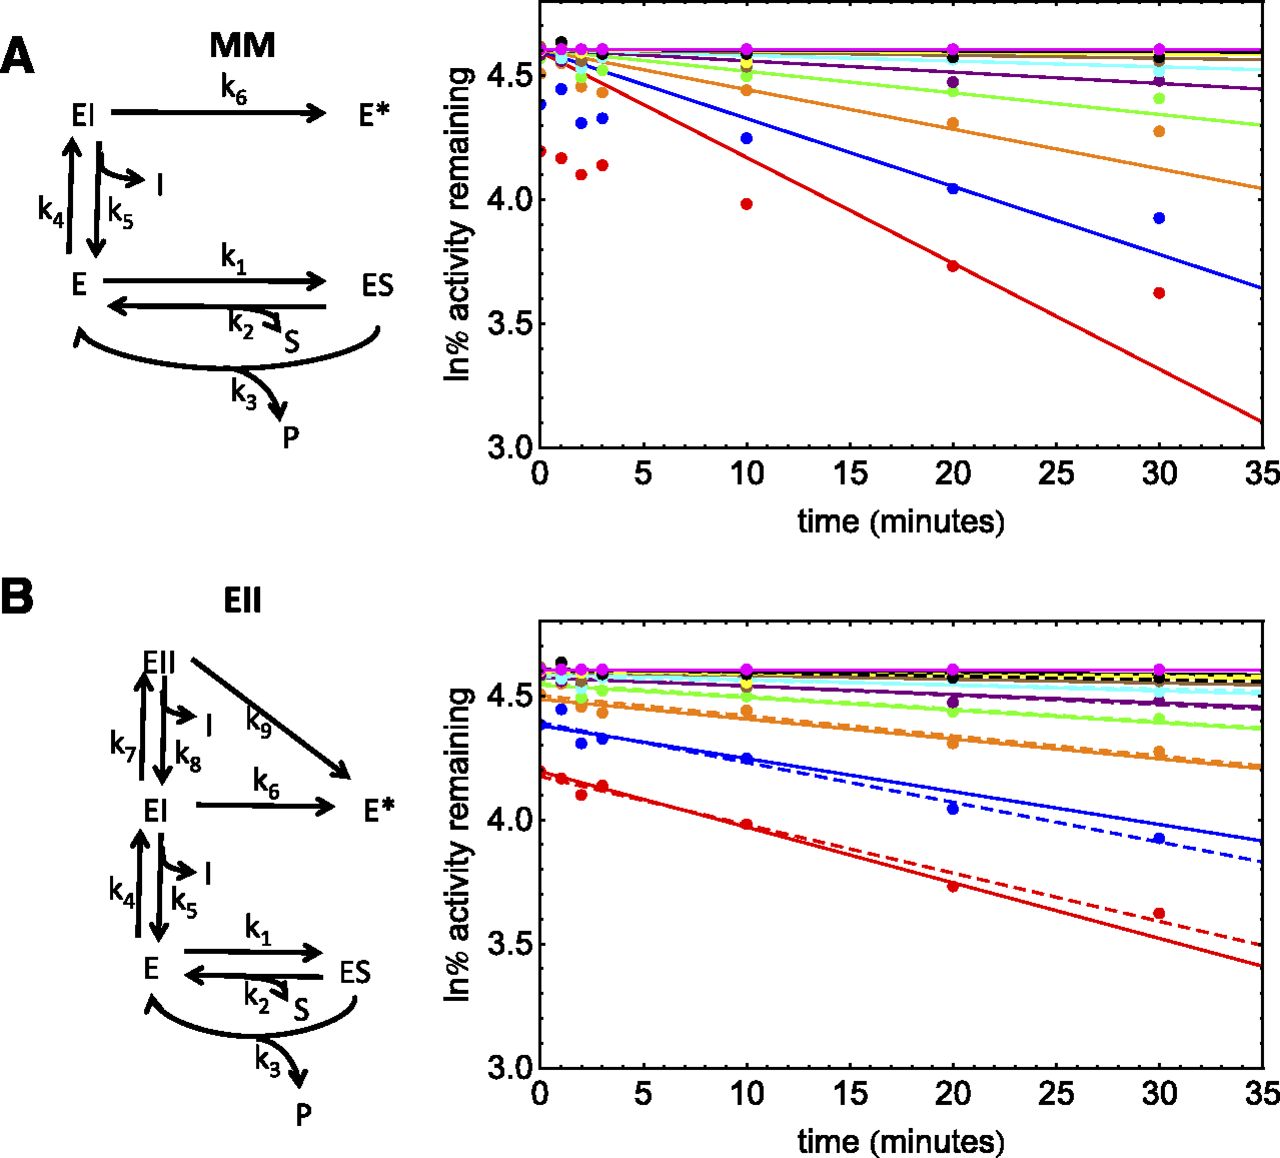
Schemes and PRA plots for the inhibition of CYP3A4 by a proprietary inactivator (dataset 4). The solid-line PRA plots depict the fit with the numerical method for MM kinetics (A) and EII kinetics (B). The dashed lines in (B) additionally depict the replot analysis. ln% remaining activity, natural log of the percent remaining activity.

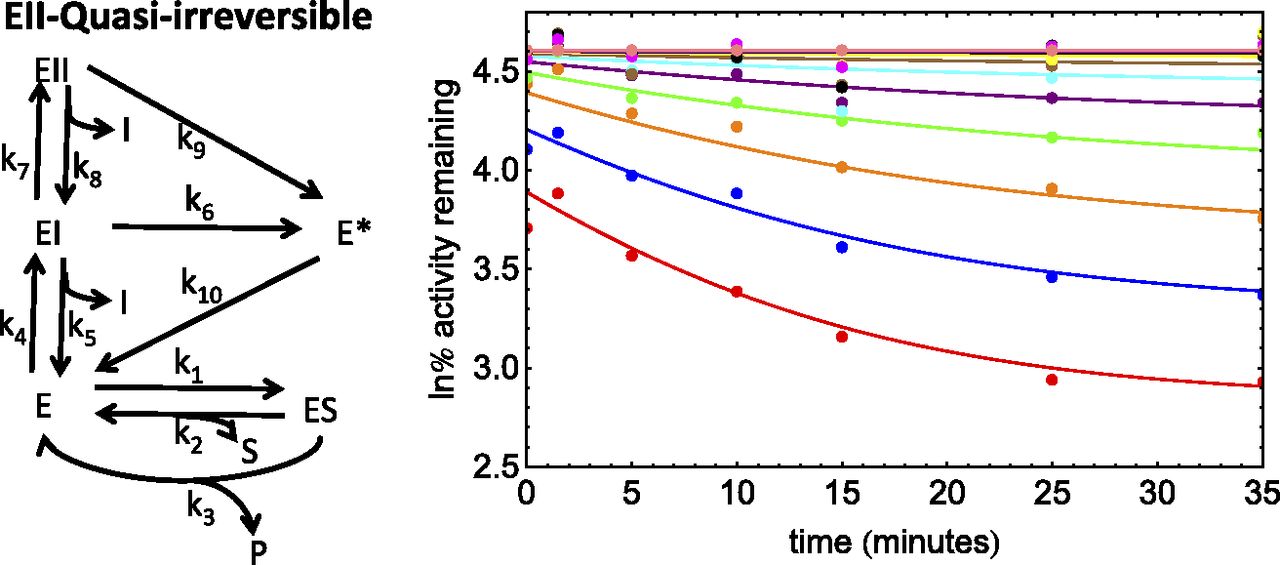
Scheme and PRA plot for the inhibition of CYP2B6 by a proprietary inactivator (dataset 5). The PRA plot depicts the fit with the numerical method. ln% remaining activity, natural log of the percent remaining activity.
Schemes and PRA plots for the inhibition of CYP2D6 by methylenedioxymethamphetamine [data digitized from Heydari et al. (2004)]. The PRA plots depict the fit with the numerical method for MM kinetics (A) and MM–quasi-irreversible kinetics (B). ln% remaining activity, natural log of the percent remaining activity.
Based on the above procedure, models with either MM or EII base schemes are chosen. To these base schemes enzyme loss and quasi-irreversible or partial inactivation are added as necessary. The numerical method is not limited to assumptions of MM kinetics and linear PRA plots. In fact, the curved regions for quasi-irreversible and partial-inactivation kinetics can help determine all relevant kinetic parameters.
As discussed in Part 1, association rate constants were fixed and dissociation rate constants were optimized to determine Km values. Optimized rate constants were constrained to be >0. For all datasets in the manuscript, all on-rate constants were fixed at 1 μM−1 s−1. The differential equations for the various models were parameterized using the NonlinearModelFit function with 1/Y weighting in Mathematica 9.0 (Wolfram Research, Champagne, IL). When fitting parameters, the NDSolve function was used for numerical solutions of the differential equations with MaxSteps → 100,000 and PrecisionGoal → ∞. When necessary, the WhenEvent function was used to simulate incubation dilution and substrate addition.
The steps above resulted in consistent convergence for most datasets. As described in Part 1, convergence issues were encountered when KI1 << KI2 and kinact2 >> kinact1. For this situation, the procedure outlined in Part 1 was used. Convergence required using finite difference derivatives (with DifferenceOrder = 3) instead of analytical derivatives during the optimization. Multiple models for each dataset were evaluated by comparing the Akaike information criteria (AIC) value for each fit (Akaike, 1974). When the AIC difference (AIC − AICmin) was <7, residual plots were examined as well.
All datasets were analyzed with the standard replot method as well (Silverman, 1995; Zhang et al., 2009; Mohutsky and Hall, 2014). This allows for the comparison of the standard replot method to the numerical methods. Analyses were performed with the approximately linear portion of the PRA plot as well as the complete dataset.
Results
Dataset 1.
The TDI for this dataset was TAO, the enzyme was CYP3A4, and the substrate was midazolam. For this experiment, in the absence of inhibitor, there was no apparent enzyme loss. After dilution, there was also no competitive inhibition (see y-intercepts in Fig. 1). However, there was clear concave upward curvature in the PRA plots (Fig. 1). Because curvature was observed even at high inhibitor concentration, inhibitor depletion could be excluded (Silverman, 1995). This led us to construct MM models with no enzyme loss for either quasi-irreversible kinetics or partial-inactivation kinetics. The AIC values for the quasi-irreversible and partial inactivation were −115 and −109, respectively. The lower AIC suggests that the quasi-irreversible model provides the best fit for these data. The fit for this model and for the standard replot method are shown in Table 2. The fit for this model using the numerical method is shown in Fig. 1. The linear fits for this dataset, using the standard replot method and all data points, are also shown in Fig. 1, with the replot shown in the inset. Although the replot method with the entire dataset generates a very good fit to a hyperbola, the resulting parameter estimates (KI = 0.31 μM, kinact = 0.062 min−1) are very different from the numerical method (KI = 0.92 μM, kinact = 0.25 min−1; Table 2). The low parameter errors for the hyperbolic fit (Fig. 1, inset; Table 2, replot, all data) highlight the fact that parameter accuracy cannot be determined when the wrong model is used. Also, for curved PRA plots, it is recommended that only the linear region of the data be used (Silverman, 1995; Grimm et al., 2009). When only the first two time points were used, the kinetic parameters were closer to those from the numerical method (KI = 1.5 μM, kinact = 0.23 min−1; Table 2).
TDI kinetic parameters for dataset 1 (TAO inhibition of CYP3A4)
Data are presented as parameter estimate ± S.E. kprod is the rate constant for metabolite formation, and krev is the rate constant for the reversible component of inactivation.
Dataset 2.
Dataset 2 utilizes gemfibrozil glucuronide as the TDI, the enzyme was CYP2C8, and the substrate was amodiaquine. Again, the data do not show enzyme loss in the absence of inhibitor and the PRA plot was concave upward (Fig. 2). MM models with no enzyme loss for both quasi-irreversible kinetics and partial-inactivation kinetics were fit to the data (Fig. 2, A and B; Table 3). The plots in Fig. 2 are very similar, even though the plateau regions will converge to different values for quasi-irreversible and to the same value for partial inactivation (Nagar et al., 2014). Statistically, the fits to the two models were indistinguishable, with both AIC values of −302.
TDI kinetic parameters for dataset 2 (gemfibrozil glucuronide inhibition of CYP2C8)
Data are presented as parameter estimate ± S.E. kprod is the rate constant for metabolite formation, krev is the rate constant for the reversible component of inactivation, kpartial is the rate constant for product formation from the covalently modified enzyme, and kalt is the rate constant for product formation from an alternate enzyme.
Another possible reason for concave upward curvature is product formation from another enzyme. Because most of the CYP2C8 was inactivated in this experiment, we fit the data to an additional model in which, after substrate addition, product is also formed by another enzyme. As expected, fit to this model is virtually indistinguishable from the partial-inhibition model (Table 3). The fitted alternate rate constant (kalt) suggests that the plateau could be due to 6% product formation by an alternate enzyme.
When the approximately linear portion of the data was used, KI, kinact, and kinact/KI values were similar to those obtained with the numerical method (Table 3).
Dataset 3.
Dataset 3 (two repeats) utilizes PPP as the TDI, the enzyme was CYP2B6, and the substrate was bupropion. The data show enzyme loss in the absence of inhibitor, and the PRA plot was concave upward (Fig. 3). In addition, the two repeats show 12% and 15% competitive inhibition upon dilution, suggesting competitive Ki values of 3.0 and 2.3 μM, respectively. Both MM and EII models with enzyme loss for both quasi-irreversible kinetics and partial-inactivation kinetics were fit to the data. For both repeats the lowest AIC values were obtained for EII with partial inactivation and enzyme loss. For example, for the second repeat the AIC values were −452, −464, −466, and −477 for MM–quasi-irreversible, EII–quasi-irreversible, MM–partial inactivation, and EII–partial inactivation, respectively. The improved fit for the EII model suggests that the discrepancy between the KI and the competitive Ki is not due to inactivation during the substrate incubation (Nagar et al., 2014). As seen in Table 4, the kinetic parameters were almost identical for the two repeats, with KI1 = 4 μΜ and KI2= 20 μΜ, kinact1 = 0.07 min−1, and kinact2 = 0.2 min−1.
TDI kinetic parameters for dataset 3 (PPP inhibition of CYP2B6)
Data are presented as parameter estimate ± S.E. kprod is the rate constant for metabolite formation, and kpartial is the rate constant for product formation from the covalently modified enzyme. Enzyme loss is modeled with the rate constant kloss.
Dataset 4.
This compound was a proprietary TDI that inactivates CYP3A4. Midazolam was the substrate used. This assay showed enzyme loss in the absence of inhibitor (∼40%). This dataset gave linear PRA plots, suggesting an absence of both quasi-irreversible and partial inactivation (Fig. 4, A and B). However, the PRA plots showed significant reversible inhibition after dilution. Analysis of the dataset suggested a KI value of ∼50 μM. This is inconsistent with the competitive inhibition observed after inhibitor dilution (Ki, ∼2 μM). As expected, the fit of an MM model to these data with the numerical method is poor (Fig. 4A; AIC = −257), since the MM model requires a single binding constant. Whereas the replot method does not require that the observed competitive inhibition after dilution match the KI, the numerical method considers all data simultaneously and cannot model these data with a single binding constant. Therefore, an EII model with enzyme loss was used for this dataset (AIC = −424).
As described in Part 1 of these manuscripts, the automatic minimization routines within the NonlinearModelFit function of Mathematica 9.0 cannot simultaneously optimize parameters when KI1 << KI2 and kinact2 >> kinact1. Therefore, the procedure outlined in Part 1 was used to optimize parameters for dataset 4. This method estimates KI1 from the low inhibitor concentration data without primary incubation and kinact2 from the plateau of a standard replot analysis. Although a local minimum close to the predicted KI1 and kinact2 (∼2 μM and 0.032 min−1, respectively) could be obtained with a KI2 value of ∼60 μM, the KI2-kinact2 surface was very flat, with other minima at higher KI2 values. Therefore, KI2 was set to 5 times the highest experimental inhibitor concentration (500 μM) and kinact2 was optimized to obtain a kinact2/KI2 value, i.e., the high inhibitor concentrations were assumed to be in the linear range. The results for these fits for two duplicate experiments are given in Table 5.
TDI kinetic parameters for dataset 4 (proprietary compound, inhibition of CYP3A4)
Data are presented as parameter estimate ± S.E. kprod is the rate constant for metabolite formation. Enzyme loss is modeled with the rate constant kloss.
Dataset 5.
This compound was a proprietary TDI that inactivates CYP2B6. Bupropion was the substrate used. This assay showed enzyme loss in the absence of inhibitor (∼30%). This dataset gave nonlinear PRA plots suggesting either quasi-irreversible or partial inactivation (Fig. 5). Also, the PRA plots showed significant reversible inhibition after dilution. Analysis of the dataset suggests a KI value of ∼120 μM. Again, this is inconsistent with the competitive inhibition observed after inhibitor dilution (Ki, ∼2 μM). Therefore, an EII model with enzyme loss, together with either quasi-irreversible or partial inactivation, was considered.
Preliminary results suggested that partial inactivation resulted in poorer fits than quasi-irreversible inactivation. This can also be seen in Fig. 5, where the terminal plateaus were dependent on inhibitor concentration.
Because KI1 << KI2 and kinact2 >> kinact1 for this dataset, the method described in Part 1 (Nagar et al., 2014) was used to obtain initial estimates, followed by automatic optimization with finite difference derivatives. The results for this fit are given in Table 6. For this model, kinact1 ≈ 0, resulting in sigmoidal kinetics. However, even a very small positive value of kinact1 will abolish sigmoidal characteristics, so the kinact1/KI1 is essentially undefined for this dataset.
TDI kinetic parameters for dataset 5 (proprietary compound, inhibition of CYP2B6)
Data are presented as parameter estimate ± S.E. kprod is the rate constant for metabolite formation, and krev is the rate constant for the reversible component of inactivation. Enzyme loss is modeled with the rate constant kloss.
Discussion
To our knowledge, the standard approach to analyze in vitro TDI data assumes MM kinetics and linear PRA plots. With P450 kinetics, there are many instances in which MM kinetics do not apply, and within the TDI literature, curved PRA plots are common (He et al., 1998; Voorman et al., 1998; Yamano et al., 2001; Heydari et al., 2004; Obach et al., 2007; Bui et al., 2008). No preset criteria were used to select the datasets in the present study, yet none of the datasets was consistent with MM-only kinetics. In our effort to find an MM-only dataset, additional internal and published datasets were analyzed. All datasets analyzed displayed either non-MM kinetics or curved PRA plots (data not shown).
Of the five datasets analyzed, two (1 and 2) are fit best by a base model of MM kinetics. However, both datasets exhibit concave upward PRA plots (Figs. 1 and 2). In the case of dataset 1 (TAO inhibition of CYP3A4), the best fit is clearly with a quasi-irreversible MM model. Mechanistically, the data are consistent with the reversible conversion of inactivated enzyme over time in the in vitro incubation. Some amines, including TAO, are known to form metabolic-intermediate complexes (MICs) through conversion to nitroso compounds and are classified as quasi-irreversible inhibitors.
In addition to nitroso groups, another functionality that forms MICs is the methylenedioxy aromatics, which are often activated to carbene MICs (Dahl and Hodgson, 1979; Ortiz de Montellano and Correia, 1995). This results in quasi-irreversible inhibition, similar to the activation of some alkylamines to nitroso compounds. Although none of the five TDIs here contains methylenedioxy groups, one such published dataset was evaluated, namely inhibition of CYP2D6 by methylenedioxymethamphetamine (Heydari et al., 2004). It was anticipated that this dataset would have an MM base because CYP2D6 is unlikely to display EII binding kinetics (McMasters et al., 2007). Analysis by the MM-only and MM–quasi-irreversible models is shown in Fig. 6, A and B. As seen by the AIC values, this dataset is most consistent with quasi-irreversible kinetics. The significant curvature for this and other compounds such as paroxetine (Bertelsen et al., 2003) suggests that, in vitro, the MICs are reversible within the primary incubation time frame. Thus, for MICs formed both from amines and methylenedioxy compounds, model analyses are consistent with reversible MIC formation in vitro.
Dataset 2, gemfibrozil glucuronide inhibition of CYP2C8, also has a curved PRA plot. In a PRA plot, partial inactivation will result in a terminal plateau independent of inhibitor concentration and determined by the fractional remaining enzyme activity. In contrast, the terminal plateaus for quasi-irreversible inactivation depend on inhibitor concentration. Because most of the CYP2C8 was consumed in this experiment, another possibility is the formation of product by an alternate enzyme. For dataset 2, it is not possible to statistically distinguish between quasi-irreversible, partial-inactivation, and alternate-pathway model fits. However, gemfibrozil glucuronide does not contain any of the typical functional groups associated with MIC formation, suggesting that either partial inactivation or an alternate enzyme pathway may be more likely. When there are insufficient data to distinguish between quasi-irreversible and partial inhibition (see Fig. 2), an experimental design that includes longer primary incubation times will better characterize the terminal plateaus of the PRA plots and help determine the mechanism of inactivation. As expected for MM-type data, KI, kinact, and kinact/KI are similar for the numerical method and when using linear time points for the standard replot method (Table 3).
Datasets 3, 4, and 5 are best fit with an EII base model. Dataset 3 shows partial inactivation with a base EII model. The observation of partial inactivation is expected since the substrate (PPP) is a derivative of phencyclidine, which is known to cause partial inactivation of CYP2B6 (Shebley et al., 2009). Although the data are most consistent with the EII–partial-inactivation model, the ratio of kinact1/KI1 is similar to the kinact/KI value obtained with the replot method when all the data are used. When only the linear portion is considered, the replot results would underestimate TDI at low inhibitor concentrations (Table 4).
As discussed in Part 1 (Nagar et al., 2014), there are convergence issues when KI1 << KI2 and kinact2 > kinact1. When kinact2 is not experimentally defined (i.e., insufficiently high inhibitor concentrations), modeling can only provide an estimate of the ratio kinact2/KI2 (dataset 4). Convergence is improved when partial or quasi-irreversible inactivation occurs. This is because the plateau regions at long primary incubation times help define kinact2 (datasets 3 and 5). For both datasets 3 and 4, the kinact/KI ratios are ∼3-fold higher with the numerical method compared with the replot method (Tables 4 and 5). This is due to biphasic EII kinetics. The replot method underpredicts kinact/KI for datasets 3 and 4, but overpredicts kinact/KI for dataset 5 due to its sigmoidal characteristics. The origin of this difference is detailed in Part 1.
The ability to predict clinical DDIs requires accurate estimation of TDI kinetic parameters. For quasi-irreversible inactivation due to MIC formation, the in vitro data are consistent with reversibility within the incubation time frame. Observations that corroborate in vitro reversibility include removal of nitroso-derived MICs and restoration of enzymatic activity by dialysis (Ma et al., 2000) and displacement of methylenedioxyphenyl complexes with hydrophobic substrates (Dickins et al., 1979). However, it is unknown whether and to what extent reversible events occur in vivo. Although drug interactions are overpredicted for nitroso-mediated TDIs (Wang, 2010), it is clear that the observed in vitro reversibility is much faster than the rate of enzyme recovery in vivo. Resynthesis rates of 0.019–0.007 h−1 (t1/2 = 36–90 hours) have been reported for the CYP3A enzyme (Obach et al., 2007; Xu et al., 2009; Rowland Yeo et al., 2011), whereas the observed in vitro reversible rate constants are much faster (for TAO, t1/2 = 0.37 hour). Thus, while there is experimental evidence for in vitro reversibility of MICs, the calculated kinact and krev alone do not directly define enzyme loss in vivo. Possible reasons for this include increased reversibility in vitro due to altered redox activity, increased degradation of the MIC in vivo, or further conversion of the MIC to a permanently inactive enzyme that is not captured in the time frame of most incubations. Further studies are required to determine the origin of the discrepancy between in vitro and in vivo data. Therefore, accurate IVIVCs with in vitro quasi-irreversible data require an understanding of the existence and relative contribution of in vivo reversibility. In the absence of in vivo reversibility, the only advantage of the numerical method may be a more accurate estimation of kinetic parameters. If reversibility must be considered, the numerical method provides the ability to estimate krev.
Whereas quasi-irreversible and partial inactivation may give similar PRA plots, the mechanism of inactivation can have significant clinical implications. For partial inactivation, the clinical consequences are complex. Partial inactivation is likely due to a covalent modification of the P450 apoprotein that diminishes but does not eliminate activity (Crowley and Hollenberg, 1995; Hollenberg et al., 2008). The extent of inactivation will likely vary with substrate (victim drug). Also, there is the possibility of false negatives where one drug may not be a victim but others are. This situation is analogous to the impact of multi-substrate binding kinetics for CYP3A4 inhibition. The potential for false negatives has resulted in the use of more than one substrate for CYP3A4 competitive inhibition studies (Walsky and Obach, 2004).
Structural and kinetic studies provide mechanistic evidence that multiple substrates can simultaneously bind to P450 enzymes (Li and Poulos, 2004; Schoch et al., 2008; Kapelyukh et al., 2008; DeVore and Scott, 2012; Shah et al., 2012). The results of simulations in Part 1 show that EII kinetics can be not only identified but also accurately parameterized with the numerical method. Of the somewhat limited number of datasets considered in this manuscript, it is interesting that three require EII kinetics (Tables 4–6). All three examples have KI1 < KI2 and kinact1 < kinact2. The DDI prediction at higher inhibitor concentrations (kinact/KI) with the replot method is lower, higher, and similar compared with the numerical method (Tables 4–6, respectively). At low inhibitor concentrations, the replot method will tend to underestimate DDIs when biphasic kinetics are involved (see Part 1 [Nagar et al., 2014]; see also Tables 4 and 5).
As shown in Part 1 (Nagar et al., 2014), the kobs values can be fit to nonhyperbolic EII models (see modified replot method) and multi-inhibitor parameters can be calculated. However, due to propagation and magnification of experimental errors, this approach could not be used with any of the datasets in this manuscript. The numerical method considers all data simultaneously, and multi-inhibitor parameters can be calculated with lower errors. It remains to be determined whether the additional parameters that are obtained with the numerical method and with more complex models will improve IVIVCs.
Finally, it must be noted that other complexities expected for P450 enzyme TDI kinetics have not been discussed. For example, multiple binding events for the inhibitor have been modeled, but simultaneous binding of substrate and inhibitor has not been considered. There are many examples in which the presence of one compound can increase the rate of metabolism of a second (i.e., heteroactivation) (Ueng et al., 1997; Korzekwa et al., 1998; Kenworthy et al., 2001). This is presumably due to an ES1S2 complex resulting in either increased affinity or velocity of one substrate in the presence of another. For TDI experiments, it is likely that an ESI complex can be formed and could result in complex kinetics ranging from inhibition to activation. Another complexity outside the scope of this manuscript is sequential metabolism leading to TDI (Hanson et al., 2010), which, when kinetically discernible, results in concave downward PRA plots (data not shown).
In summary, a new numerical method has been applied to five TDI datasets. None of the datasets exhibited MM-only kinetics, and the numerical method allowed use of more complex models to fit each dataset. Quasi-irreversible as well as partial-inhibition kinetics were observed and parameterized. Three datasets required the use of an EII (multi-inhibitor) binding model. Together with the results in Part 1 (Nagar et al., 2014), a new numerical method for analysis of in vitro TDI data has been developed and applied to improve the accuracy of the kinetic parameters. Although it is unknown if this method will result in improved IVIVCs, we believe that it provides tools for exploration and incorporation of complex kinetic schemes into TDI analyses.
Authorship Contributions
Participated in research design: Korzekwa, Tweedie, Argikar, Nagar.
Conducted experiments: Whitcher-Johnstone, Bickford, Bell, Korzekwa, Nagar.
Performed data analysis: Nagar, Korzekwa.
Wrote or contributed to the writing of the manuscript: Nagar, Korzekwa, Tweedie.
Footnotes
- Received March 24, 2014.
- Accepted June 17, 2014.
This research was supported by National Institutes of Health National Institute of General Medical Sciences [Grant R01-GM104178].
Abbreviations
- AIC
- Akaike information criterion
- DDI
- drug-drug interaction
- E
- enzyme
- I
- inhibitor
- IVIVC
- in vitro–in vivo correlation
- kobs
- rate of enzyme loss
- kinact
- inactivation rate constant
- KI
- binding constant
- MIC
- metabolic-intermediate complex
- MM
- Michaelis-Menten
- P
- product
- P450
- cytochrome P450
- PPP
- 2-phenyl-2-(1-piperidinyl)propane
- PRA plot
- log percent remaining activity versus primary incubation time plot
- S
- substrate
- t1/2
- half-life
- TAO
- troleandomycin
- TDI
- time-dependent inhibitors or time-dependent inhibition
- Copyright © 2014 by The American Society for Pharmacology and Experimental Therapeutics


