


Abstract
Hepatic OATPs 1B1, 1B3 and 2B1, as well as P-gp, play important roles in regulating liver uptake and biliary excretion of drugs. The intrinsic ethnic variability in OATP1B1-mediated hepatic uptake of statins has been proposed to underlie the ethnic variability in plasma exposures of statins between Caucasians and Asians. Using a targeted quantitative proteomic approach, we determined hepatic protein concentrations of OATP1B1, OATP1B3, OATP2B1, P-gp, and PMCA4 (a housekeeping protein) in a panel of human livers (n = 141) and compared protein expression across Caucasian, Asian, African-American, and unidentified donors. Using an optimized protocol that included sodium deoxycholate as a membrane protein solubilizer, the hepatic protein expression levels (mean ± S.D.) of these transporters across all livers were determined to be 15.0 ± 6.0, 16.1 ± 8.1, 4.1 ± 1.3, 0.6 ± 0.2, and 2.4 ± 1.0 fmol/μg of total membrane protein, respectively. The scaling factor was 3.5 mg of total membrane protein in 100 mg of wet liver tissue. OATP1B1 protein expression was significantly associated with the c.388A>G (rs2306283, N130D) single nucleotide polymorphism. When compared across ethnicity, the hepatic expression levels of OATP1B1 and OATP1B3 were unexpectedly higher in Asians relative to Caucasians, suggesting that hepatic OATP expression alone does not explain the increased systemic statin levels in Asians compared with Caucasians. These findings may help improve physiologically based pharmacokinetic modeling to predict statin pharmacokinetic profiles and enable extrapolation of pharmacokinetic data of OATP substrates across ethnic groups.
Introduction
OATPs 1B1, 1B3, and 2B1 belong to the SLC superfamily and mediate the sodium-independent hepatic uptake of diverse substrates across the sinusoidal membrane of human hepatocytes, including statins, angiotensin II receptor antagonists, bilirubin, and bile acids (Giacomini et al., 2010). OATP1B1 (SLCO1B1) and OATP1B3 (SLCO1B3) are primarily expressed in the liver, whereas OATP2B1 (SLCO2B1) is expressed in various tissues, such as liver, intestine, and heart (Kalliokoski and Niemi, 2009). The inhibition of these transporters contributed to the significant increase in statin blood concentrations following cyclosporine administration in humans (Simonson et al., 2004; Neuvonen et al., 2006). P-gp is a member of the ABC superfamily of membrane transporters and is expressed in multiple organs of drug disposition (e.g., liver, small intestines, kidney, and blood-brain barrier) (Schinkel and Jonker, 2003). In the liver, it is localized in the canalicular membrane of hepatocytes, playing a role in the biliary excretion of drugs and endogenous substrates.
Association of genetic polymorphisms in the OATP1B1 gene with alterations in the pharmacokinetic properties of its substrates has been reported and reviewed (Niemi et al., 2011). The single nucleotide polymorphism (SNP) c.521T>C (rs4149056, V174A) results in decreased transport activity due to decreased membrane expression (Tirona et al., 2001), whereas the functional consequences of the c.388A>G (rs2306283, N130D) SNP remain controversial. These two relatively common SNPs form four distinct haplotypes: *1A (c.388A-c.521T), *1B (c.388G-c.521T), *5 (c.388A-c.521C), and *15 (c.388G-c.521C). In general, the OATP1B1*5 and *15 genotypes confer decreased hepatic uptake, resulting in an increased systemic exposure of substrates, whereas OATP1B1*1B is associated with decreased systemic exposure due to enhanced hepatic uptake (Niemi et al., 2011). OATP1B1 SNPs c.463C>A (rs11045819, P155T) and -11187G>A (rs4149015) were reported to be in linkage disequilibrium with c.521T>C (rs4149056) and c.388A>G (rs2306283), respectively (Niemi et al., 2011), and hence were evaluated in the present study to understand the impact of the individual variants on OATP1B1 protein expression.
Ethnic variability has been observed in the plasma exposures of statins between Caucasian and Asian populations, as in the case of rosuvastatin (Lee et al., 2005; Birmingham et al., 2015). In the latest report by Birmingham et al. (2015), the average rosuvastatin area under the time-concentration curve in East Asians living in the United States was between 64% and 84% higher than that in Caucasians living in the same environment. Tomita et al. (2013) concluded that this variability is independent of the OATP1B1 genotype (for the already discovered important SNPs); instead, an intrinsic ethnic variability in OATP1B1-mediated hepatic uptake clearance has to be considered (the Japanese/Caucasian ratio was 0.58). One possible explanation is that the hepatic expression level of OATP1B1 is different between the two races and that Asians have a lower intrinsic hepatic clearance of some statins due to lower hepatic expression of OATP1B1, which is independent of the OATP1B1 genotype.
Recent advances in mass spectrometry (MS)–based quantitative proteomics allow absolute quantification of drug-metabolizing enzymes and drug transporters in subcellular fractions (e.g., microsomes and plasma membrane) derived from tissues, cultured primary cells, and cell lines using signature tryptic peptides (i.e., surrogate, AQUA, or proteotypic peptides) (Fallon et al., 2008; Kamiie et al., 2008; Li et al., 2008; Wang et al., 2008). Several groups have reported MS-based methods for absolute quantification of OATPs 1B1, 1B3, and 2B1 (Ji et al., 2012; Ohtsuki et al., 2012; Balogh et al., 2013; Prasad et al., 2014). However, significant differences in sample preparation and final quantification exist (Table 1). For example, Ji et al. (2012) compared the trypsin digestion efficiency of membrane-bound human OATPs solubilized in the buffer supplied in a plasma membrane extraction kit to those solubilized in an acid-labile MS-compatible surfactant RapiGest SF (Waters Corp.). The results showed that RapiGest SF was superior to the kit-supplied buffer in solubilizing the membrane proteins, resulting in an approximate 2.5-fold increase in tryptic peptide MS signals. Balogh et al. (2013) further compared the tryptic digestion efficiency of OATPs solubilized in ammonium bicarbonate (AmBC) buffer alone or AmBC buffers containing guanidine, deoxycholate (DOC), or another MS-compatible surfactant ProteaseMAX (PMAX) (Promega Corp., Madison, WI), and found that DOC and PMAX outperformed others in providing solubilization and denaturation following resuspension in the kit-supplied buffer. As a result, different sample preparation protocols adopted by different laboratories have resulted in divergent estimates of OATP expression (mean ± S.D.) in the human liver, ranging from 2.0 ± 0.9 fmol/μg of membrane protein (n = 64) with AmBC alone (Prasad et al., 2014) to 10.6 ± 5.3 fmol/μg (n = 4) with DOC (Balogh et al., 2013), despite using the same signature peptide.
Comparison of absolute protein quantification of OATP1B1, OATP1B3, OATP2B1, and P-gp in human livers by different studies
The objectives of this study were 2-fold. First, in order to optimize a targeted quantitative proteomic method, several commonly used MS-compatible membrane protein solubilizers were compared for absolute quantification of human OATPs, P-gp, and PMCA4 (a housekeeping protein) (Calcagno et al., 2006). Second, using the optimized method, ethnic variability in the hepatic expression of human OATPs and P-gp was determined in a panel of human liver samples and analyzed for association with OATP1B1 genotypes.
Materials and Methods
Chemicals and Reagents.
Sodium DOC (Na-DOC), AmBC, dithiothreitol, and iodoacetamide were purchased from Sigma-Aldrich (St. Louis, MO). RapiGest SF and sodium 3-(4-(1,1-bis(hexyloxy)ethyl)pyridinium-1-yl)propane-1-sulfonate (PPS) Silent Surfactant were purchased from Waters Corp. (Milford, MA) and Protein Discovery, Inc. (Knoxville, TN), respectively. Sequencing-grade modified trypsin and ProteaseMAX surfactant were purchased from Promega Corp. The ProteoExtract Native Membrane Protein Extraction Kit was purchased from EMD Millipore Biosciences (Billerica, MA). The BCA Protein Assay Kit was purchased from Pierce Biotechnology (Rockford, IL). All AQUA ultimate-grade signature peptides were synthesized, purified, and quantified by Thermo Fisher Scientific (Ulm, Germany). AQUA ultimate-grade peptides were delivered by the vendor as individual solution in 5% (v/v) acetonitrile in water with >97% purity based on high-performance liquid chromatography (LC) UV analysis (monitored at 215 nm) and a concentration of 5 pmol/μl (±5%) based on amino acid analysis. Optima-grade acetonitrile and Optima LC/MS-grade water and formic acid were purchased from Thermo Fisher Scientific (Fair Lawn, NJ).
Human Liver Tissues.
A total of 141 single-donor human liver tissue samples were used in this study, which included 102 Caucasian livers, 18 Asian livers, five African-American livers, and 16 livers with unknown ethnic background (Supplemental Table 1). These tissues were obtained from various sources including the Medical College of Wisconsin (Milwaukee, WI), Medical College of Virginia (Richmond, VA), Indiana University School of Medicine (Indianapolis, IN), University of Pittsburgh (Pittsburgh, PA), BD Gentest (Woburn, MA), and Xenotech (Lenexa, Kansas). These livers were obtained under protocols approved by the appropriate committees for the conduct of human research. DNA samples were isolated from each tissue using the Promega Maxwell 16 instrument (Promega, Madison, WI) according to the manufacturer’s instructions. All liver tissues were stored at −80°C until analysis.
OATP1B1 Genotyping.
Four OATP1B1 SNPs, 388A>G (rs2306283), 463C>A (rs11045819), 521T>C (rs4149056), and -11187G>A (rs4149015), were determined in the human liver bank using the drug metabolizing enzyme and transporter gene assay system (version 1 or 2; Affymetrix, Santa Clara, CA) (Dumaual et al., 2007) in GLP-compliant laboratories (Eli Lilly and Company, Indianapolis, IN). The exceptions were that 13 out of the 18 Asian samples were examined for only two SNPs (388A>G and 521T>C) by Sanger sequencing at Polymorphic DNA Technologies (Alameda, CA). Hardy-Weinberg equilibrium was determined at the SNP level in different racial groups by the traditional two-way table method. No SNPs were out of Hardy-Weinberg equilibrium (all P > 0.05). The observed minor allele frequency of each variant was calculated within each racial group, and was found to be comparable with the available allele frequencies determined in the dbSNP database (Sherry et al., 2001).
Membrane Protein Extraction.
Total membrane protein was extracted from human liver tissue using the ProteoExtract Native Membrane Protein Extraction Kit according to the manufacturer’s protocol. Briefly, thawed liver tissue (25–60 mg) was homogenized in 2 ml of extraction buffer I containing a protease inhibitor cocktail supplied in the kit, using a PowerGen homogenizer (Model 125; Thermo Fisher Scientific). Following 15-minute incubation at 4°C, the samples were centrifuged at 16,000g for 15 minutes at 4°C. The supernatant, which contained soluble proteins, was removed and the pellet resuspended in 1 ml of extraction buffer II containing a protease inhibitor cocktail supplied in the kit. Following 30-minute incubation at 4°C, the resuspended samples were centrifuged at 16,000g for 15 minutes at 4°C and the supernatants (membrane protein), which contained membrane proteins, were collected. The pellet was resuspended with 10% (w/v) Na-DOC (0.1 ml) overnight at 4°C and centrifuged at 16,000g for 15 minutes at 4°C. The resulting supernatant was combined with the previous membrane protein fraction and stored at −80°C until further analysis. The extraction buffer II pellet was resuspended with extraction buffer II (0.05 ml) and further diluted with water (0.15 ml). Total cellular protein concentration and protein concentrations of the membrane protein fractions and other extraction fractions were determined using the BCA assay with bovine serum albumin for the calibration standards.
Membrane Protein Solubilization and Trypsin Digestion.
To compare the effects of different membrane protein solubilizers, extracted membrane protein (50 μg) was diluted into an AmBC buffer (45 mM, pH 8.0) containing either 10% (w/v) Na-DOC, 0.225% (w/v) PPS, 0.225% (w/v) RapiGest SF, or 0.225% (w/v) PMAX. Aliquots (90 μl) were heat denatured at 50°C for 30 minutes in the presence of 4 mM dithiothreitol, followed by alkylation with 10 mM iodoacetamide for 20 minutes in the dark at room temperature. Prior to digestion, samples were diluted with AmBC buffer (45 mM, pH 8.0), such that the Na-DOC concentration was reduced to 1% (w/v) and the PPS, RapiGest SF, and PMAX concentrations were reduced to 0.1% (w/v) during tryptic digestion. Trypsin was added to the samples at a 20:1 protein:trypsin ratio and reactions were carried out at 37°C for 18 hours, according to previously reported optimal conditions (Ji et al., 2012; Balogh et al., 2013). Reactions were quenched with acidified acetonitrile containing stable isotope-labeled signature peptides as internal standards. Final samples contained approximately 0.5% (v/v) formic acid and 5% (v/v) acetonitrile. The samples were centrifuged at 14,000g for 15 minutes at 4°C, and then the supernatants were transferred to clean sample plates. For supernatants that contained Na-DOC, they were further concentrated in a SpeedVac Plus concentrator (model SC110A; Thermo Fisher Scientific), followed by resuspension in 150 μl of 5% (v/v) acetonitrile containing 0.5% (v/v) formic acid. Final samples were stored at −20°C prior to ultraperformance LC–tandem MS (LC-MS/MS) analysis.
Signature Peptide Selection.
Signature peptides (Table 2) were selected based on previously reported criteria (Wang et al., 2008), which included size (about 6–20 residues), uniqueness of signature peptides, a lack of nonsynonymous SNP sites and known post-translational modification (PTM) sites (e.g., phosphorylation and glycosylation), no adjacent proteolysis sites (RR, KK, KR, and RK) (except for OATP1B1_pep9_L), and are free of methionine and deamidation/hydrolysis motifs (e.g., DP, NG, and QG) that readily cause peptide degradation. All signature peptides were previously used in studies by other laboratories, except OATP1B1_pep3_L and PMCA4_pep4_L (Table 2). Synthetic peptides were dissolved in 5% (v/v) acetonitrile and stored at −20°C.
Signature peptides for human OATP1B1, OATP1B3, OATP2B1, P-gp, and PMCA4
Preparation of Calibration Standards.
Calibration standards, composed of nine unlabeled signature peptides for OATP1B1, OATP1B3, OATP2B1, P-gp, and PMCA4, ranged from 0.0667 to 133 nM (Table 2). To account for matrix effects during LC-MS/MS analysis and to normalize the total protein content in all samples and standards, heat-treated (56°C for 30 minutes) Swiss Webster mouse plasma (50 μg) was spiked into each calibration standard. Regular polypropylene microcentrifuge tubes and microplates were used to prepare standards and samples. Preliminary results showed that the use of human plasma, human serum albumin, bovine serum albumin, or rat liver homogenate was not suitable as the matrix due to interference with the PMCA4 signature peptide. Quality control samples were prepared separately from calibration standards at 0.67, 8.3, 33.3, and 100 nM, which also contained the mouse plasma (50 μg) as the background matrix. Similar to liver membrane protein samples, calibration standards and quality controls were solubilized, reduced, alkylated, and digested with trypsin as described previously. The CVs for the ultraperformance LC-MS/MS analysis of signature peptides were determined by measuring triplicate preparations of each quality control.
Ultraperformance LC-MS/MS Analysis.
After trypsin digestion, peptide samples (10 μl per injection) were separated on a Waters UPLC analytical column (BEH130 C18, 1.7 μm, 2.1×100 mm) and quantified using a Waters Xevo TQ-S triple quadrupole MS (Foster City, CA) coupled with a Waters Acquity I-Class UPLC system. To optimize MS conditions for multiple reaction monitoring (MRM) analysis, synthetic signature peptides were infused with a supplementary mobile phase flow into the triple quadrupole MS equipped with an electrospray ion source. The optimum collision energy and precursor/product ion masses for the signature peptides are summarized in Table 2. For UPLC separation, the mobile phases consisted of (A) 100% water containing 0.1% (v/v) formic acid and (B) 100% acetonitrile containing 0.1% (v/v) formic acid. After a 0.5 minute initial hold at 5% B, the mobile phase composition was increased linearly to 40% B over 9 minutes at a flow rate of 0.4 ml/min, followed by a 2-minute wash at 95% B. The column was re-equilibrated with 5% B for 2 minutes before injecting the next sample.
Data Analysis.
One-way analysis of variance (ANOVA) followed by post hoc test using Dunnett’s adjustment was used to compare the effect of membrane protein solubilizers on ultraperformance LC-MS/MS quantification of membrane transporters. ANOVA followed by post hoc test using Tukey’s adjustment was used to compare ethnic differences in the membrane transporter abundance in human livers. Student’s t test (unpaired, two-tailed) was used to compare OATP1B1 hepatic protein expression based on allelic variations for c.463C>A, c.521T>C, and -11187G>A. ANOVA followed by post hoc test using Tukey’s adjustment was used to compare OATP1B1 hepatic protein expression based on allelic variations for c.388A>G. A P value of less than 0.05 was considered statistically significant.
In addition, an ANOVA model was used to evaluate the ethnic difference between Asian and Caucasian subjects. Other variables, including gender, age, and two SNPs (rs2306283 and rs4149056), were included in the ANOVA model to adjust for potential confounding effects. The other two SNPs (rs11045819 and rs4149015) were not included because the allelic information for them was not available in some Asian samples. Multivariate linear regression models were used to assess the relationship between the abundance of the transporters and candidate factors (age, gender, rs2306283, rs11045819, rs4149056, and rs4149015). The forward-backward model selection method was used to select the model that minimized the Akaike information criterion (Akaike, 1974). Such models are best balanced between the goodness of fit and the complexity of the resulting model. Because only a few Asian subjects had complete allelic information for the four SNPs included in this study, the model only was evaluated in Caucasian subjects. Because the distributions of the abundance for some transporters were highly right skewed, appropriate transformations were applied to avoid serious violation with the key assumption of linear regression models (i.e., residuals being normally distributed). The log transformation was applied to PMCA4, OATP1B1, and P-gp and the squared-root transformation was applied to OATP1B3 (based on OATP1B3_pep2). Meanwhile, the distribution of OATP2B1 was still highly non-Gaussian even after taking either the log or squared-root transformation. Therefore, this transporter was excluded from the regression analysis. When multiple transporters were evaluated simultaneously, the resulting P values were adjusted using the Benjamini-Hochberg method (Benjamini and Hochberg, 1995) to control the false-discovery rate.
Results
Separation and Detection of Signature Peptides for Human OATP1B1, OATP1B3, OATP2B1, P-gp, and PMCA4.
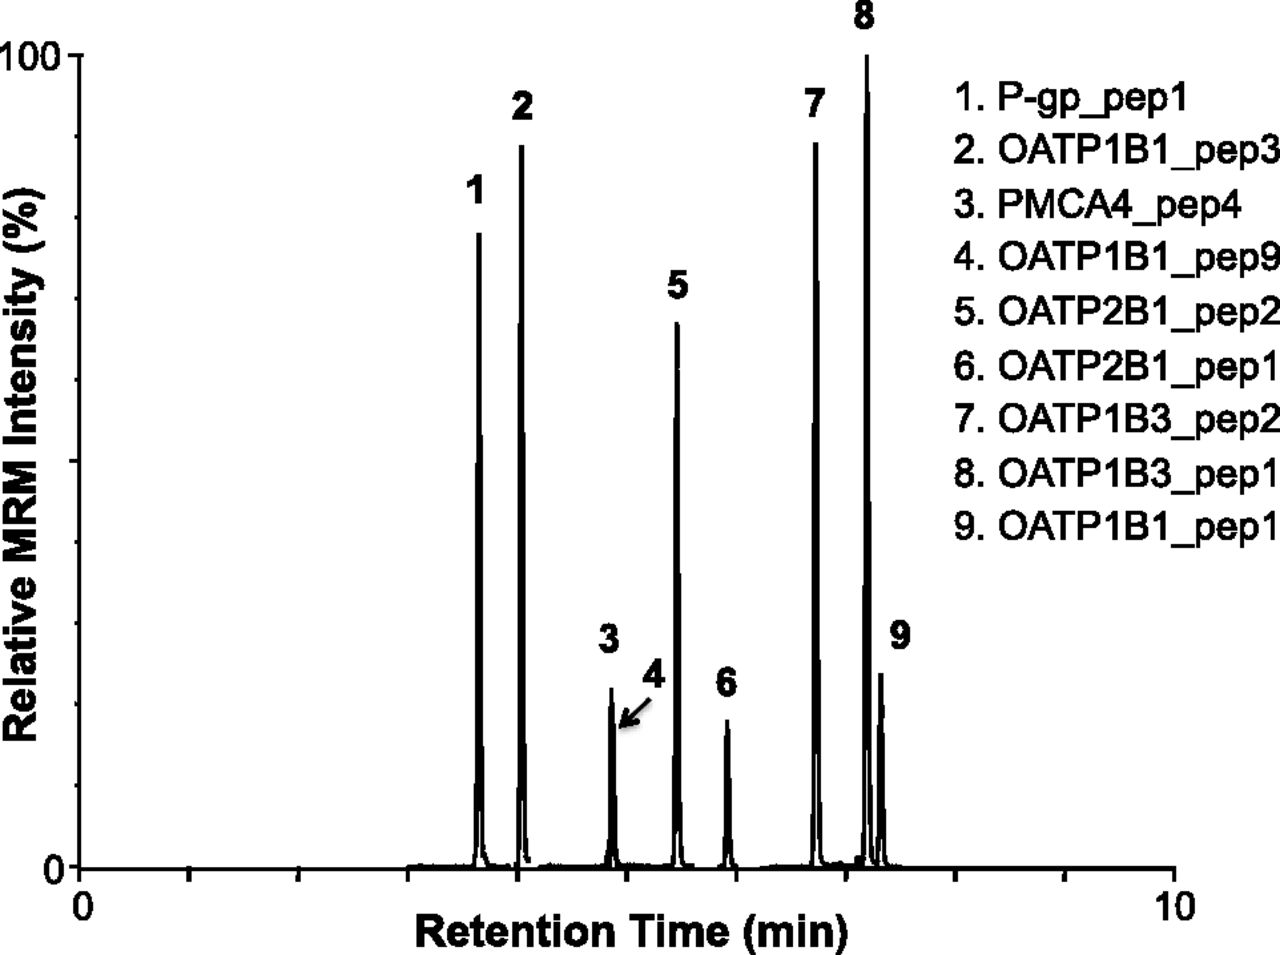
Using UPLC for separation and MRM for MS detection, all signature peptides were specifically detected (Fig. 1). Synthetic peptide standards (stable isotope-labeled or unlabeled) were helpful in determining correct LC retention times of the signature peptides when multiple peaks for the MRM transition were observed. In addition, the identity of MRM peaks was verified by monitoring a second MRM transition for the same peptide (data not shown). In the final MS method, MRM detection windows centered on the expected retention time of each peptide were used to optimize the cycle time and dwell time for higher sensitivity, accuracy, and reproducibility, allowing the monitoring of more MRM transitions (>30) in a single chromatographic run. The lower and upper limits of quantification and CV for each peptide (prepared as calibration standards) are summarized in Table 3.

Ultraperformance LC-MS/MS analyses of a synthetic signature peptide mixture for OATP1B1, OATP1B3, OATP2B1, P-gp, and PMCA4. The MRM transitions monitored for each stable isotope-labeled signature peptide are summarized in Table 2.
Analytical performances of the ultraperformance LC-MS/MS assays for signature peptide standards
Comparison of Membrane Protein Solubilizers during Extraction and Quantification by Ultraperformance LC-MS/MS.
The effect of different membrane protein solubilizers (i.e., Na-DOC, PPS, RapiGest SF, and PMAX) on ultraperformance LC-MS/MS quantification of OATPs, P-gp, and PMCA4 were compared with results obtained in the absence of any solubilizers (Fig. 2). In general, the presence of membrane protein solubilizers significantly increased the MRM signals of signature peptides derived from trypsin-digested membrane proteins extracted from a human liver sample. Among the four solubilizers examined, Na-DOC generally showed equal or better performance for all transporters examined. As such, Na-DOC was selected as the solubilizer in our final protocol to keep membrane proteins in solution during reduction, alkylation, and trypsin digestion.

Comparison of membrane protein solubilizers on ultraperformance LC-MS/MS quantification of membrane transporters. The fold increase of the measured protein concentrations in the presence of a membrane protein solubilizer (Na-DOC, PPS, RapiGest SF, or PMAX) relative to those in the absence of any solubilizer [without (WO)] is plotted against the different solubilizers examined. Bars and error bars represent the mean fold increase and S.D. of triplicate determinations. Statistical significance is based on one-way ANOVA with Dunnett post-test to compare each solubilizer to the control (WO). *P < 0.05; **P < 0.01; ***P < 0.001.
Dynamic Range for Membrane Protein Extraction of OATP1B1, OATP1B3, OATP2B1, and PMCA4.
To determine the optimal amount of liver tissue for membrane protein extraction, different amounts of liver tissue were extracted using the described protocol. The amounts of OATP1B1, OATP1B3, OATP2B1, and PMCA4 were determined in each membrane protein fraction and plotted against the amount of liver tissue used for extraction (Fig. 3). P-gp was not quantified in this experiment. A good linear relationship was observed for liver tissue weights ranging from 25 to 60 mg (R2 > 0.89). Accordingly, all membrane protein extractions in this study were performed using 40–60 mg of human liver tissue.
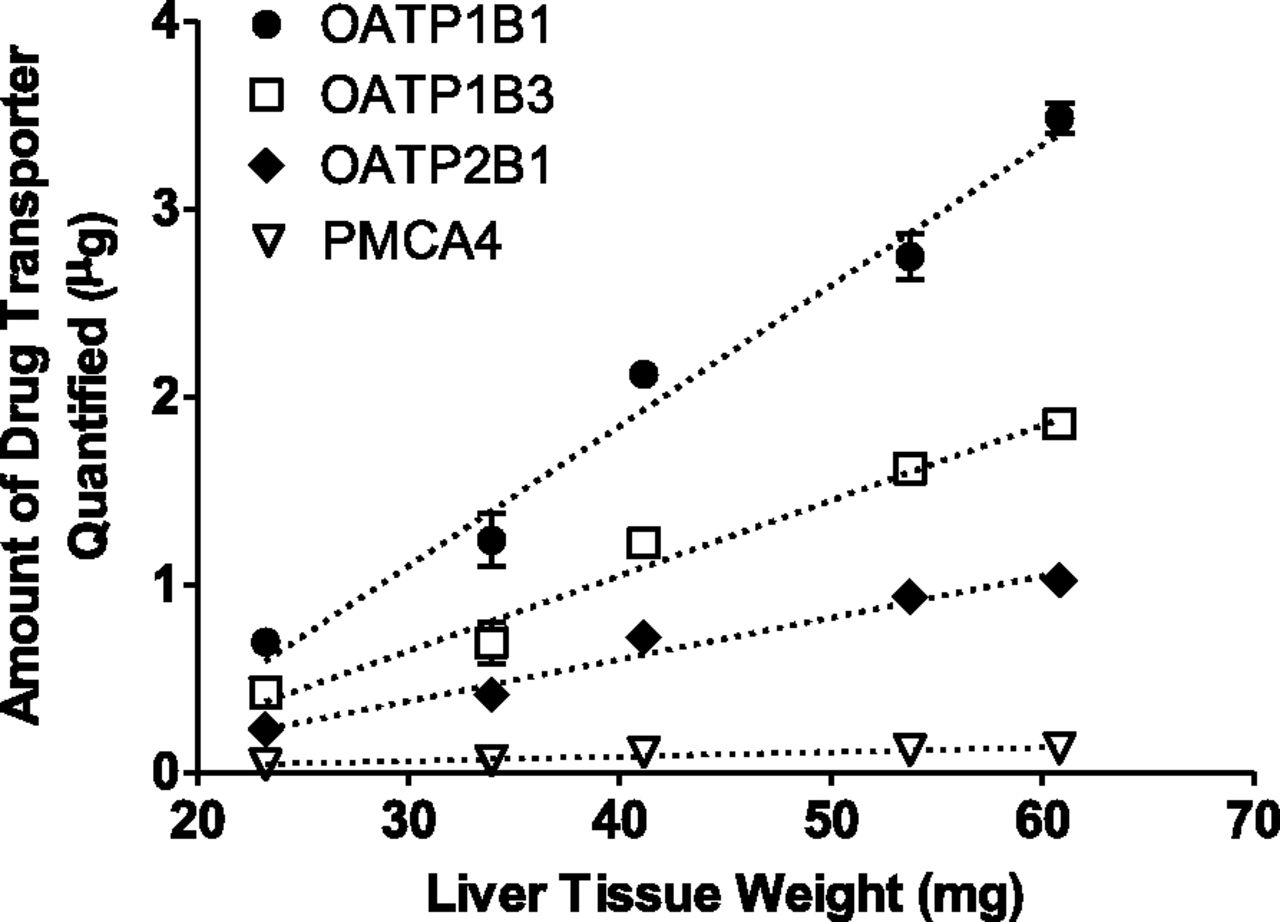
Dynamic range of membrane protein extraction from human liver tissue. The amounts of OATP1B1, OATP1B3, OATP2B1, and PMCA4 were determined in the membrane protein fraction and plotted against the amount of liver tissue used for extraction. Symbols and error bars represent the mean and S.E. of triplicate determinations. Dotted lines represent the least-squares linear regression.
Determination of Scaling Factors for Membrane Proteins in Human Liver.
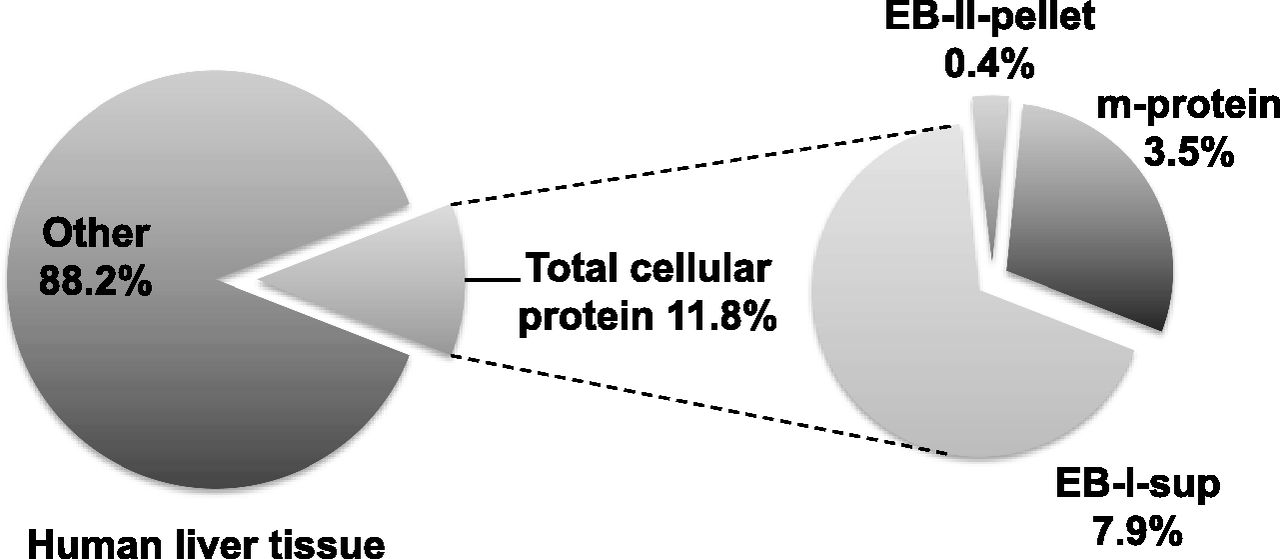
Total protein amount in the various fractions during membrane protein extraction was determined to provide scaling factors between total membrane protein and human liver tissue wet weight (Fig. 4). In total, 102 Caucasian livers, 18 Asian livers, and five African-American livers were processed to extract membrane proteins. There was no statistically significant difference in scaling factors among the three ethnicities (data not shown). The average scaling factors were 11.8% (w/w) between total cellular protein and liver tissue wet weight and 29.3% (w/w) between total membrane protein and total cellular protein. In other words, 100 mg of wet liver tissue contains approximately 11.8 mg of total cellular protein, of which total membrane protein accounts for about 3.5 mg [or 3.5% (w/w) of the liver tissue wet weight]. The membrane protein scaling factor determined here is expected to facilitate the incorporation of absolute hepatic abundance of membrane transporters into whole-body physiologically based pharmacokinetic models.

Scaling factors between the total membrane protein and human liver tissue wet weight. The amounts of total cellular protein, soluble protein with extraction buffer I (EB-I-sup), membrane protein (m-protein), and protein in the extraction pellet with extraction buffer II (EB-II-pellet) were determined using the BCA assay with bovine serum albumin for the calibration standards. Results represent the mean of 102 Caucasian livers, 18 Asian livers, and five African-American livers.
Quantification of OATP1B1, OATP1B3, OATP2B1, P-gp, and PMCA4 in Human Livers.
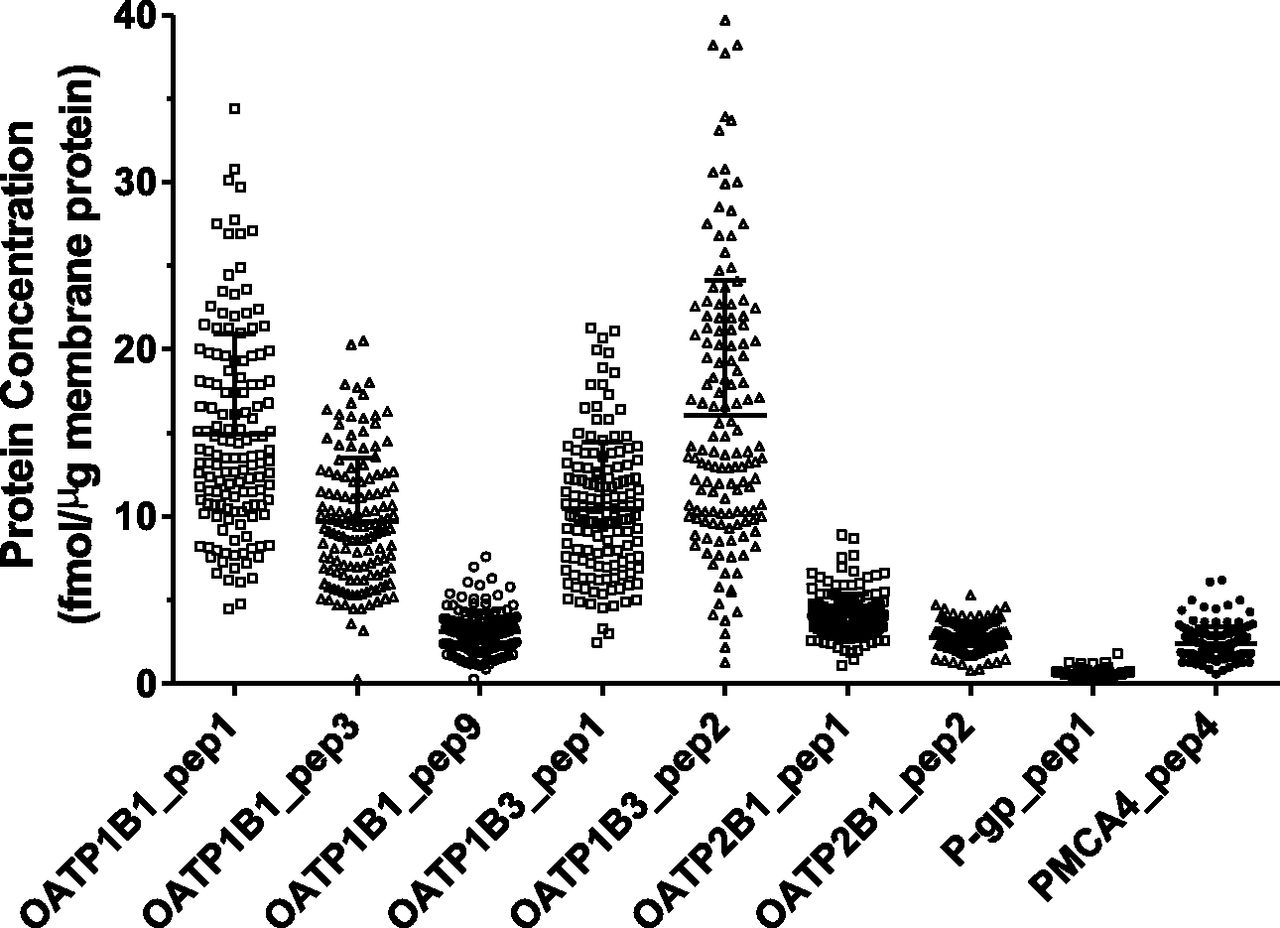
The concentrations of OATP1B1, OATP1B3, OATP2B1, P-gp, and PMCA4 in the total membrane protein fraction were determined for 141 human liver samples (Fig. 5). For each liver tissue sample, three separate membrane protein extractions were performed. The resulting membrane protein samples were separately trypsin digested and quantified for these membrane transporters using the developed ultraperformance LC-MS/MS method. Our method showed excellent reproducibility, with a CV of 2.0%–7.3% (averaged across 141 livers) for the proteins examined (Supplemental Fig. 1). For OATPs, two to three signature peptides were used for the quantification of each protein, while one signature peptide each was used for the quantification of P-gp and PMCA4. Different signature peptides of the same protein resulted in markedly different quantification results for that protein (P < 0.0001) (Fig. 5). For example, the average concentrations of OATP1B1 were 15 fmol/μg based on OATP1B1_pep1_L, 9.7 fmol/μg based on OATP1B1_pep3_L, and 3.1 fmol/μg based on OATP1B1_pep9_L (Fig. 5). In this study, quantification results based on OATP1B1_pep1_L, OATP1B3_pep2_L, and OATP2B1_pep1_L were considered more accurate because they reflected the greatest concentration of the corresponding protein. The reason for such a selection is further explained subsequently in the Discussion. As such, OATP1B1 exhibited a 7.6-fold interindividual variability, whereas OATP1B3 and OATP2B1 exhibited 31- and 8.1-fold interindividual variability, respectively. In addition, P-gp exhibited 6-fold interindividual variability.

Absolute expression levels of OATP1B1, OATP1B3, OATP2B1, P-gp, and PMCA4 in individual human livers (n = 141). Protein concentration is expressed as femtomoles of protein per microgram of total membrane protein. Signature peptides used for quantification are provided under each scatterplot. Symbols in the scatterplots represent the mean of triplicate determinations of an individual liver sample. Lines and error bars represent the mean and S.D. of all human livers analyzed.
Ethnic Differences in OATP1B1, OATP1B3, OATP2B1, P-gp, and PMCA4 Abundance in Human Livers.
Hepatic protein expression of OATP1B1, OATP1B3, OATP2B1, P-gp, and PMCA4 was compared based on donor ethnicity (Fig. 6). Quantification was based on OATP1B1_pep1_L, OATP1B3_pep2_L, OATP2B1_pep1_L, and P-gp_pep1_L, as mentioned previously. The mean and 95% confidence intervals of each protein concentration are summarized in Table 4. Scatterplots of individual liver samples for each ethnicity are shown in Supplemental Fig. 2. Because the study included only a small number of African-American subjects (n = 5), further ANOVA model analysis focused on comparing Caucasian (n = 102) to Asian subjects (n = 18). We found that OATP1B1 (adjusted P = 1.6 × 10⁻⁵), OATP1B3 (adjusted P = 1.8 × 10⁻¹¹), and P-gp (adjusted P = 8.3 × 10⁻⁵) were significantly different between the two ethnicities, while OATP2B1 and PMCA4 did not show significant differences (adjusted P = 0.07 and 0.34, respectively). We further assessed the statistical significance of the observed racial difference when potential confounding factors were considered (i.e., age, gender, and two OATP1B1 SNPs: rs2306283 and rs4149056). The result was unchanged by the inclusion of these confounding variables. In addition, ethnic differences in hepatic OATP1B1, OATP1B3, and OATP2B1 protein expression were also evaluated using alternative signature peptides (OATP1B1_pep3_L and OATP1B1_pep9_L for OATP1B1, OATP1B3_pep1_L for OATP1B3, and OATP2B1_pep2_L for OATP2B1) (Supplemental Fig. 3). Even though alternative signature peptides may have underestimated protein expression (see the explanation in the Discussion), OATP1B3 (but not OATP1B1 or OATP2B1) protein expression remained significantly different among different ethnicities.

Hepatic protein expression of OATP1B1, OATP1B3, OATP2B1, P-gp, and PMCA4 based on donor ethnicity. Quantification was based on OATP1B1_pep1_L, OATP1B3_pep2_L, OATP2B1_pep1_L, P-gp_pep1_L, and PMCA4_pep4_L. C, Caucasian (n = 102); A, Asian (n = 18); AA, African-American (n = 5); U, unidentified (n = 16). Boxes: 25th–75th percentile; whiskers: 1.5 times the interquartile distance or to the highest or lowest point, whichever is shorter; horizontal lines: median; +: mean; filled circles: outlier samples. The same letters indicate a statistically significant difference in the pair (a, P < 0.01; b, P < 0.001; c and d, P < 0.0001).
Quantification results for human OATP1B1, OATP1B3, OATP2B1, P-gp, and PMCA4 in human livers
Signature peptides used for quantification of OATP1B1, OATP1B3, OATP2B1, P-gp, and PMCA4 were OATP1B1_pep1_L, OATP1B3_pep2_L, OATP2B1_pep1_L, P-gp_pep1_L, and PMCA4_pep4_L, respectively. The values represent femtomoles of protein per microgram of total membrane protein (fmol/μg).
Effects of Genetic Polymorphisms on OATP1B1 Abundance.
All human livers (n = 141) were genotyped for two OATP1B1 SNPs [c.388A>G (rs2306283) and c.521T>C (rs4149056)]; a subset of livers (n = 128) were genotyped for two additional OATP1B1 SNPs [c.463C>A (rs11045819) and -11187G>A (rs4149015)] (Supplemental Table 1). The effects of genetic polymorphisms on OATP1B1 hepatic abundance were examined by comparing the protein concentrations of different allelic variants (Fig. 7). OATP1B1 hepatic protein expression was genotype dependent. For example, the mean OATP1B1 protein abundance in livers homozygous for the c.388A>G variant allele was approximately 1.5-fold higher than that in livers homozygous for the wild-type allele and 1.3-fold higher than that in heterozygous livers (Fig. 7A). The mean OATP1B1 protein abundance in livers homozygous for the c.463C>A wild-type allele was 1.4-fold lower than that in heterozygous livers (Fig. 7B). In contrast, genotype dependence was not observed for the c.521T>C or -11187G>A SNPs (Fig. 7, C and D). Comparisons to livers homozygous for the c.463C>A, c.521T>C, or -11178G>A variants were not performed because only one liver (or none) demonstrated each homozygosity. In addition, the effects of genetic polymorphisms on OATP1B1 hepatic abundance were evaluated using alternative signature peptides for OATP1B1 (OATP1B1_pep3_L and OATP1B1_pep9_L) (Supplemental Figs. 4 and 5). Despite marked differences in absolute protein quantification (see the explanation in the Discussion), similar effects of genetic polymorphisms on OATP1B1 hepatic abundance were observed regardless of the signature peptides used.

OATP1B1 hepatic protein expression based on allelic variations at four polymorphic sites. The number of liver samples of each allelic variation is shown in parentheses. All 141 livers were genotyped for c.388A>G and c.521T>C, but only 128 livers were genotyped for c.463C>A and -11187G>A. Boxes: 25th–75th percentile; whiskers: 1.5 times the interquartile distance or to the highest or lowest point, whichever is shorter; horizontal lines: median; +: mean; filled circles: outlier samples. The same letters indicate a statistically significant difference in the pair (a, P < 0.01; b, P < 0.001; c, P < 0.0001).
Multivariate Analysis of Genetic and Clinical Factors that Affect Transporter Abundance in Caucasian Livers.
Multivariate linear regression models were used to assess the relationship between transporters and candidate factors. Because of data availability and potential ethnic inhomogeneity that might cause spurious findings, only Caucasian subjects were included. When only demographic factors (age and gender) were considered, P-gp could be predicted by gender (P-gp = 0.22 × gender − 0.70; adjusted R2 = 0.1; P = 0.0009). OATP1B3 could be predicted by age (OATP1B3 = −0.01 × age + 4.10; adjusted R2 = 0.04; P = 0.028). When the four OATP1B1 SNPs were also taken into consideration, OATP1B1 could be predicted by the c.388A>G (rs2306283) variant (OATP1B1 = 0.20 × rs2306283 + 2.41; adjusted R2 = 0.06; P = 0.018). Therefore, demographic and genetic factors can be used to predict variation in the observed abundance of the transporters; however, inclusion of such factors could explain only a small amount (4%–10%) of the total variation in Caucasians.
Discussion
For the first time, hepatic protein expression levels of OATP1B1, OATP1B3, OATP2B1, and P-gp have been experimentally quantified and compared across three ethnic groups. The elevated hepatic expression levels of OATP1B1 and OATP1B3 in Asians relative to Caucasians (Fig. 6) were unexpected and surprising. Because higher expression levels of hepatic OATPs would implicate a higher extent of liver uptake and clearance of OATP substrates (Kumar et al., 2015), this would result in lower systemic exposure of statins in Asians, which is contrary to clinical observations. Recently, Tomita et al. (2013) proposed that the ethnic variability in plasma exposures of statins, such as rosuvastatin, was independent of the SLCO1B1 genotype (for the already discovered important SNPs) and instead, an intrinsic ethnic variability in OATP1B1-mediated hepatic uptake clearance has to be considered. However, our findings appear to support that ethnic differences in disposition pathways other than OATP1B1 could have played a more significant role in the observed ethnicity-dependent systemic exposure of statins. Elsby et al. (2012) have suggested a role for biliary/intestinal BCRP (or ABCG2), which is supported by the following observations. First, the BCRP polymorphism c.421C>A affected the pharmacokinetics of rosuvastatin and atorvastatin, likely due to increased intestinal absorption of statins in subjects with c.421AA (Keskitalo et al., 2009). Second, this same SNP is more prevalent in Asians (allele frequency 35% to >45%) than Caucasians (allele frequency ∼5%–10%) (Elsby et al., 2012), and the c.421A variant has reduced efflux transport activity (Morisaki et al., 2005). Hence, one can postulate that the higher frequency of the BCRP c.421C>A polymorphism in the Asian population contributed to the increased systemic exposure of statins in Asians compared with Caucasians, a result of the reduced BCRP-mediated enteric luminal efflux and/or biliary efflux of statins. Another finding to consider is that pitavastatin, whose disposition was influenced by OATP1B1 but not by BCRP (Ieiri et al., 2007; Elsby et al., 2012), demonstrated pharmacokinetic bioequivalence between Caucasian and Japanese subjects after adjusting for age and body weight (Warrington et al., 2011). The pharmacokinetic bioequivalence of pitavastatin between Caucasian and Japanese subjects indicates that OATP1B1 alone may not fully explain the ethnic differences in the plasma exposure of other statins (e.g., rosuvastatin and pravastatin). Other critical disposition pathways of statins (e.g., enteric and/or biliary BCRP-mediated efflux) should be further examined to fully understand the causes of ethnic differences in statin pharmacokinetics.
Hepatic protein expression of OATP1B1 was found to be significantly associated with the c.388A>G (rs2306283) variant (adjusted R2 = 0.06; P = 0.018) in Caucasian livers, but not with the three other OATP1B1 genetic variants examined, including the variant c.521T>C (rs4149056) associated with statin-induced myopathy (Link et al., 2008). This finding is consistent with the result reported by Nies et al. (2013). The livers homozygous for the c.388A>G variant showed the highest expression of OATP1B1, approximately 1.5- or 1.3-fold greater than livers homozygous for the wild-type allele or heterozygous livers, respectively (Fig. 7A). One may hypothesize that the higher hepatic OATP1B1 expression of the c.388A>G variant could result in the increased clearance (or decreased area under the time-concentration curve) of OATP1B1 substrates. This is supported by previous studies showing that the c.388A>G variant was associated with a significant decrease in the area under the time-concentration curve of pravastatin (Mwinyi et al., 2004; Maeda et al., 2006) and repaglinide (Kalliokoski et al., 2008). The lack of association between OATP1B1 hepatic protein expression and the c.521T>C variant in our study was consistent with previous report by Prasad et al. (2014). Because several pharmacogenetic studies have found an association between statin exposures and the c.521T>C variant, where statin exposure was generally higher in the c.521T>C variant carriers (Nishizato et al., 2003; Mwinyi et al., 2004; Lee et al., 2005; Birmingham et al., 2015), our protein quantification result appears to support differential substrate affinity rather than membrane protein expression as the mechanism underlying the observed variation in statin exposure concerning the OATP1B1 c.521T>C variant. However, our study was also limited by the small number of CC carriers (n = 1) in our liver panel, precluding a conclusive analysis.
Another finding of our study is the demonstration of the importance of the membrane protein solubilizer used during sample preparation and digestion for targeted quantitative proteomic analysis of membrane drug transporters. Membrane proteins are hydrophobic in nature and require solubilizers to prevent aggregation in an aqueous solution. Na-DOC outperforms the other three acid-labile surfactants (PPS, RapiGest SF, and PMAX) in terms of enhancing the MS/MS signals of the signature peptides formed during trypsin digestion of membrane proteins extracted from human liver tissue (Fig. 2). Our finding is in line with previous reports (Ji et al., 2012; Balogh et al., 2013) comparing MS-compatible surfactants and DOC to aqueous AmBC buffer alone. In nearly all cases, absence of a solubilizer resulted in substantially lower MS/MS signals of the signature peptides, which would result in significant underestimation of protein expression levels. As such, we included Na-DOC as the membrane protein solubilizer in our final assay protocol. This also is believed to explain the difference in the quantification of OATP1B1, OATP1B3, and OATP2B1 between our study and previous studies (Ohtsuki et al., 2012; Prasad et al., 2014), where markedly lower hepatic OATP protein expressions were reported (Table 1). In contrast, our quantification results are more in line with the results reported by studies that included solubilizers (Table 1) (Kimoto et al., 2012; Balogh et al., 2013).
A premise used in targeted quantitative proteomics for absolute quantification of proteins is the near stoichiometric digestion of proteins to produce signature peptides. To validate this premise, several assay optimization steps are required. First, membrane protein extraction needs to be optimized to achieve optimal extraction efficiency. This was established by determining the linear dynamic range for liver tissue weight (Fig. 3). Second, membrane proteins need to be solubilized and denatured to give trypsin unhindered access to proteolytic sites in the protein. As discussed previously, Na-DOC was added to solubilize membrane proteins after extraction. In addition, dithiothreitol reduction of disulfide bonds and iodoacetamide alkylation of cysteine prevent protein refolding back to the native state. Third, the protein:trypsin ratio and digestion time need to be optimized to allow efficient and complete digestion, while avoiding peptide degradation due to prolonged incubation. As such, we used a 20:1 protein:trypsin ratio and 18-hour incubation at 37°C based on previously reported optimal conditions (Ji et al., 2012; Balogh et al., 2013). Finally, signature peptides need to be carefully selected based on the criteria described under Materials and Methods or elsewhere (Kamiie et al., 2008; Li et al., 2008; Wang et al., 2008). For membrane proteins such as drug transporters, signature peptides that are located on the (putative) extracellular or intracellular (nontransmembrane) domains are preferred. All signature peptides in Table 2 are located on the nontransmembrane domains of the corresponding protein.
Despite these optimizations, quantification of drug transporters using a targeted quantitative proteomic approach was clearly signature peptide dependent, displaying a large discrepancy between the signature peptides used (Fig. 5; Supplemental Fig. 2). Three factors can potentially cause such differences: (1) differential digestion efficiency of signature peptides; (2) unexpected PTMs of signature peptides; and (3) inaccurate quantification of synthetic signature peptides. Similar quantification discrepancies also were observed for targeted quantitative proteomic quantification of CYPs (Wang et al., 2008) and drug transporters (Balogh et al., 2013; Prasad et al., 2014) when multiple synthetic signature peptides were used as calibration standards for the same protein. To demonstrate if a reduced trypsin digestion efficiency could result in underestimation of protein concentration, OATP1B1_pep9_L was included as a signature peptide for OATP1B1 (Table 2), even though it contains an adjacent proteolysis site at the N-terminus [SSIIHIER(R)]. Such adjacent proteolysis sites can cause missed cleavage by trypsin, resulting in incomplete digestion and underestimation of protein concentration. Indeed, OATP1B1 quantification using OATP1B1_pep9_L was the lowest among the three signature peptides examined (Fig. 5). In addition, OATP1B1_pep3_L (Table 2) was predicted to contain an N-linked glycosylation site due to the presence of the consensus sequence (Asn-Xaa-Ser/Thr) for N-glycosylation and its extracellular localization (http://www.uniprot.org/uniprot/Q9Y6L6; accessed on April 21, 2015). The predicted PTM, if true, could have resulted in an underestimation of protein concentration, depending on the glycosylation site occupancy. This may be further investigated by proteomic analysis of endoglycosidase-treated proteins. In contrast, the OATP1B1_pep1_L signature peptide was free of any known or predicted PTMs, did not contain an adjacent proteolysis site at either the N- or C-terminal side, and belonged to a cytoplasmic (nontransmembrane) topological domain (http://www.uniprot.org/uniprot/Q9Y6L6; accessed on April 21, 2015). These properties made it more likely for the OATP1B1_pep1_L signature peptide to be in stoichiometry with the protein after trypsin digestion. The previous observations have led us to propose that differential digestion efficiency and/or unexpected PTMs of signature peptides are the underlying causes of signature peptide-dependent quantification. As such, the higher protein quantification results should more accurately represent the true protein abundance and were hence selected, analyzed, and reported in our study (Figs. 6 and 7; Table 4), as well as in other studies (Balogh et al., 2013; Prasad et al., 2014). However, the true protein concentration may not be ascertained until all potential signature peptides of a protein have been experimentally evaluated and compared. For OATP1B1, five potential signature peptides have been identified based on the selection criteria described in the Materials and Methods, which include OATP1B1_pep1_L and OATP1B1_pep3_L; future studies should evaluate the other three peptides for absolute quantification of OATP1B1. Perhaps more importantly, predictive algorithms, optimized digestion protocols, and/or alternative absolute protein quantification strategies (e.g., recombinant proteins as standards, QconCAT technology, and label-free quantitative proteomics) should be considered and investigated in future studies.
Compared with using synthetic signature peptides as calibration standards, when known concentrations of recombinant P450s were digested and the resulting signature peptides were used as calibration standards, little difference in protein quantification was observed between different signature peptides (Wang et al., 2008; Michaels and Wang, 2014). Unlike CYPs, which can be precisely and conveniently quantified using the carbon monoxide difference spectrum method (Omura and Sato, 1964), precise quantification of recombinant drug transporter proteins is difficult (although not impossible), which precludes the use of recombinant drug transporter proteins as calibration standards. An alternative method of generating signature peptides is based on the QconCAT technology to express an artificial protein that comprises the concatenated signature peptides for a specific set of proteins (Beynon et al., 2005; Russell et al., 2013). The LCMSE label-free technology does not rely on signature peptides for absolute protein quantification, but rather is based on an unexpected relationship between MS signals and protein concentration (Silva et al., 2006). These technologies may ameliorate differential digestion efficiency of different signature peptides and avoid inaccurate quantification of synthetic signature peptides, potentially resulting in more consistent absolute protein quantification.
In conclusion, the elevated hepatic expression levels of OATP1B1 and OATP1B3 in Asians relative to Caucasians are unexpected, suggesting that hepatic OATP expression alone does not explain the increased systemic statin levels in Asians compared with Caucasians. Our findings implicate the key roles of disposition pathways unrelated to OATPs in the ethnic-dependent pharmacokinetics of statins. This finding is significant in terms of improving current physiologically based pharmacokinetic modeling in order to predict statin pharmacokinetic profiles, as well as to extrapolate pharmacokinetic data of OATP substrates across ethnic groups.
Acknowledgments
We thank Steven A. Wrighton and Barbara J. Ring for the long-term effort involved in establishing the human liver tissue bank used in this study and Stephen D. Hall and Kathleen M. Hillgren for helpful discussions on the study design and data interpretation.
Authorship Contributions
Participated in research design: Wang, Guo.
Conducted experiments: Peng, Bacon.
Performed data analysis: Peng, Zheng.
Wrote or contributed to the writing of the manuscript: Peng, Guo, Zheng, Wang.
Footnotes
- Received January 15, 2015.
- Accepted April 29, 2015.
This work was supported by a research contract from Eli Lilly & Company.
↵
 This article has supplemental material available at dmd.aspetjournals.org.

Abbreviations
- AmBC
- ammonium bicarbonate
- ANOVA
- analysis of variance
- AQUA
- absolute quantfication
- DOC
- deoxycholate
- LC
- liquid chromatography
- LC-MS/MS
- liquid chromatography–tandem mass spectrometry
- MRM
- multiple reaction monitoring
- MS
- mass spectrometry
- Na
- sodium
- PMAX
- ProteaseMAX
- PPS
- sodium 3-(4-(1,1-bis(hexyloxy)ethyl)pyridinium-1-yl)propane-1-sulfonate
- PTM
- post-translational modification
- SNP
- single nucleotide polymorphism
- Copyright © 2015 by The American Society for Pharmacology and Experimental Therapeutics


