


Abstract
Diclofenac, a 2-arylacetic acid, nonsteroidal anti-inflammatory drug, has been reported to cause adverse hepatic effects in certain individuals. To discriminate among possible mechanisms of hepatotoxicity, we examined the effects of diclofenac on human and rat hepatocytes and hepatic cell lines (HepG2, FaO), investigated the major biochemical events in the course of diclofenac cytotoxicity (calcium homeostasis, lipid peroxidation, and mitochondrial dysfunction), and investigated whether cytotoxicity could be related to drug metabolism by cytochrome P-450. Acute diclofenac-induced toxicity in hepatocytes was preluded by a decrease in ATP levels, whereas no significant oxidative stress (decrease in glutathione and lipid peroxidation) or increase in intracellular calcium concentration could be observed at early incubation stages. Diclofenac was more cytotoxic to drug metabolizing cells (rat and human primary cultured hepatocytes) than to nonmetabolizing cell lines (HepG2, FaO). Despite the fact that diclofenac itself was effective in impairing ATP synthesis by mitochondria, we found evidence that toxicity was also related to drug metabolism and was reduced by the addition of cytochrome P-450 inhibitors (proadifen and ketoconazole) to culture medium. The in vitro cytotoxicity correlated well with the formation by hepatocytes of 5-hydroxydiclofenac and, in particular,N,5-dihydroxydiclofenac, a minor metabolite first characterized in this article. Hepatic microsomes showed the ability to both oxidize 5-hydroxydiclofenac toN,5-dihydroxydiclofenac and back reduce the latter to 5-hydroxydiclofenac with the consumption of NADPH. The experimental results suggest that the toxic effect of diclofenac on hepatocytes may be caused by drug-induced mitochondrial impairment, together with a futile consumption of NADPH.
Diclofenac is a frequently prescribed nonsteroidal anti-inflammatory drug. Although diclofenac-associated hepatitis was thought to be rare, there are clinical reports of severe hepatic reactions associated with their use (Helfgott et al., 1990; Sallie, 1990; Ouellette et al., 1991;Purcell et al., 1991). In addition to this, there are indications that borderline increases in serum transaminases occur in approximately 15% of patients taking the drug regularly, which suggests that diclofenac-associated hepatotoxicity might be more common than previously recognized (Ciccolunghi et al., 1978; Iveson et al., 1990). Although in some case reports, the adverse hepatic effects of diclofenac showed features compatible with a drug hypersensitivity reaction (Breen et al., 1986; Schapira et al., 1986; Salama et al., 1991; Romano et al., 1994), the clinical findings in other patients appear to be more consistent with a direct toxic effect of the drug or a drug metabolite (Helfgott et al., 1990; Iveson et al., 1990; Sallie, 1990; Scully et al., 1993).
The mechanism by which diclofenac causes liver alterations in certain individuals is not yet fully understood, and both the formation of a toxic metabolite and covalent binding of the drug to hepatic proteins have been invoked to explain its toxicity. Diclofenac was found to generate protein adducts in the livers of treated mice as well as in rat hepatocytes via protein acylation by the drug glucuronide (Pumford et al., 1993). In vitro experiments with cultured rat hepatocytes have shown, however, that the covalent binding of diclofenac is neither the only nor the major cause of acute cytotoxicity (Kretz-Rommel and Boelsterli, 1993). Moreover, previous work has suggested that diclofenac is cytotoxic to rat hepatocytes after cytochrome P-450 (CYP)-mediated metabolism (Schmitz et al., 1992; Jurima-Romet et al., 1994). Recently, the formation of reactive metabolite(s) by drug oxidation, which could be related to drug toxicity, has been reported (Miyamoto et al., 1997).
Diclofenac undergoes hepatic metabolism both in rat and human hepatocytes, and the main biotransformation reactions (aromatic hydroxylations and conjugations at various sites of the molecule) are common to several animal species (Riess et al., 1978; Stierling et al., 1979). In human liver microsomes, the major oxidative metabolic pathway is the formation of 4′-hydroxydiclofenac (4′-OHdic) by CYP2C9 (Smith and Jones, 1992; Leemann et al., 1993). Formation of 5-hydroxydiclofenac (5-OHdic), 3′-hydroxydiclofenac, 4′,5-dihydroxydiclofenac, and 3′-hydroxy-4′-methoxydiclofenac has also been reported in humans, but to a much lesser extent (Riess et al., 1978; Faigle et al., 1988). In the rat, 4′-OHdic together with 5-OHdic are the major urine metabolites (Stierling et al., 1979).
We have investigated the acute effects of diclofenac on the viability and functionality of cultured hepatocytes to discriminate between possible mechanisms of toxicity and found that a decrease in ATP levels preluded cell death. Despite the fact that diclofenac itself was effective in impairing ATP synthesis by mitochondria, we found evidence that toxicity was also related to drug metabolism, in particular with the formation of 5-OHdic andN,5-dihydroxydiclofenac ( N,5-(OH)2dic). Both metabolites can easily interchange by oxidation and reduction and both cause a continuous consumption of NADPH. Thus, in addition to the effects of diclofenac and its major metabolites on mitochondrial function, the existence of a futile red-ox cycle could also contribute to the mechanism of toxicity.
Materials and Methods
Materials.
Diclofenac sodium salt, flurbiprofen, proadifen, α-naphthoflavone, phenytoin (5,5-diphenyl-hydantoin), maleic acid diethyl ester (DEM),l-buthionine-[S,R]-sulfoximine (BSO), buthylated hydroxytoluene (BHT), deferoxamine mesylate, nifedipine, (±)-verapamil, rhodamine 123, ando-phthaldialdehyde were obtained from Sigma Chemical Co. (St. Louis, MO). Malondialdehyde (MDA) bis(dimethylacetal) was obtained from Merck (Darmstadt, Germany). Fluo-3-AM and pluronic F-127 were obtained from Molecular Probes, Inc. (Eugene, OR). β-Glucuronidase/arylsulfatase, collagenase, the Glucose GOD-Perid test, and the ATP bioluminescence CLS test were obtained from Boehringer Mannheim (Mannheim, Germany). Calf serum was obtained from GIBCO (Paisley, UK), and culture media were obtained from Flow Labs. (Irvine, CA). Diclofenac metabolites (4′-OHdic, 5-OHdic, and4′,5-OHdic) were synthesized as described (Bort et al., 1996). All other reagents used in this study were of analytical grade.
Cell Cultures.
MDCK, FaO, and HepG2 cells were cultured in Dulbecco’s minimal essential medium supplemented with 10% of fetal calf serum and containing 50 μg of streptomycin/ml and 50 mU of penicillin/ml. Cells were routinely seeded in 3.5-cm plates at a density of 14 × 103 cells in 0.1 ml medium per well and used 24 h later (75% monolayer confluence).
Rat hepatocytes were obtained from 200- to 300-g Sprague-Dawley male rats by perfusion of the liver with collagenase as described in detail elsewhere (Gómez-Lechón et al., 1984). Human hepatocytes were obtained from small liver biopsies from patients undergoing cholecystectomy, after informed consent. The patients had not received any medication for at least a week before surgery. Cell suspensions were obtained as described in detail elsewhere (Gómez-Lechón et al., 1990). Hepatocytes were seeded on fibronectin-coated culture plates (3.5 g/cm2) at a density of 80 × 103cells/cm2. Unattached cells were removed by changing the medium 1 h after seeding.
Evaluation of Toxicity of Diclofenac to Hepatocytes.
Increasing concentrations of the drug in phosphate-buffered saline (PBS) were added to cultures after medium renewal. After a 24-h incubation, microtiter plates were washed twice with 50 μl of PBS/well, and cytotoxicity was assessed either by measuring the loss of intracellular lactate dehydrogenase (Ponsoda et al., 1991) or by the 3-[4,5-dimethylthiazol-2-yl]-3,5-diphenylformazan (MTT) test (Carmichael et al., 1987).
The effects of diclofenac on gluconeogenesis were investigated in glycogen-depleted hepatocytes incubated with the drug and with lactate as the only gluconeogenic precursor, as described in detail previously (Castell et al., 1985). The gluconeogenic rate was determined from the rate of glucose production by hepatocytes.
The synthesis and secretion of albumin by hepatocytes was monitored by a competitive enzyme-linked immunosorbent assay in aliquots of culture medium taken at regular time intervals (Castell et al., 1985).
Glutathione (GSH) was measured by a fluorimetric reaction witho-phthaldialdehyde adapted to microscale measurements (Jover et al., 1992). Briefly, cells were detached and homogenized by ultrasound. The resulting homogenates were deproteinized and centrifuged in the same 96-well plate. Aliquots of the supernatant were transferred to microtiter plates and allowed to react witho-phthaldialdehyde. Fluorescence was measured in a multiwell plate fluorimeter (excitation filter: 355 ± 35 nm; emission filter: 460 ± 25 nm). Known amounts of GSH (0–5000 pmol/well) were used as reference standards.
Lipid peroxidation was determined by measuring the generation of MDA in the culture media by the fluorimetric reaction with thiobarbituric acid (Castell et al., 1997). After incubation for 60 min in a boiling bath, the fluorochrome formed was extracted with n-butanol and the fluorescence of the organic phase was measured at 530 ± 25 nm excitation and 590 ± 35 nm emission. MDA bis(dimethylacetal) diluted in culture medium was used as standard. Results were referred to intracellular protein content.
To monitor intracellular calcium ([Ca++]i), cells previously incubated with diclofenac were loaded with 5 μM of Fluo-3-AM 0.075% (w/v) pluronic F-127 in culture medium for 30 min at 37°C. The cells were washed three times with HEPES-buffered Krebs-Henseleit solution (10 mM HEPES, pH = 7.4, 25°C) containing 1% bovine serum albumin, and immediately thereafter fluorescence was measured with a multiwell plate fluorimeter (Cytofluor 2350, Millipore; excitation, 485 ± 22 nm; emission, 530 ± 30 nm) (Jover et al., 1993). Fluorescence readings were calibrated to calculate [Ca++]i. First the hydrolysed, cytosolic Fluo-3 was released out of cells into medium containing 2 mM CaCl2 by treating cells with 30 μM digitonin for 4 min, and fluorescence (Fmax) was recorded. Next, 10 mM EGTA was added to quench Ca++, and fluorescence (Fmin) was again recorded. [Ca++]i was calculated for any previous fluorescence signal (F) using aKd of 400 nM for the Fluo-3-Ca complex (Minta et al., 1989), according to the following equation: [Ca++]i =Kd × ((F-Fmin)/(Fmax−F)).
ATP synthesis was determined in cultured hepatocytes incubated in HEPES-buffered saline medium with glucose as the only energetic substrate and 500 μM diclofenac. At regular time intervals, cells were washed with PBS and homogenized in 1 ml of 3% HClO4 at 0°C. Samples were centrifuged (5 min × 9000g) and the supernatant kept at 4°C until analysis. The ATP concentration of the diluted samples (1:4900) was measured using the luciferin/luciferase assay according to the manufacturer’s instructions. Bioluminescence was quantified in a Lumat LB luminescence photometer (Berthold GmbH, Wildbad, Germany).
Mitochondrial membrane potential was assayed in the same conditions as ATP, but rhodamine 123 (final concentration 1 μM) was also added. After incubations at different times, medium was removed and monolayers were processed to measure fluorescence in the mitochondrial compartment as described elsewhere (Nieminen et al., 1990). The fluorescence of samples was measured (excitation, 505 nm; emission, 523 nm) in a Hitachi F-2000 fluorescence spectrophotometer (Hatachi Scientific Instruments, Mountain View, CA) .
Isolation of Mitochondria from Rat Liver.
Sprague-Dawley rats were euthanized and their livers immediately removed, washed, and homogenized in 4 ml/g ice-cold homogenization buffer (0.25 M sucrose, 5 mM Tris, 1 mM EDTA, pH 7.4). Mitochondria were isolated by centrifugation in sucrose as described elsewhere (Cain and Skilleter, 1987) and finally resuspended in 0.7 ml of the assay solution (0.25 M sucrose, 10 mM Tris, 1 mM EDTA, 5 mM KH2PO4, 2 mM MgCl2, pH 7.4) per gram of liver.
ATP Measurement in Isolated Mitochondria.
A mitochondrial suspension (final concentration 2 mg/ml protein) containing 2.5 mM ADP and variable concentrations of diclofenac or its metabolites was preincubated at 30°C for 5 min. Then substrates were added (2.5 mM glutamate, 2.5 mM malate, final concentration) and after 5 min, 100 μl was taken and dropped on 900 μl of boiling buffer (100 mM Tris, 4 mM EDTA, pH 7.75). ATP was measured as described above.
Metabolism of Diclofenac.
Biotransformation of the drug was studied both in vitro and in vivo. For in vitro studies, diclofenac was added to hepatocyte cultures and incubated for 20 h. Aliquots of culture medium were enzymatically deconjugated (50 mU of β-glucuronidase/ml, 30 mU of arylsulfatase/ml; acetate buffer 0.1 M, pH 4.5) for 4 h at 37°C. The reaction was stopped by adding acetonitrile to the samples (1:1, v/v). The resulting precipitate was removed by centrifugation (10 min, 9000 rpm). The supernatant was diluted with 100 mM phosphate buffer (pH 7.4) to reach 25% (v/v) acetonitrile. Flurbiprofen (2 μl of a 4.5-mM solution in PBS) was added to samples as an internal standard.
For in vivo studies, diclofenac was administered i.p. to Sprague-Dawley rats (40 mg/kg) and urine was collected over cold (0°C) acetate buffer (0.1 M, pH 4.5) during the next 20 h. Metabolites were extracted from acidified urine with ethyl acetate either before or after deconjugation.
Metabolites were routinely analyzed by high-performance liquid chromatography (HPLC) in deconjugated and nondeconjugated samples (Leemann et al., 1993). Samples (20 μl) were injected into a 200 × 4.6-mm C-18 reverse-phase column (Spherisorb ODS 5 μm, Phase Separations Ltd., Queensferry, UK) furnished with a precolumn (ODS 5 μm; 50 × 4.6 mm). The mobile phase (75% triethanolamine 0.02% in 100 mM phosphate buffer pH 7.4, 25% acetonitrile) was delivered at 1 ml/min. The column effluent was monitored at 282 nm. Diclofenac eluted at 12.2 min and flurbiprofen at 7.4 min.
Identification of Diclofenac Metabolites.
Culture supernatants were collected, deconjugated, and extracted with ethyl acetate as described above. The organic extracts were dried under vacuum, resuspended in methanol, and analyzed by HPLC-mass spectrometry (MS) (Waters Alliance equipped with a therma beam detector; Waters Scientific, Milford, MA). Samples (25 μl) were injected into a 150 × 2.1-mm C-18 reversed-phase column (Simmetry; Waters). A new HPLC method was developed to adjust it to this specific detector. The mobile phase was changed to 63% 20 mM ammonium acetate buffer (pH 6.5)/37% methanol and it was delivered at 0.3 ml/min. The column effluent was also monitored at 282 nm using a photodiode detector (M996; Waters). Diclofenac eluted at 29.8 min. The UV, mass spectra, and 1H NMR (d6-acetone, Varian Gemini 300 MHz spectrometer, Palo Alto, CA) of the main metabolites were obtained and compared with chemically synthesized standards.
4′-OHdic and 5-OHdic were prepared as described in detail previously (Bort et al., 1996). The lactams of4′-OHdic and 5-OHdic were synthesized by reacting the corresponding hydroxyderivative of diclofenac with a 10% molar excess of dicyclohexyl carbodiimide in dry chloroform. Upon completion of the reaction (5 h at room temperature), the solution was brought to dryness, dissolved in ethyl acetate, filtered to remove the dicyclohexyl urea formed, and crystallized by the addition of petroleum ether. The UV-(4′-OHdic-lactam: λmax239 and 5-OHdic-lactam: λmax 250 nm), 1H NMR- (4′-OHdic-lactam: δ 3.7, s 2H, Ar-CH2 -CO-, δ 7.4–6.8, m, 6H, aromatic; 5-OHdic-lactam: δ 3.9, s 2H, Ar-CH2-CO-, δ 7.4–6.8, m, 6H, aromatic) and mass spectra (m/z 293, molecular peak for both derivatives) were consistent with the assigned chemical structure of the two cyclic diclofenac derivatives.
Microsome Incubations.
Rat microsomes were obtained by homogenization of liver samples in 0.25 M potassium phosphate buffer, pH 7.25, containing 1 mM EDTA and 0.15 M KCl, followed by differential ultracentrifugation (Boobis et al., 1980). The microsomal fraction was stored in the same buffer containing 30% v/v glycerol. Assays were performed in a buffer containing 75 mM Tris-hydrochloride buffer, pH 7.4, 3 mM magnesium chloride, and 500 μg of microsomal protein. Samples were preincubated for 5 min at 37°C, and the reaction was started by the addition of NADPH (final concentration 1.2 mM). The reaction was stopped by the addition of 1 ml of cold acetonitrile. Controls were incubated either without NADPH or without microsomes. Samples were analyzed by HPLC as described above.
Statistical Analysis.
Each experiment was done in at least three different cultures. Each determination was done in four plates (eight wells for cytotoxicity experiment) from each culture, and the results shown are the mean value ± S.E.M. To estimate IC10 and IC50 values (concentrations that produce a 10% and 50% inhibitory effect, respectively), the typical sigmoid dose-effect curves were linearized using the LOGIT transformation, and the IC values were interpolated mathematically. The statistical significance of the experimental data was analyzed by the Student’s t test.
Results
Cytotoxicity of Diclofenac on Hepatic and Nonhepatic Cells.
Diclofenac showed a characteristic concentration-dependent cytotoxicity when added to cultured human or rat hepatocytes, as assessed by the MTT test (Fig. 1). Similar results were obtained (data not shown) when the leakage of intracellular lactate dehydrogenase was determined as a parameter for cell viability. The estimated IC50 values for rat and human hepatocytes (concentration causing 50% cell death) were closely related: 392 ± 34 μM (n = 16) and 331 ± 7 μM (n = 6), respectively. To elucidate whether these effects were hepatocyte-specific, cytotoxicity was also evaluated in human and rat hepatomas, as well as in the nonhepatic cell line MDCK. Figure 1 shows that hepatoma cells were less sensitive to diclofenac than primary cultures of hepatocytes (HepG2 763 ± 61 μM,n = 4 and FaO 682 ± 64 μM,n = 3,), with concentration-toxicity curves shifting to higher concentrations of the drug (i.e., higher IC50 values) but more sensitive than the nonhepatocyte cell line MDCK (908 ± 56 μM, n = 2).

Cytotoxicity of diclofenac in different cellular systems. Human, rat hepatocytes, rat hepatocytes cultured in the presence of 10 μM proadifen, and cell lines (FaO, HepG2, and MDCK) were cultured in microwells and incubated with increasing concentrations of diclofenac. After 24 h, cell viability was determined by the MTT test. Values are the mean of quintuplicated wells ± S.D. of a representative culture.
The differences in diclofenac toxicity observed in primary cultured hepatocytes, hepatomas, and nonhepatic cells could reflect the different sensitivity of cell lines versus hepatocytes to the drug or to differences in the ability of these cells to metabolize diclofenac. In fact, HPLC analysis of culture medium after a 24-h incubation with a subtoxic concentration of the drug (100 μM) showed that rat and human hepatocytes metabolized diclofenac at similar rates (310 and 340 pmol·min−1·mg−1, respectively), whereas cell lines were unable to metabolize it to a measurable extent (data not shown). Incubation of rat hepatocytes with a noncytotoxic concentration (10 μM) of proadifen, a broad CYP inhibitor, significantly reduced the toxicity of the drug (IC50: 489 ± 32, p < .005; Fig. 1). Ketoconazole (25 μM), which inhibits the 2C and 3A subfamilies, also reduced diclofenac toxicity significantly (IC50: 514 ± 38, p < .005), whereas α-naphthoflavone-specific CYP1A inhibitor did not apparently modify cytotoxicity (IC50: 392 ± 81, N.S.). Moreover, we found evidence showing a good correlation between cytotoxicity (IC50) and the extent of diclofenac metabolization (r = 0.95, p< .001; Fig. 2).

Correlation between cytotoxicity and drug metabolization. Rat hepatocytes were incubated with different concentrations (100–750 μM) of diclofenac and the cytotoxicity was expressed as IC50. In parallel, the metabolism of diclofenac was investigated by HPLC analysis in cell culture media incubated with 250 μM diclofenac, and the results expressed as percentage of metabolized drug. Solid line, regression; dashed line, confidence interval.
Major Biochemical Events in Course of Diclofenac Toxicity.
Analysis of toxicologically relevant biochemical parameters in hepatocytes exposed to diclofenac (GSH levels, lipid peroxidation, changes in [Ca++]i, and ATP) revealed that upon incubation of cells with toxic concentrations of the drug, no significant accumulation of MDA was found in the medium after several hours. In control experiments, addition of 1 mM t-butyl hydroperoxide resulted in an immediate, dramatic increase in thiobarbituric-reactive substances (Fig.3A). In agreement with these findings, we did not observe a decrease in toxicity (increased IC50) when cells were incubated in the presence of the antioxidant BHT (50 μM) or 10 mM deferoxamine (data not shown.).

Evaluation of diclofenac toxicity to hepatocytes. Effects of diclofenac on lipid peroxidation, GSH content, [Ca++]i, mitochondrial membrane potential, and ATP content of cultured rat hepatocytes. Diclofenac was added to hepatocytes and aliquots of culture medium were taken at regular time intervals. After reaction with thiobarbituric acid, fluorescence was determined and expressed as nanomoles of MDA. As a positive control, 1 mM t-butyl hydroperoxide (t-BOOH) was added to cells. B, in parallel, GSH was measured in cells incubated with diclofenac or the GSH inhibitor BSO. [Ca++]i was fluorimetrically measured at regular time intervals (C) in cells incubated with the diclofenac ort-butyl hydroperoxide. D, diclofenac (400 μM) was added to cultured rat hepatocytes. Plates were washed and cells detached with 3% HClO4. ATP content was measured by means of luminescence production by luciferase. For evaluation of mitochondrial membrane potential, cells were incubated with rhodamine 123. Remaining fluorescence in medium was measured fluorimetrically as described in Materials and Methods. For a better interpretation of results, cell viability of the same experiment (LDH) is also depicted. Values represented as mean of five wells ± S.D. of a representative culture.
We also investigated the effects of diclofenac on intracellular GSH levels. An IC50 concentration of diclofenac did not cause significant changes in intracellular GSH during the 5 h following incubation (Fig. 3B). As expected, the presence of BSO caused a rapid GSH depletion in cells. Neither BSO nor DEM (500 μM) increased the toxicity of diclofenac (IC50 = 368 ± 12 and 367 ± 47 μM, respectively, versus control at 392 ± 34 μM).
The possibility that calcium could be involved in the early stages of toxicity by diclofenac was also investigated. The addition of an IC50 concentration of diclofenac did not result in an increase in intracellular Ca++ during the first 120 min of incubation (Fig. 3C). After much longer incubation times (>6 h), we observed a gradual increase in [Ca++]i (ca. 150–200% over controls; data not shown). Addition of 25 μM verapamil or 100 μM nifedipine to culture medium (concentrations effectively blocking calcium influx in cells, Jover et al., 1993) was moderately effective in decreasing diclofenac cytotoxicity (IC50 = 415 ± 92 and 507 ± 30 μM, respectively).
Diclofenac, however, caused an important, fast depletion of ATP in hepatocytes kept in glucose as the only energy source. ATP dropped to 10% of initial levels after 120 min of exposure to the drug. This rapid ATP depletion preceded cell death, which in these experiments began to be noticeable 120 min after addition of the drug (Fig. 3D). In agreement with this finding, increasing diclofenac in culture medium resulted in a concentration-dependent inhibition of gluconeogenesis and albumin synthesis, two specific hepatic functions that require substantial amounts of ATP. This inhibition was noticeable at subcytotoxic concentrations of diclofenac. The IC50 were 110 ± 12 and 108 ± 9 μM, respectively.
Metabolism of Diclofenac.
Analysis by HPLC of culture media of hepatocytes incubated with diclofenac allowed the identification of several metabolites. A peak with a retention time of 3.8 min was assigned to 4′-OHdic, while the peak with a retention time of 5.1 min was identified as 5-OHdic, by comparison of the UV-, mass-, and 1H-NMR spectra of chemically synthesized metabolites. Other minor peaks at 10.4 and 13.5 min were identified as lactams of 4′-OHdic and 5-OHdic.
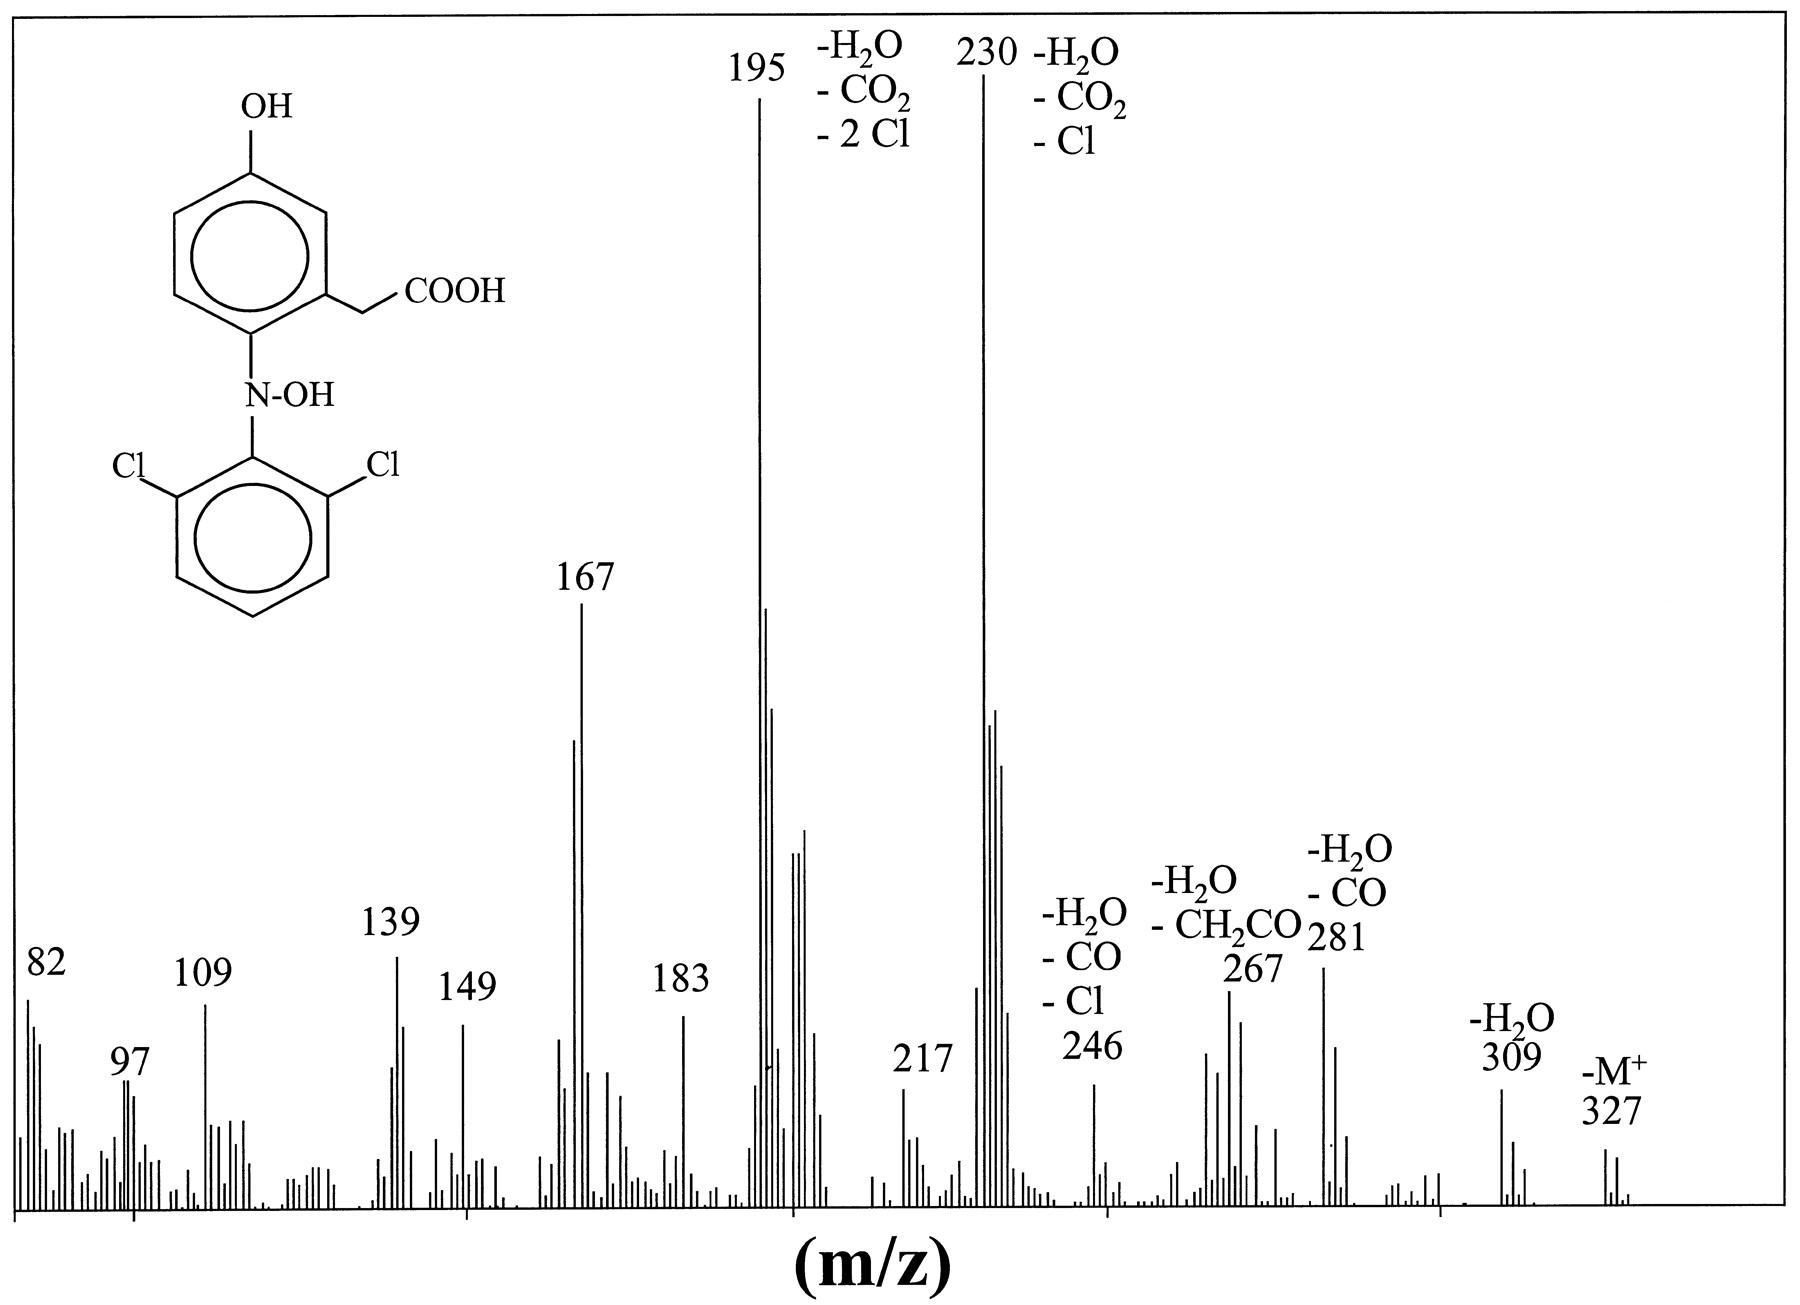
A minor peak (retention time 2.9 min) was present with variable intensity in the different culture supernatants assayed. This metabolite was found in culture media mainly in its conjugated form (>95%). The compound was analyzed by HPLC-MS and1H NMR, and the most relevant spectral features are summarized in Table 2 and Fig. 4. The molecular ion peak (M+) was at m/z327, and the presence of isotopic peaks at m/z 329 and 331 confirmed the presence of two Cl. When compared with the mass spectra of diclofenac, the M+ peak of this metabolite suggested the existence of two hydroxy substituents. The1H NMR spectra of the purified metabolite (Table1) showed the same number of aromatic H (7.4–6.4 m, 6H) and ethylenic H (δ 3.68 s, 2H, Ar-CH2-COOH) as 5-OHdic, which excludes an aromatic hydroxylation. Interestingly, the displacement to a high field of the signal of H(3), as compared with that recorded for 5-OHdic, points to the proximal N as the site of oxidation. The compound showed the features of an acid and a UV maximum displacement to 268 nm (versus 282 nm, 5-OHdic). Based on these data, we assigned the N,5-(OH)2dic structure to this metabolite (Fig. 4).
In vitro and in vivo metabolism of diclofenac

Structure and mass spectra of N,5-(OH)2dic.
Relevant proton chemical shifts of aromatic hydrogens ofN,5-(OH)2dic1-a compared to 5-OHdic
To exclude an artifactual formation of N,5-(OH)2dic in the course of in vitro experiments, its occurrence was investigated in rat urine 20 h after i.p. administration of diclofenac. In control experiments, 5-OHdic was added to urine of untreated rats and processed as described in Materials and Methods. Approximately 28% of the in vivo administered diclofenac was found in urine as hydroxylated metabolites. In addition to 4′-OHdicand 5-OHdic, both in free and conjugated forms, the presence of conjugated N,5-(OH)2dicunequivocally demonstrated the cellular formation of this metabolite (Table 3). N ,5-(OH)2dicis found only as a conjugate, both in culture media and in vivo, and its concentration is greater inside cells than in culture medium (3.2 versus 0.2 μM), which suggests that conjugation may be crucial for this metabolite to escape from the cell. In control experiments, no spontaneous formation of N,5-(OH)2dic was observed.
In the experiment shown in Fig. 5, the cytotoxicity of diclofenac (IC50) was determined under an array of different incubation conditions (100–750 μM drug in the presence or absence of selective CYP inhibitors) and was correlated with the amount of metabolites formed by cells incubated with 250 μM diclofenac. A poor correlation was observed in the case of the major metabolite 4′-OHdic (r = 0.52, Fig. 5A). Conversely, the IC50 correlated with5-OHdic (r = 0.84; Fig. 5B) and with N,5-(OH)2dic formation (r = 0.92; Fig. 5B).

Correlation between cytotoxicity and diclofenac metabolites formation. Rat hepatocytes were incubated with differents concentrations (100–750 μM) of diclofenac in the presence or absence of CYP inhibitors and the cytotoxicity was expressed as IC50. In parallel, the metabolism of diclofenac was investigated by HPLC analysis in 24-h cell culture media incubated with 250 μM diclofenac, and the formation of 4′-OHdic (A) and5-OHdic and N,5-(OH)2dic (B) correlated with the cytotoxicity determined for each cell culture. 1, control A; 2-ketoconazole B; 3, proadifen B; 4, control B; 5, control C; 6, ketoconazole E; 7, phenytoin B; 8, ketoconazole D; 9, proadifen D; 10, control D; 11, phenytoin D; 12, control E. Solid line, regression; dashed line, confidence interval.
Effects of Diclofenac and Its Metabolites on Hepatocyte Mitochondrial Function.
According to the results shown in Fig. 4D, the decrease in ATP was an early event in diclofenac toxicity, which could be attributable either to the drug or to any of its metabolites. In view of the fact that ATP depletion was paralleled by a decrease in mitochondrial membrane potential, we investigated the role of diclofenac and each metabolite on mitochondria by monitoring the synthesis of ATP. As shown in Fig. 6, the mitochondrial ATP synthesis was effectively impaired by 30 μM diclofenac (concentration found in the portal blood of rats given the drug orally; Tabata et al., 1996), as well as by its hydroxylated metabolites.

Effects of diclofenac and its metabolites on hepatocyte mitochondrial function. A mitochondrial suspension (final concentration 2 mg/ml protein) containing 2.5 mM ADP and 30 μM diclofenac or diclofenac metabolites was preincubated for 5 min at 30°C. Then substrates were added (2.5 mM glutamate and 2.5 mM malate) and after 5 min 100-μl samples of the incubation mixture were dropped in 900 μl of boiling buffer (100 mM Tris, 4 mM EDTA, pH 7.75). The ATP concentration was measured using the luciferin/luciferase assay according to the manufacturer’s instructions. Bioluminescence was quantified in a Lumat LB luminescence photometer.
Interconversion between 5-OHdic and N,5-(OH)2dic by Liver Microsomes.
We examined whether 5-OHdic and N,5-(OH)2dic, whose formation correlated with the toxicity of diclofenac, could also indirectly alter the energetic status of cells. Incubation of 5-OHdic with rat liver microsomes in aerobic conditions resulted in the formation of N,5-(OH)2dic (Fig.7A), whereas the incubation of N,5-(OH)2dic in presence of microsomes and NADPH yielded 5-OHdic (Fig. 7B). This reduction did not take place in the absence of either NADPH or microsomes. Most interestingly, when the NADPH content of the incubation mixture was monitored, a biphasic behavior was observed: a rapid NADPH decrease that coincided with the reduction of most N,5-(OH)2dic to 5-OHdic, followed by a sustained NADPH consumption once the equilibrium between the two metabolites was reached. Under the same experimental conditions, incubation of 4′-OHdic did not result in either metabolism or in NADPH consumption (Fig. 7C).

Interconversion of N,5-(OH)2dic and5-OHdic by liver microsomes. Pure 5-OHdic was incubated in the presence of microsomes and the formation of N,5-(OH)2dic was monitored by HPLC analysis (A). B, N,5-(OH)2dic was incubated in presence of microsomes and NADPH and the formation of5-OHdic followed by HPLC (B). C, the consumption of NADPH was monitored by HPLC analysis of the same samples as in B. Also the control and 4′-OHdic incubations are depicted.
Discussion
Diclofenac is an anti-inflammatory drug for which a certain number of severe adverse hepatic reactions have been reported (Ciccolunghi et al., 1978; Helfgott et al., 1990; Iveson et al., 1990; Sallie, 1990;Ouellette et al., 1991; Purcell et al., 1991; Scully et al., 1993). Detailed analysis of some individual case reports revealed clinical features that could be compatible with a direct toxic effect of diclofenac (or any of its metabolites), rather than a drug-allergy mechanism (Helfgott et al., 1990; Iveson et al., 1990; Sallie, 1990;Scully et al., 1993). In the present study, we investigated possible linkages between drug metabolism and cell injury to better understand the mechanisms of hepatotoxicity.
Among the several biochemical parameters examined, ATP was the earliest affected by the cytotoxic concentrations in short-term experiments (Fig. 3D). Parallel to this, a decrease in mitochondrial membrane potential was observed. These results, together with the previously reported protective effect of fructose on diclofenac toxicity (Ponsoda et al., 1995), lead us to consider a mitochondrial bioenergetic dysfunction to be one of the possible events causing diclofenac toxicity. The fact that subcytotoxic concentrations of diclofenac (100 μM), close to the portal concentration in the rat (30 μM; Tabata et al., 1996), caused a 50% inhibition of two characteristic ATP-consuming hepatocyte functions, namely gluconeogenesis and albumin synthesis, would favor this hypothesis. Both are “service” functions of hepatocytes and have in common the fact that they are not essential for hepatocyte survival but both require substantial amounts of ATP.
On the other hand, the fact that no significant changes in oxidative stress parameters (i.e., GSH and MDA levels) were observed, and the lack of a clear effect on the cytotoxicity of radical scavengers (BHT) and inhibitors of the formation of active oxygen species (deferoxamine), or compounds depleting intracellular GSH (BSO, DEM), did not support the hypothesis that this mechanism is a key event in diclofenac toxicity.
[Ca++]i levels did not increase during the early stages of cell exposure to diclofenac (Fig.3C), which is in agreement with previous reports (Schmitz et al., 1995). Only after a longer incubation of cells with diclofenac did [Ca++]i increase moderately, parallel to a decrease in cell viability. We believe this event may be simply concomitant with cell death, and the slight decrease in cell toxicity (not significant) that we observed agrees with this interpretation. A decrease in ATP impairs plasma membrane and endoplasmic reticulum ATP-dependent calcium pumps and leads to a sustained rise in intracellular free calcium (Nicotera et al., 1992). It is thus conceivable that the decrease in cellular ATP observed in hepatocytes incubated with diclofenac could be at the root of the late [Ca++]i elevation.
The experiments also revealed a possible link between drug metabolism and toxicity to hepatocytes. Several facts support this assessment. First of all, the ability of cells to metabolize diclofenac (human ≈ rat [tmt] FaO > HepG2 ≈ MDCK) was inversely related to the IC50 values, and inhibition of drug metabolism resulted in a decrease in toxicity (Fig.1). Second, there was a direct correlation between cytotoxicity and the extent of diclofenac metabolization by hepatocytes (Fig. 2). Third, analysis of culture media of hepatocytes revealed more precisely that cytotoxicity to hepatocytes was related to the formation of5-OHdic and N,5-(OH)2dic (Fig. 5B).
The chemical structure of this new metabolite was identified by the combined use of HPLC-MS, 1H NMR (Table 1), UV spectra, and chemical data. In a recent article, Miyamoto et al. (1997)reported the formation of an iminoquinone by HOCl oxidation of diclofenac in activated neutrophils. The authors also reported that hepatic microsomes could oxidize 5-OHdic to the same iminoquinone, which was trapped with GSH. This compound shows strong chemical similarities with the one reported in this study: dehydration of N,5-(OH)2dic would render the hypothesized iminoquinone. In fact, a compound showing similar fragments by HPLC-MS (electron impact fragmentation) than those obtained by Miyamoto et al. (1997) using MS-MS, was detected in preparations of N,5-(OH)2dicand in culture media of cells [m/z: 309 (M+), 267, 229, 201, 195, and 166].
The presence of N,5-(OH)2dicin culture medium, as well as in urine of rats given diclofenac, excluded an artifactual, noncellular formation of the metabolite (Table2). The fact that it appeared only as a conjugate reinforced this hypothesis and could also indicate that this compound escapes from the hepatocyte only after conjugation. Indeed, we have found that the concentration of this metabolite inside cells is approximately 16 times grater than in culture medium.
Despite the fact that ATP is the most relevant biochemical event observed, it is noteworthy that neither N,5-(OH)2dic nor5-OHdic showed much higher toxicity to mitochondria than diclofenac, as the data shown in Fig. 5B anticipated. Looking for other possible links between metabolite formation and cytotoxicity, we observed that the hydroxylamine generated by oxidation of5-OHdic with microsomes (Fig. 7A) could be backreduced to generate 5-OHdic in the presence of active microsomes and NADPH (Fig. 7B). Cellular enzymes able to carry out both types of reaction are known to exist (Yamada et al., 1988; Clement and Kunze, 1992). If both reactions take place simultaneously, this would allow N,5-(OH)2dic and5-OHdic to enter a futile cycle resulting in NADPH oxidation by O2. This is what the data presented in Fig. 7C suggest: addition of N,5-(OH)2dic to microsomes resulted first in a rapid decrease in NADPH by the reduction of N,5-(OH)2dic to5-OHdic, followed by a sustained decrease in the nucleotide concentration when both metabolites had reached equilibrium (Fig. 7B). This is not the case for 4′-OHdic, a metabolite that is not further metabolized by microsomes, and its formation by cells does not apparently correlate with cytotoxicity. The feasibility of this futile cycle is further supported by the fact that N,5-(OH)2dic tends to accumulate inside the cell. Consequently, in addition to the inhibitory effects that diclofenac and its metabolites show on mitochondrial ATP synthesis, futile depletion of NADPH by5-OHdic/N,5-(OH)2dicoxido-reduction could be at the root of the mechanism of hepatocyte toxicity induced by diclofenac.
Variable formation of 5-OHdic and N,5-(OH)2dic is observed in cultures of hepatocytes from different human donors when incubated with diclofenac, and recent evidence from our laboratory suggests that this could be due to a different expression of CYP2C19, which is involved in the 5-hydroxylation of diclofenac in the liver (R. Bort, submitted for publication). There is great variability in the expression of this enzyme in humans (Relling et al., 1990). It is thus suggestive to speculate that one factor contributing to the idiosyncratic nature of diclofenac hepatotoxicity could be the different expression of the CYPs metabolizing the drug into reactive/toxic metabolites.
Acknowledgments
We thank Carmen Lorenzo and Epifanı́a Belenchón for their expert technical help. The assistance of Dr. Luis Martı́nez in conducting spectroscopic analysis is acknowledged. We are indebted Dr. Miguel Angel Miranda for his skillful advice in mass spectrometry and 1H NMR data interpretation.
Footnotes
-
Send reprint requests to: Dr. José V. Castell, Unidad de Hepatologı́a Experimental. Centro de Investigación, Hospital Universitario “La Fe”, SVS. Avda. Campanar 21, E-46009 Valencia, Spain. E-mail:Jose.Castell{at}uv.es
-
↵1 This study was supported, in part, by the BIOMED II Research Program of the European Union and the Fondo de Investigaciones Sanitarias, Spanish Ministry of Health. R.B. was recipient of a predoctoral fellowship from the Consellerı́a de Educación y Ciencia, Generalitat Valenciana.
- Abbreviations:
- BHT
- buthylated hydroxytoluene
- BSO
- l-buthionine-[S,R]-sulfoximine
- CYP
- cytochrome P-450
- MDA
- malondialdehyde
- DEM
- maleic acid diethyl ester
- MTT
- 3-[4,5-dimethylthiazol-2-yl]-3,5-diphenylformazan
- PBS
- phosphate-buffered saline
- 4′-OHdic
- 4′-hydroxydiclofenac
- 5-OHdic
- 5-hydroxydiclofenac
- N
- 5-(OH)2dic,N,5-dihydroxydiclofenac
- [Ca++]i
- intracellular calcium
- GSH
- glutathione
- HPLC-MS
- high-performance liquid chromatography-mass spectrometry
- Received April 8, 1998.
- Accepted July 21, 1998.
- The American Society for Pharmacology and Experimental Therapeutics


