


Visual Overview

Abstract
In this work, we first describe the population variability in hepatic drug metabolism using cryopreserved hepatocytes from five different donors cultured in a perfused three-dimensional human liver microphysiological system, and then show how the resulting data can be integrated with a modeling and simulation framework to accomplish in vitro–in vivo translation. For each donor, metabolic depletion profiles of six compounds (phenacetin, diclofenac, lidocaine, ibuprofen, propranolol, and prednisolone) were measured, along with metabolite formation, mRNA levels of 90 metabolism-related genes, and markers of functional viability [lactate dehydrogenase (LDH) release, albumin, and urea production]. Drug depletion data were analyzed with mixed-effects modeling. Substantial interdonor variability was observed with respect to gene expression levels, drug metabolism, and other measured hepatocyte functions. Specifically, interdonor variability in intrinsic metabolic clearance ranged from 24.1% for phenacetin to 66.8% for propranolol (expressed as coefficient of variation). Albumin, urea, LDH, and cytochrome P450 mRNA levels were identified as significant predictors of in vitro metabolic clearance. Predicted clearance values from the liver microphysiological system were correlated with the observed in vivo values. A population physiologically based pharmacokinetic model was developed for lidocaine to illustrate the translation of the in vitro output to the observed pharmacokinetic variability in vivo. Stochastic simulations with this model successfully predicted the observed clinical concentration-time profiles and the associated population variability. This is the first study of population variability in drug metabolism in the context of a microphysiological system and has important implications for the use of these systems during the drug development process.
Introduction
During preclinical drug development, prediction of hepatic clearance is of significant importance to set the first human dose and guide the selection of dosage regimens that achieve drug concentrations within the therapeutic window. However, to efficiently design clinical studies, it is crucial to predict hepatic drug metabolism and human pharmacokinetics, not only at the level of an “average individual” but also accounting for the associated population variability (Jamei et al., 2009).
To investigate interindividual variability in vitro, drug-metabolism assays must be performed independently for hepatocytes obtained from different donors and with an appropriate statistical analysis of the obtained data to estimate the interdonor variability in intrinsic clearance disentangled from measurement error/uncertainty and any other types of variability (e.g., interwell). Additionally, the estimate of interindividual variability in intrinsic metabolic clearance, as assessed in vitro, needs to be coupled with the population variability associated with other physiologic processes in vivo (e.g., hepatic blood flow, drug binding to plasma proteins, etc.). Thus, to perform in vivo predictions at the population level, a systems pharmacology approach (Trame et al., 2016) is desirable, where the in vitro results are integrated into population physiologically based pharmacokinetic (PBPK) models (Rostami-Hodjegan, 2012; Jones and Rowland-Yeo, 2013; Tsamandouras et al., 2015a,b).
Several in vitro systems have been traditionally applied to study drug metabolism, including human liver microsomes (Obach, 1999) and cryopreserved human hepatocyte suspensions (Brown et al., 2007). Although these systems have been very valuable in drug development (Di et al., 2012) and are easy to use, they lose metabolic activity over time, hence the study of low-clearance compounds is challenging (Di and Obach, 2015; Hutzler et al., 2015). In addition, overall these in vitro systems tend to underpredict in vivo clearance (Hallifax et al., 2010). Finally, drug-metabolism studies are often performed in human liver microsomes or hepatocytes pooled from several donors. Thus, the predicted intrinsic clearance refers to an “average individual,” and the associated interindividual variability is not obtained.
Recently, new hepatic in vitro culture models have emerged to improve physiologic responses and mitigate the rapid loss of metabolic function typically observed in culture, thus offering opportunity to improve predictions of human drug clearance, especially for low-clearance compounds. Whereas static two-dimensional cocultures of hepatocytes with other cell types show some stabilization of function, a variety of three-dimensional (3D) culture models incorporating perfusion flow exhibit prolonged viability and function under serum-free conditions (Ebrahimkhani et al., 2014). Such 3D perfused models of liver and other tissues, where microfluidic or microscale reactors are used to control the flow of culture medium, are often termed “microphysiological systems” (MPS) or “organs on chips.” In this work, we use a particular well developed, commercially available microreactor system for 3D perfused liver culture, the LiverChip (CN Bio Innovations, Hertfordshire, UK) (Dash et al., 2009; Domansky et al., 2010; Sarkar et al., 2015; Vivares et al., 2015). The LiverChip comprises a scaffold that fosters formation of an array of ∼0.2-mm 3D tissue structures from primary human liver cells, and an on-board microfluidic pumping system, driven by pneumatics, that precisely perfuses the scaffold with culture medium to control oxygenation and shear stress on the tissue, enabling long-term culture with retention of physiological responses (Dash et al., 2009; Domansky et al., 2010; Vivares et al., 2015). The LiverChip platform, seeded with hepatocytes or with mixtures of hepatocytes and nonparenchymal cells, has been applied to analyze drug metabolism, inflammatory effects, drug-drug interactions, and as a model of breast cancer metastasis to the liver (Wheeler et al., 2014; Sarkar et al., 2015; Vivares et al., 2015; Long et al., 2016).
The current work first focuses on the in vitro assessment of population variability in drug metabolism and the relationship of that with variability in other phenotypic metrics, such as production of liver-specific factors (e.g., albumin, urea) and expression of metabolism-related genes. In vitro experiments were performed in a liver microphysiological system, housed in the LiverChip platform, utilizing hepatocytes from different donors. The ability of pooled hepatocytes to recapitulate the average phenotype across the different donors was also assessed. Since the purpose of investigating metabolism in vitro is to predict human pharmacokinetics, we follow up by integrating the generated data with a computational modeling and simulation framework to attempt in vitro to in vivo translation of population variability in drug metabolism.
Materials and Methods
3D Hepatocyte Tissue Culture.
All sources of chemicals and reagents used are reported in the Supplemental Material (section 1.1). Cryopreserved human primary hepatocytes from five different donors were purchased from Life Technologies (Paisley UK). All donors (three males, two females) were Caucasians spanning a 21–72 years age range. Cells were recovered according to the supplier’s instructions. Viability was assessed using trypan blue exclusion and was >85% for all lots. Hepatocyte suspensions were seeded (6 × 10⁵ cells per scaffold) into scaffolds housed in the LiverChip in a total volume of 1.6 ml per compartment. Primary human hepatocytes from the five different donors were cultured, as well as a pooled hepatocyte sample, which contained equal numbers of cells from each of the five donors. In total, 21 wells were seeded for each donor and the pooled sample, from which 18 were intended for the drug-metabolism study (6 compounds × 3 replicate wells) and three were intended to be sacrificed at day 6 for RNA analysis. After the initial attachment period, cells undergo morphogenesis to form an array of 3D microtissues within the channels of the scaffold over a period of 3 days. Cells were maintained in Williams’ E medium containing primary hepatocyte thawing and plating supplements (Life Technologies) for the first day of culture. Maintenance supplements (Life Technologies), which are serum-free, were used thereafter. All cultures were maintained in a standard humidified atmosphere at 37°C with 5% CO2 and had a first complete medium change at 24 hours, then after a further 72 hours.
Hepatocyte Culture Phenotypic Characterization.
Albumin and urea production as well as lactate dehydrogenase (LDH) release were measured before the drug-metabolism study (4 days postseeding). Albumin production was measured in supernatant using a human albumin enzyme-linked immunosorbent assay (Assay Pro, St. Charles, MO). Urea was quantified with a colorimetric assay kit (BioAssay Systems, Hayward, CA) and LDH secretion was measured using the CytoTox 96 nonradioactive cytotoxicity assay (Promega, Southampton, UK). Albumin, urea, and LDH were also measured postdose at the end of the drug-metabolism study (day 5 for wells treated with phenacetin; day 6 for wells treated with diclofenac, propranolol, lidocaine, and ibuprofen; and day 7 for wells treated with prednisolone). At the end of the experiment, the scaffolds/tissues were removed and washed with phosphate-buffered saline. Bright field images were taken using an inverted light microscope (Leica, Milton Kaynes, UK).
RNA Isolation and Gene Expression Analysis.
Total RNA was extracted from freshly thawed hepatocytes or from LiverChip scaffolds cultured for 6 days (run in parallel to the drug-metabolism study without the addition of any drug) using TRIzol Reagent (Ambion, Loughborough, UK) and a chloroform phase separation. Quantitative polymerase chain reaction (PCR) was performed using SYBR Green PCR Master Mix (Applied Biosystems, Loughborough, UK) and primers designed against transcripts related to hepatic genes of specific interest (Supplemental Table S1). Samples were analyzed using a QuantStudio 6 real-time PCR system (Applied Biosystems, UK). Ct values from samples were compared and normalized to GAPDH expression. Samples were also analyzed by RT2 Profiler PCR Arrays (Qiagen, Manchester, UK). Reverse transcription was performed using RT2 First Strand Kit, and cDNA was analyzed by Human Drug Metabolism (PAHS-002ZC-12) RT2 Profiler PCR Arrays. Ct values from samples were compared and normalized to the average expression across five different housekeeping genes (ACTB, B2M, GAPDH, HPRT1, and RPLP0). The quantitative PCR and super-array data (referring to 6 and 84 genes, respectively) were merged to generate a data set of 90 genes, the expression of which was investigated. The complete methods regarding RNA isolation and the gene-expression analysis are provided in the Supplemental Material (section 1.2).
Drug-Metabolism Study.
At day 4, six different compounds (phenacetin, diclofenac, lidocaine, ibuprofen, propranolol, and prednisolone) were added as a bolus dose to the microtissues at an initial concentration of 1 μM during a full medium change (final volume per well was 1.8 ml), and the final solvent (dimethylsulfoxide) concentration never exceeded 0.1% (v/v). Supernatant samples (60 μl) (i.e., corresponding to the extracellular compartment) were taken at predetermined postdose sampling times (0, 1, 4, 6, and 24 hours for phenacetin; 0, 1, 4, 24, and 48 hours for diclofenac, propranolol, lidocaine, and ibuprofen; and 0, 4, 24, 48, and 72 hours for prednisolone). For the time 0 measurements, a sample was taken from each culture well immediately (instantaneously) after the addition of the drug-containing medium to accurately evaluate the initial drug concentration in each well. All samples were analyzed for the presence of the dosed compound. Additionally, metabolite formation was measured for phenacetin (acetaminophen), diclofenac (4-OH-diclofenac), ibuprofen (2-OH-ibuprofen), and prednisolone (6β-OH-prednisolone). Extensive details regarding sample preparation and the liquid chromatography–tandem mass spectrometry analysis are provided in the Supplemental Material (section 1.3).
Investigation of Drug Binding to the Platform and Tissue Culture Medium.
The compounds were also added to LiverChip wells containing no hepatocytes to analyze nonspecific binding to plate components. Each well was treated in the same way as the wells containing microtissues. Sixty-microliter samples were taken from these plates at 0, 1, and 48 hours postdosing, and samples were treated and analyzed for the presence of the dosed compound as described in the Supplemental Material (section 1.3).
Unbound drug fraction in the bovine serum albumin-containing cell culture medium was quantified by rapid equilibrium dialysis. Details are provided in the Supplemental Material (section 1.4).
Pharmacokinetic Analysis of the Drug Depletion Data.
The drug depletion data corresponding to individual donors were analyzed with a population pharmacokinetic modeling approach using nonlinear mixed-effects modeling software (NONMEM 7.3; ICON Development Solutions, Ellicott City, MD) and the first-order conditional estimation method with interaction. A one-compartment pharmacokinetic model (model of monoexponential decay) was used to fit the drug depletion data (eq. 1): (1)where
  is the model prediction for the kth observed concentration regarding the ith donor and the jth well, sampled at time
  ;
; is the substrate concentration in the medium at time 0 regarding the ith donor and the jth well (experimentally measured by sampling each well instantaneously after the addition of the drug-containing medium);
  is the volume of the medium during the substrate depletion experiment (1.8 ml);
  is the fraction of drug which is unbound in the medium and thus available for metabolism (experimentally determined with equilibrium dialysis); and
  is the unbound intrinsic clearance regarding the ith donor and the jth well. Both interdonor variability (IDV) and interwell variability (IWV) were taken into account during the estimation of unbound intrinsic clearance using an exponential relationship (see eq. 2), which assumes that clearance is log-normally distributed:
 (2)where
  is the typical (median) value of unbound intrinsic clearance across all donors/wells;
  is the random effect referring to between-donor differences (thus IDV); and
  is the random effect referring to between-well differences within a donor (thus IWV). Both
  and
and  are assumed to be independently normally distributed with mean 0 and variance
  and
and  , respectively. A common variance was assumed for all wells using the SAME option in NONMEM. Finally, an additional level of variability was taken into account, termed residual variability, using an additive error model on the scale of the log-transformed observations/predictions (see eq. 3):
 (3)where
  is the kth observed concentration regarding the ith donor and the jth well, sampled at time
  ;
; is the respective model prediction (see eq. 1);
 is the random effect referring to residual variability and thus the differences between the observed concentrations and the model predictions due to unexplained factors (e.g., measurement/assay error, model misspecification, etc.); and
  is assumed to be normally distributed with mean 0 and variance
  . Typical goodness-of-fit plots (e.g., observations versus predictions, residuals versus time/predictions) and simulation-based diagnostics (e.g., visual predictive checks) were used to detect the adequacy of the developed mixed-effects models (Karlsson and Savic, 2007).
The drug depletion data corresponding to the pooled hepatocytes where subsequently analyzed in a similar framework, with the difference that, in the pooled hepatocytes data, the only level of variability in  is the IWV.
Identification of In Vitro Clearance Predictors.
The normalized (see Supplemental Material, section 1.5) values of intrinsic clearance obtained across different donors/wells were investigated in relation to the values of the respective predose phenotypic metrics (albumin/urea production, LDH release) and donor-specific mRNA levels of the primary for the metabolism of each compound cytochrome P450 (P450). All methodological details regarding this investigation are provided in the Supplemental Material (section 1.5).
Prediction of In Vivo Hepatic Clearance.
The typical values of unbound intrinsic clearance [ ] determined for each compound from the pharmacokinetic analysis of the individual-donor in vitro data were subsequently used to derive a prediction with regard to the in vivo hepatic clearance. These predicted hepatic clearance values were then compared with clinically observed values, and the overall agreement was determined by the calculation of the average fold-error across all compounds. All of the related methodological details and the complete procedure (equations) used for in vitro–in vivo extrapolation of clearance are reported in the Supplemental Material (section 1.6).
Population In Vitro–In Vivo Translation with the Aid of PBPK Modeling.
A population PBPK model for lidocaine was developed to illustrate the framework under which the liver MPS data can be translated to predictions of in vivo concentration-time profiles at the population level. The rationale for selection of lidocaine among the other in vitro evaluated compounds is described in the Supplemental Material (section 1.7). Each tissue/organ of the developed PBPK model was assumed to be a well stirred compartment with perfusion-limited kinetics, and the liver was considered as the only site of elimination (Supplemental Fig. S1). Renal clearance was assumed to be negligible, as only around 8% of the drug is excreted unchanged in urine (Benet et al., 2011). An empirical scaling factor (determined across all compounds evaluated in this work) was incorporated on the in vitro–determined hepatic clearance of lidocaine with the aim of correcting for any systematic underprediction of in vivo clearance with the used in vitro system (Supplemental Material, sections 1.6 and 1.10). The PBPK model was mathematically described with a system of 14 mass balance differential equations (Supplemental Material, section 1.8), which were solved in MATLAB R2015b (MathWorks, Inc., Natick, MA). Model simulations for 1000 “virtual individuals” were performed, taking into account population variability in both the system- and drug-related parameters of the model. All model parameters along with the exact methodology for the generation of the respective population distributions are described in the Supplemental Material (sections 1.9 and 1.10 for system- and drug-related parameters, respectively). This approach allowed the generation of 95% population prediction intervals associated with lidocaine concentration-time profiles in arterial plasma after a constant-rate i.v. infusion of lidocaine HCl, 3 mg/kg, over a 3-minute period. Model predictions were then compared with clinically observed arterial concentration-time profiles (Tucker and Boas, 1971) obtained under the same dosage regimen.
Results
Variability in Cell Culture Phenotype.
Human serum albumin production, urea production, and LDH release to extracellular medium in the liver MPS were quantified to assess baseline cell health and phenotypic variability among the donors and wells prior to drug exposure (predose, day 4). Substantial and statistically significant differences in albumin production, urea production, and LDH release were observed across hepatocyte cultures from the five different donors (Fig. 1). These phenotypic metrics were also merged across the five different donors and compared with the equivalent metrics from the pooled hepatocytes. Although no difference was observed in albumin production, the pooled hepatocytes were associated with higher urea production and higher LDH levels (Fig. 1).
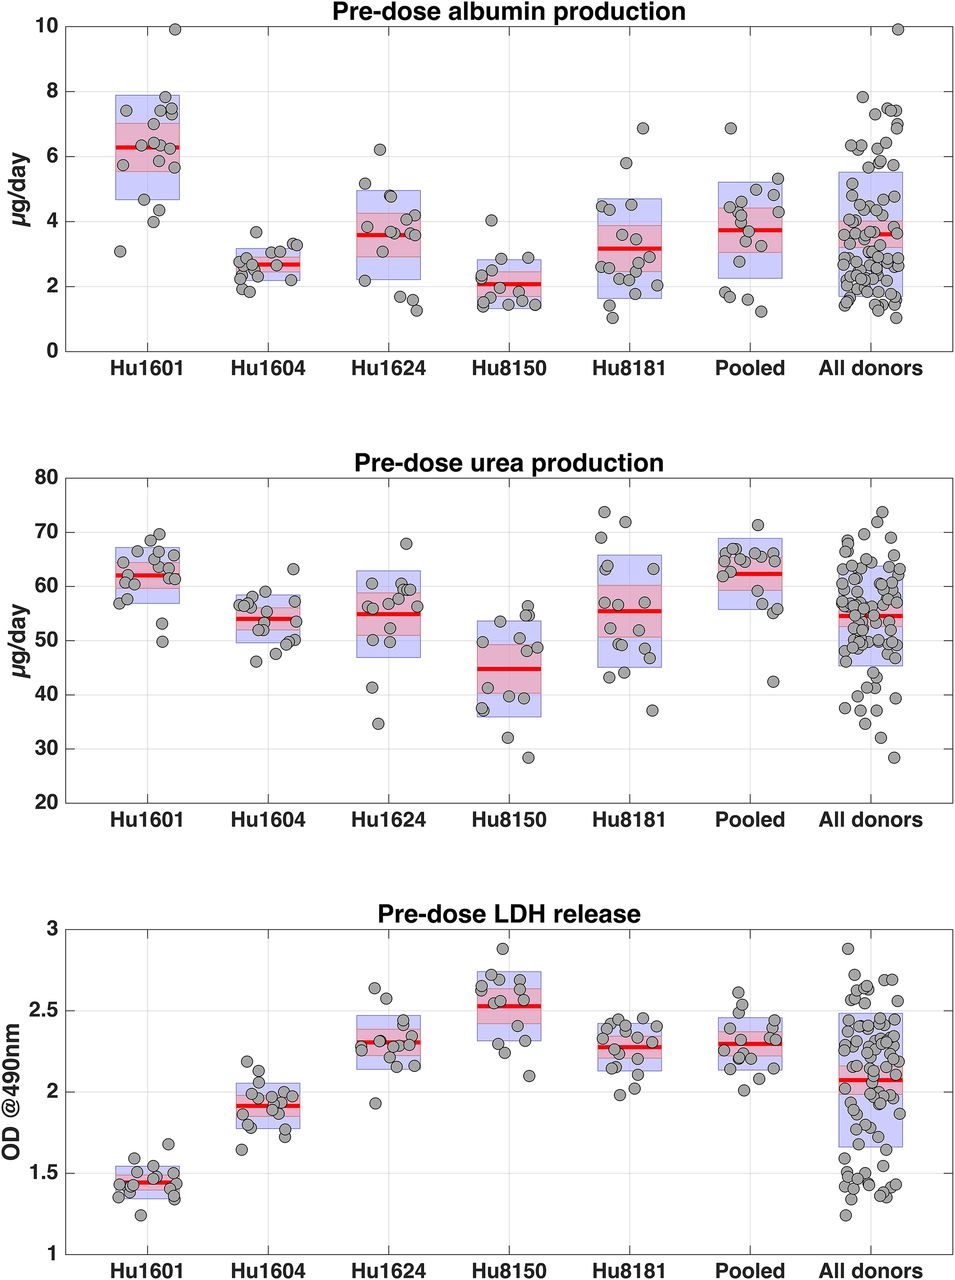
Predose (measured at day 4) albumin, urea, and LDH levels stratified across different donors. Hu1601, Hu1604, Hu1624, Hu8150, and Hu8181 are lot numbers corresponding to five different donors. “Pooled” refers to the pool of hepatocytes from the five donors, and “All donors” refers to the data from all five donors merged together. Red lines correspond to the mean of the data, purple boxes extend the mean by ± 1 S.D., and pink boxes correspond to 95% confidence intervals around the mean. LDH levels are expressed in optical density (OD) units at 490 nm.
The same phenotypic metrics were also measured at the end of the drug-metabolism study (postdose, days 5–7). Hepatocyte cultures were clearly functional throughout the study, as demonstrated by continued albumin and urea production. More specifically, across all treatments, postdose albumin production was significantly increased and LDH release was significantly decreased compared with the equivalent predose levels (Fig. 2). Urea production also exhibited an overall trend of increase at postdose measurements for all treatments, except prednisolone. Further analysis supported that the aforementioned differences are likely due to the increased period in culture rather than due to a treatment (compound) effect, as the postdose metrics were not significantly different between treatments (see Supplemental Material, section 2.1). The stratification of these postdose phenotypic metrics, not only across treatments but also across different donors (Supplemental Figs. S2–S4), indicates continued significant interdonor variability during the drug-metabolism study. Last, a correlation matrix plot of all pre- and postdose phenotypic metrics measured across all different donors (or pool of donors) and wells illustrated that strong pairwise correlations may occur across these metrics (Supplemental Fig. S5).

Comparison between the predose (measured at day 4) and the postdose (measured at day 6 for diclofenac, propranolol, lidocaine, and ibuprofen and days 5 and 7 for phenacetin and prednisolone, respectively) albumin, urea, and LDH levels stratified across different treatments. Data from both the five donors and the pooled hepatocytes are shown. Red lines correspond to the mean of the data, purple boxes extend the mean by ± 1 S.D., and pink boxes correspond to 95% confidence intervals around the mean. Thin black lines connect the pre- and postdose levels in a given donor (or pool of donors) and well. Asterisks inside each subplot indicate significant differences between pre- and postdose levels (*P < 0.05, **P < 0.01, ***P < 0.001). LDH levels are expressed in optical density (OD) units at 490 nm.
The three-dimensional microtissue structures were visualized at the end of the experiment. The results show that the tissue formation was consistent/comparable across the different donors and was maintained throughout the culture period (Supplemental Fig. S6). All of the results regarding the quantitative/statistical analysis of the phenotypic metrics are described in the Supplemental Material (section 2.1).
Gene Expression.
A comparison of gene expression (drug-metabolism related) signature between freshly thawed hepatocytes and the liver MPS showed a statistically significant difference for only 10 of the 90 investigated genes (four downregulated and six upregulated in the liver MPS; see Fig. 3). Thus, for the vast majority of the investigated metabolism-related genes, hepatocyte microtissues retain gene expression (6 days after seeding) at levels comparable to those in freshly thawed hepatocytes. The list of all genes investigated in this work, the average fold-changes in expression, and the associated statistical significance are reported in Supplemental Table S2. To visualize the changes in gene expression signature separately at the level of each donor (or pool of donors) and identify clusters of genes that are jointly up- or downregulated, agglomerative hierarchical clustering was performed (Supplemental Fig. S7). A number of genes were consistently down- or upregulated in the liver MPS compared with freshly thawed hepatocytes for all different donors; however, there were also genes that were diversely regulated across donors [some genes (e.g., CYP3A5) were strongly upregulated in donor Hu8181 but downregulated in all other donors]. This further highlights the presence of interdonor variability.

Volcano plot that illustrates the average fold-change in gene expression between the liver MPS (day 6) and freshly thawed hepatocytes along with the associated statistical significance. The log2 of the fold-change is plotted on the x-axis; thus, positive values indicate upregulation in the liver MPS compared with the freshly thawed hepatocytes, whereas negative values indicate downregulation. Genes outside the two black vertical lines are up- or downregulated more than 3-fold. On the y-axis, the –log10 of the P value is plotted; thus, the higher values indicate stronger statistical evidence of a significant difference in gene expression between the liver MPS and freshly thawed hepatocytes. The genes for which significant differences were detected after multiple testing correction are highlighted in red, and the respective gene names are reported.
Additionally, it was observed (Supplemental Fig. S8) that for the vast majority of genes, the magnitude of interdonor variability in mRNA expression levels was significantly larger in freshly thawed hepatocytes [average coefficient of variation (CV) across all genes was 72%] compared with the liver MPS (average CV across all genes was 34%).
Finally, of the 90 investigated genes, only five in the liver MPS and none in the freshly thawed hepatocytes were significantly differentially expressed in the pooled hepatocyte samples compared with the average values observed across the different donors (Supplemental Fig. S9). Thus, overall, there was no evidence against the argument that the mRNA expression levels obtained from the pooled hepatocytes can be considered as representative of the average mRNA expression obtained across the different donors. However, for the majority of genes in the liver MPS, there was a nonsignificant trend that the pooled hepatocytes marginally overpredict the average mRNA expression obtained across the different donors, whereas for the majority of genes in the freshly thawed hepatocytes, the opposite nonsignificant trend was observed (Supplemental Fig. S9).
Drug Binding to the Hepatocyte-Free LiverChip and Tissue Culture Medium.
Nonspecific drug binding to the hepatocyte-free LiverChip platforms was evaluated for the drugs used in metabolism studies. The quantification of each drug showed no evidence of nonspecific drug binding to LiverChip components after 48-hour exposure (Supplemental Fig. S10). Therefore, nonspecific binding of the investigated compounds to the LiverChip materials was treated as negligible in the current work.
The rapid equilibrium dialysis analysis indicated that the extent of binding to cell culture media components (e.g., bovine serum albumin) varies substantially across the investigated compounds. The unbound fraction in media for diclofenac, ibuprofen, lidocaine, prednisolone, propranolol, and phenacetin was determined to be 0.13 (35% CV), 0.31 (10% CV), 0.88 (9% CV), 0.94 (4% CV), 0.98 (2% CV), and 0.98 (1% CV), respectively (CV refers to coefficient of variation across triplicate experiments).
Pharmacokinetic Analysis of the Drug Depletion Data.
All drug depletion data across different donors and wells available to the pharmacokinetic analysis are presented in Fig. 4 (see also Supplemental Material, section 2.2 for a numerical summary and Supplemental Fig. S11 for averaged concentration-time profiles for each donor across different wells). Substantial interdonor and interwell variability was observed in the metabolic depletion profiles of all compounds.

Drug depletion data available for the pharmacokinetic analysis. Hu1601, Hu1604, Hu1624, Hu8150, and Hu8181 are lot numbers corresponding to five different donors. “Pool” refers to the pool of hepatocytes from the five donors. The small numbers on the right of each concentration point (values of 1, 2, or 3) aim to distinguish different wells across the same donor (or pool of donors).
The results of the mixed-effects modeling of the individual-donor drug depletion data are presented in Table 1. The estimates of the typical intrinsic clearance [ ] for the six investigated compounds ranged from 0.81 μl/min/106 cells for prednisolone to 17.8 μl/min/106 cells for diclofenac. These parameters were precisely estimated for all compounds with relatively low standard errors. The intrinsic clearance of all compounds was associated with substantial interdonor variability, and the respective CV% ranged from 24.1% for phenacetin to 66.8% for propranolol. Interwell variability (within donor) in intrinsic clearance was less pronounced than interdonor variability for all compounds except phenacetin (marginally higher IWV compared with IDV). The coefficient of variation with respect to the interwell variability in intrinsic clearance ranged from 6% for diclofenac to 32.9% for propranolol. The residual (unexplained) variability of the model regarding the observed concentrations was relatively small for all compounds, ranging from 8.4% CV for lidocaine to 21.6% CV for propranolol.
Parameter estimates from the modeling of the drug depletion data
The developed mixed-effects models adequately reflect not only the average trend in the data but also the observed variability (Fig. 5). Additionally, the ability of this modeling approach to accurately describe the data not only in total but also at the level of each individual donor and well is illustrated in Supplemental Fig. S12 in the case of propranolol (the compound with the highest degree of interdonor and interwell variability). The one-compartment pharmacokinetic model that was assumed for drug depletion provided an adequate description of the data, as the majority of the compounds exhibited monoexponential declines in their concentration-time profiles, with the exception of diclofenac, for which a model of biexponential decline might be more appropriate (Figs. 4 and 5). However, an additional analysis (Supplemental Material, section 2.3) supported that the monoexponential decline assumption for diclofenac does not introduce any substantial bias for the purpose of this work.

Visual predictive checks of the developed mixed-effect models with regard to the observed individual-donor drug depletion data. Closed gray circles represent the observed concentrations in medium; highlighted with purple are the areas between the 5th and 95th percentiles of model simulations that take into account the different levels of variability (90% prediction intervals), whereas the red solid line represents their median (median prediction); the horizontal dashed black line represents the limit of quantification.
The results regarding the analysis of the pooled hepatocyte drug depletion data are also presented in Table 1, and the adequacy of the model to describe the observed data is illustrated in Supplemental Fig. S13. Estimates of the typical intrinsic clearance [ ] for the six investigated compounds in pooled hepatocytes ranged from 0.91 μl/min/106 cells for prednisolone to 18.6 μl/min/106 cells for diclofenac. A comparison with the equivalent clearance estimates determined from the individual-donor data indicates only minor differences (Table 1) and supports the notion that pooled hepatocytes can provide a relatively unbiased estimate of the average clearance in the donor population. More specifically, the ratio of
  determined in the individual donor data to the
  determined in the pooled hepatocyte data ranged from 0.61 for propranolol to 1.42 for ibuprofen, with an average of 0.97 across all compounds (see Table 1). In addition, the 95% confidence intervals associated with this ratio included 1 for all compounds with the sole exception of propranolol, which is consequently the only compound exhibiting marginal evidence of bias in the determination of clearance in the donor population by using pooled hepatocytes.
Metabolite Formation.
Metabolite concentration-time profiles were determined for prednisolone, phenacetin, ibuprofen, and diclofenac (Supplemental Fig. S14). A strong correlation was observed between the intrinsic clearance for drug depletion in a given donor/well and the respective metabolite formation levels (Supplemental Fig. S15). More specifically, the linear regression R2 values were very high for three of these compounds (0.91, 0.82, and 0.77 for prednisolone, ibuprofen, and diclofenac, respectively), whereas the correlation was weaker for phenacetin (R2 squared = 0.4). These results indicate that the clear interdonor differences observed in drug depletion clearance are also reflected in the metabolite formation levels.
Identification of In Vitro Intrinsic Clearance Predictors.
Predose albumin and urea production levels in a given donor/well were positively correlated with the respective intrinsic clearance values that were subsequently obtained from the drug-metabolism study (Supplemental Fig. S16). On the other hand, these intrinsic clearance values were negatively correlated with the predose LDH release levels, whereas P450 mRNA levels had only a marginal positive correlation (Supplemental Fig. S16). A Lasso regression model, in which several covariates are considered simultaneously, identified all of the previously discussed metrics (albumin, urea, LDH, and P450 mRNA levels) as significant predictors of in vitro intrinsic clearance (Supplemental Table S3 and Fig. S17). Although this model was able to account for a substantial part of the observed variability in intrinsic clearance values (R2 = 0.52), there is still unexplained variability that cannot be captured solely by these four predictors (Supplemental Material, Fig. S18).
Prediction of In Vivo Hepatic Clearance.
The results regarding the agreement between the observed hepatic clearances in vivo and the predicted hepatic clearances from the in vitro data are graphically illustrated and numerically summarized in Supplemental Fig. S19 and Table S4, respectively. Predicted clearance values from the liver MPS study were strongly correlated with the observed in vivo values [linear regression R2 values of 0.75 and 0.77, respectively, when the parallel tube (PT) or the well stirred (WS) liver model was used]. The average fold-error across all compounds (underprediction) was 4.2-fold and 4.5-fold when the PT or the WS liver model was used, respectively. The lowest degree of underprediction was observed for phenacetin (1.7-fold and 2.1-fold for the PT and WS models, respectively), and the highest, for propranolol (8.2-fold and 8.5-fold for the PT and WS models, respectively). By calculating the deviations between observations and predictions at the level of intrinsic clearances (see Supplemental Material, section 1.6), an empirical scaling factor of 5.4 or 8.7 was derived when the PT or the WS liver model was considered, respectively.
Population In Vitro–In Vivo Translation with the Aid of PBPK Modeling.
The success of the population PBPK modeling approach used for in vitro–in vivo translation at the “population level” is illustrated in Fig. 6. The model predictions were in close agreement with the clinically observed data (Tucker and Boas, 1971), adequately capturing not only the average trend in the observed clinical data but also the extent of the associated interindividual variability. Minor disagreements between model predictions and observations are considered acceptable, as the model mainly utilizes in vitro/in silico information, and the observed concentration-time data have not been used to fit (estimate) any of the model parameters.

Population PBPK model prediction of lidocaine arterial plasma concentrations during and after a constant-rate i.v. infusion (lidocaine HCl, 3 mg/kg for 3 minutes). The clinically observed data represented with closed gray circles were extracted from Tucker and Boas (1971) across five different subjects. The shaded area corresponds to the 95% population prediction intervals of the model, and the red line corresponds to the median model prediction. The insert plot magnifies the first 16 minutes for the purpose of clarity.
Discussion
Microphysiological systems have not been fully evaluated for quantitative pharmacology applications, such as prediction of hepatic drug metabolism. The current work focuses on the in vitro assessment of population variability in drug metabolism using a liver MPS and the subsequent translation to variability in pharmacokinetics in vivo using computational modeling and simulation methodologies. The overall framework used in this work (see schematic in visual abstract) represents our recommendation with regard to the analysis and the subsequent in vivo translation of in vitro data generated in microphysiological systems.
The generated output in such systems (e.g., drug depletion profiles) is a complex function of the characteristics of the in vitro system (e.g., number of cells, medium volume, and composition) and intrinsic biologic parameters (e.g., unbound intrinsic clearance for a given drug). Through model-based analysis of the in vitro output, we estimated the intrinsic biologic parameter (unbound intrinsic clearance) disentangled to the greatest possible degree from the in vitro system characteristics and any additional processes taking place in the platform (e.g., drug binding to medium components).
To estimate population variability associated with the intrinsic biologic parameter, the study was designed to capture drug depletion data across multiple donors and multiple wells for each donor. The statistical analysis of such multilevel longitudinal data is challenging and can be approached with different methods. However, the most suitable and unbiased method is through nonlinear mixed-effects modeling (Sheiner and Beal, 1981; 1983; Mould and Upton, 2013), as this simultaneously takes into account the different sources and levels of variability. It was demonstrated here that the in vitro–determined metabolic drug clearance varied substantially across hepatocytes from different donors. This highlights that clearance predictions for new compounds should be evaluated carefully when hepatocytes from a single donor only are used. It was also demonstrated that interwell variability in intrinsic clearance was generally lower than the associated interdonor variability, providing further confidence in microphysiological systems for future investigations of population variability in drug metabolism.
The unbound intrinsic clearance along with the associated interdonor variability obtained from the liver MPS can be scaled up and integrated with the characteristics of the in vivo system (hepatic blood flow, organ volumes, etc.) and their respective population variability through the use of PBPK modeling and the performance of stochastic simulations (Jones and Rowland-Yeo, 2013; Tsamandouras et al., 2015b,c). The lidocaine case study illustrated the details of this approach, and to our knowledge, this work is the first to combine experimental liver MPS data with a computational systems pharmacology framework to perform in vivo pharmacokinetic predictions. The accurate prediction of the clinically observed population variability in lidocaine plasma concentration-time profiles provides further confidence in the value of this combined experimental and computational approach.
Interdonor variability was also investigated in the liver MPS with respect to additional phenotypic levels. Specifically, secreted and released biomolecules (albumin, urea, LDH) further highlighted the donor variability in terms of culture functionality and viability. Interestingly, we observed a clear correlation between the levels of these biomolecular markers before drug administration and the subsequently determined drug clearance in the respective donors/wells. Although accurate cell number quantification in MPS technologies is a challenge, it is essential for quantitative pharmacology studies. In the current study, visual inspection of phase-contrast images indicated that seeding across different wells was consistent and equally successful across hepatocytes from different donors. In comparison, the extent of the interdonor/interwell differences observed in this work in drug clearance and other biomolecular metrics (albumin, urea, LDH) is much more pronounced, indicating that the aforementioned differences and correlations mainly arise through the MPS biology and are not simply a reflection of differences in attached cell numbers on the scaffolds.
The mRNA expression of metabolism-related genes exhibited substantial diversity across different donors. Interestingly, interdonor variability in mRNA expression levels was significantly lower in liver MPS cultured hepatocytes (6 days after seeding) compared with freshly thawed hepatocytes. We hypothesize that this is due to adaptation to the much more controlled and consistent environment of stimuli/cues (medium composition, flow, oxygen gradient, etc.) present in the liver MPS culture. Finally, although P450 mRNA level was identified in conjunction with other phenotypic metrics (albumin, urea, LDH) to be a predictor of intrinsic metabolic clearance, it accounted for only a very small portion of the clearance variability. Thus, screening mRNA expression of metabolic enzymes across different donors should not be used as a surrogate marker for interdonor variability in metabolic activity.
The retention of hepatocyte viability and functionality in the liver MPS for the entire period of the study (up to 7 days) was also clearly demonstrated. Specifically, at the end of the drug-metabolism study, not only were albumin and urea produced in high levels and LDH secretion was low, but these metrics were also substantially improved compared with predose (day 4) determinations. The decrease in LDH release after a few days in culture is something routinely observed in the investigated liver MPS and is due to the adaptation of the cells in the tissue culture microenvironment. Additionally, the retention of gene expression in the liver MPS was illustrated across an array of 90 different genes, including several phase I (e.g., P450s) and phase II (e.g., glutathione S-transferases) drug-metabolizing enzymes, together with a few important hepatic regulators (e.g., HNF4a) and transporters (e.g., MRP2, BSEP, NTCP. On top of that, additional confidence on the sustained functionality of the system stems from the time-dependent accumulation of drug metabolite levels across several donors/wells, whereas these levels were also highly correlated to the respective intrinsic clearance for the depletion of the parent drug.
In vitro drug-metabolism experiments using hepatocytes that are pooled across different donors (Shibata et al., 2002) have been a common practice to avoid bias arising from interdonor differences. However, the validity of such a practice has not previously been evaluated in MPS technologies. For the vast majority of 90 genes studied, the mRNA expression levels obtained from the pooled hepatocytes were not significantly different from the average mRNA expression levels obtained across the different donors. More importantly, by performing drug depletion studies in the liver MPS in both pooled hepatocytes and individual-donor hepatocytes, it was found that pooled hepatocytes can provide a relatively unbiased estimate of the average metabolic clearance in the donor population. Thus, utilization of pooled hepatocytes to study drug metabolism in the liver MPS is a reliable option as long as the determination of the associated interindividual variability is not of interest.
This study focused intensively on the investigation of interdonor variability and thus included only a small set of compounds (n = 6). For this particular set of compounds, using state-of-the-art in vitro–in vivo extrapolation methodologies, we obtained a robust correlation between clinically observed and predicted clearances; however, in absolute values, the predicted clearances were lower than those observed in vivo (average fold-error was 4.2 across all evaluated compounds). This trend of underprediction is similar to that previously observed with other traditionally used in vitro systems (Hallifax et al., 2010), and its origins remain a subject of ongoing research in the drug-metabolism field (Galetin, 2014; Bowman and Benet, 2016). Future studies with a wide and diverse set of compounds are needed to clearly evaluate liver MPS technologies with respect to their clearance prediction capabilities and develop robust empirical relationships that can be used to correct for any underprediction of the in vivo values. Finally, further work is needed on the development of mechanistic model-based methodologies to determine in vitro intrinsic clearance that are particularly focused on liver MPS technologies and their features.
In contrast to the in vitro systems traditionally used to study drug metabolism, liver MPS technologies can be integrated along with MPS of other organ systems, allowing the development of platforms where several organ modules are interacting (Stokes et al., 2015; Yu et al., 2015). The development of such physiome-on-a-chip (or human-on-a-chip) platforms is a novel and exciting research field that holds promise for significant applications in drug development (e.g., screening compounds for efficacy/toxicity) and personalized medicine (e.g., in vitro clinical trials) (Fabre et al., 2014). Since the liver MPS has a central role in these platforms, the current work provides further confidence with respect to their use in pharmacokinetic/pharmacodynamic investigations.
In summary, this is the first study that specifically focuses on the in vitro assessment of interindividual variability in drug metabolism in the context of a microphysiological system. It was clearly illustrated that interdonor differences are substantial and are manifested in multiple levels (intrinsic metabolic clearance, formation of liver-specific molecules, gene expression). Moreover, this work supports the use of modeling and simulation as an indispensable tool to analyze and translate the in vitro results emerging from such microphysiological systems to the in vivo context. Finally, the current work provides further confidence regarding the use of liver MPS technologies as an alternative for drug metabolism–related investigations.
Visual abstract. Schematic overview of the framework proposed in this work with regard to the analysis and the subsequent in vivo translation (at the population level) of the in vitro liver MPS data. See Discussion for detailed explanation.
Acknowledgments
The authors thank the members of the MIT PhysioMimetics team for the comments and discussions.
Authorship Contributions
Participated in research design: Tsamandouras, Kostrzewski, Stokes, Hughes, Cirit.
Conducted experiments: Kostrzewski.
Performed data analysis: Tsamandouras, Kostrzewski.
Wrote or contributed to the writing of the manuscript: Tsamandouras, Kostrzewski, Stokes, Griffith, Hughes, Cirit.
Footnotes
- Received August 30, 2016.
- Accepted October 17, 2016.
↵1 N.T. and T.K. contributed equally to this work.
This work was supported by the DARPA Microphysiological Systems Program [Grant W911NF-12-2-0039] and the National Institutes of Health Microphysiological Systems Program [Grant 4-UH3-TR000496-03].
↵
 This article has supplemental material available at jpet.aspetjournals.org.

Abbreviations
- CV
- coefficient of variation
- 3D
- three-dimensional
- IDV
- interdonor variability
- IWV
- interwell variability
- LDH
- lactate dehydrogenase
- MPS
- microphysiological system
- P450
- cytochrome P450
- PBPK
- physiologically based pharmacokinetic
- PCR
- polymerase chain reaction
- PT
- parallel tube
- WS
- well stirred
- Copyright © 2016 by The Author(s)
This is an open access article distributed under the CC BY-NC Attribution 4.0 International license.


