


Abstract
Future alternatives to the presently accepted in vitro paradigm of prediction of intrinsic clearance, which could be used earlier in the drug discovery process, would potentially accelerate efforts to identify better drug candidates with more favorable metabolic profiles and less likelihood of failure with regard to human pharmacokinetic attributes. In this study we describe two computational methods for modeling human microsomal and hepatocyte intrinsic clearance data derived from our laboratory and the literature, which utilize pharmacophore features or descriptors derived from molecular structure. Human microsomal intrinsic clearance data generated for 26 known therapeutic drugs were used to build computational models using commercially available software (Catalyst and Cerius2), after first converting the data to hepatocyte intrinsic clearance. The best Catalyst pharmacophore model gave an r of 0.77 for the observed versus predicted clearance. This pharmacophore was described by one hydrogen bond acceptor, two hydrophobic features, and one ring aromatic feature essential to discriminate between high and low intrinsic clearance. The Cerius2 quantitative structure activity relationship (QSAR) model gave an r2 = 0.68 for the observed versus predicted clearance and a cross-validatedr2 (q2) of 0.42. Similarly, literature data for human hepatocyte intrinsic clearance for 18 therapeutic drugs were also used to generate two separate models using the same computational approaches. The best Catalyst pharmacophore model gave an improved r of 0.87 and was described by two hydrogen bond acceptors, one hydrophobe, and 1 positive ionizable feature. The Cerius2 QSAR gave anr2 of 0.88 and aq2 of 0.79. Each of these models was then used as a test set for prediction of the intrinsic clearance data in the other data set, with variable successes. These present models represent a preliminary application of QSAR software to modeling and prediction of human in vitro intrinsic clearance.
Over the past 30 years there has been an increasing number of studies attempting to correlate human metabolic parameters in vitro with in vivo data (Baarnhielm et al., 1986; Kroemer et al., 1992; Wrighton et al., 1993, 1995; Schmider et al., 1996; Bertz and Granneman, 1997; FDA, 1997; Iwatsubo et al., 1997; Obach et al., 1997; Carlile et al., 1999). In addition, studies for drug-drug interactions are now at the stage where regulatory authorities have issued guidelines for their correct utilization (FDA, 1997, 1998). One of the most important aspects of drug metabolism that is studied in vitro with human hepatic microsomes, hepatocytes, or liver slices is the projection of intrinsic clearance, which can then be extrapolated to in vivo studies. This concept has been widely demonstrated (Hoener, 1994), along with the favorable prediction of human clearance from in vitro intrinsic clearance data (Iwatsubo et al., 1997; Obach et al., 1997). Intrinsic clearance represents a measure of the enzyme activity toward a compound. However, one of the obvious disadvantages of using human tissue, particularly hepatocytes, slices, or microsomes, is the need for reliable storage and continual supply. In addition, the stability of metabolic capability with these human in vitro systems is also a concern (VandenBranden et al., 1998), as well as the interindividual differences in expression of drug-metabolizing enzymes (Wrighton et al., 1993, 1995). This variability would affect the reproducibility of the technique and comparisons if different donor sources of tissue were used over time. The tissue quality may also impact these comparisons, because it is already appreciated that metabolic clearance for some compounds may be dramatically different in healthy and compromised livers (Furlan et al., 1999).
Therefore, an alternative means of predicting in vivo clearance needs to be identified to enable comparison of data not only within the same laboratory but across laboratories for future years. Recent work byLave et al. (1997) has shown that in vitro clearances in human hepatocytes are predictive for human hepatic extraction ratios in humans in vivo. Compounds were also classified into high, intermediate or low hepatic extraction, and by so doing this formed boundary intrinsic clearance values for each zone. These cutoffs were <0.9 μl/min/106 cells as low, >0.9 to <5 μl/min/106 cells as intermediate, and >5 μl/min/106 cells as high clearance compounds.
The utility of predicting hepatic clearance in a drug discovery setting is that a measure of likely drug performance is obtained that could be reliably scaled to humans. A measure of clearance would be indicative of elimination half-life that would naturally be of value for selecting candidates with the optimal dosing regimen for patient compliance, such as once daily dosing. The recent use of commercially available computational three-dimensional quantitative structure activity relationship (3D-QSAR) software (Catalyst) to predict theKm (apparent) orKi (apparent) for cytochrome P450 (CYPs) (Ekins et al., 1999a–d) indicated the possibility of using this same approach for modeling in vitro derived intrinsic clearance data. The potential of a reliable computational screen for use in predicting clearance parameters would be enormously beneficial, because it would decrease the extent of applications of human hepatic microsomal studies used in this area. This would ultimately reduce the inconsistency observed when transferring from one lot of human tissue to another caused by the different levels of enzymes present. As the majority of publications to date use extrapolations from in vitro to in vivo, it is feasible that a computational model predicting clearance parameters in vitro could also be used to extrapolate to clearance in vivo. To our knowledge, there are no computational models of human in vitro derived intrinsic clearance data that have been used prospectively for predictions. One recent study has, however, used a comparative molecular field analysis (CoMFA) to model rodent clearance when exposed using the closed atmosphere gas uptake exposure technique to a series of chlorinated volatile organic compounds (Waller et al., 1996). The best CoMFA model in this published case was obtained from a combination of steric, electrostatic, LUMO (Lowest Unoccupied Molecular Orbital) and HINT (Hydropathic INTeractions) fields (Waller et al., 1996). In our present study we have compared intrinsic clearance data obtained from human liver microsomes for 26 therapeutic drugs scaled up to hepatocyte clearance and contrasted it to literature data for hepatocyte clearance obtained for 18 compounds. Using the 3D-QSAR pharmacophore-based approach (Catalyst) and a descriptor-based 3D-QSAR (Cerius2), we were able to construct multiple models to attempt to classify drugs with high, intermediate, or low clearance.
Materials and Methods
Calculations.
In vitro data for commercially available compounds was obtained from two previous publications in which the respective experimental procedures are defined (Lave et al., 1997;Obach, 1999). Microsomal intrinsic clearance values in our study (Obach, 1999) were converted from ml/min/kg units to hepatocyte clearance units of μl/min/million cells (Table1). This was based on the assumption that there is 20 g of liver per kg in humans (Bayliss et al., 1990) and that there are 120 million hepatocytes/g of liver. Both sets of intrinsic clearance data were then inverse-transformed to convert a high clearance number to a low number (high affinity for clearance) for use with Catalyst. To enable model construction with Cerius2 QSAR, these data were further log-transformed.
Microsomal and hepatocyte in vitro intrinsic clearance values for the 29 drugs examined (Obach, 1999)
Molecular Modeling.
The computational molecular modeling studies were carried out using a Silicon Graphics Octane workstation and based on a methodology previously described for modelingKM, Ki, and IC50 values for CYPs (Ekins et al., 1999a–d).
Modeling with Catalyst.
The 3D structures of the molecules under study were built interactively using Catalyst version 4.0 (Molecular Simulations, San Diego, CA). Two training sets were used for model construction (Tables 1 and 2). One consisted of 26 of 29 molecules derived from our experiments (Obach, 1999). The second contained 18 molecules obtained from the literature (Lave et al., 1997; Ro-40-5967 was not used in this present study). The number of conformers generated for each molecule was limited to a maximum of 255 with an energy range of 20 kcal/mol. Ten hypotheses were generated using these conformers for each of the molecules and 1/intrinsic clearance values generated after selection of the following features for the drugs; hydrogen bond donor, hydrogen bond acceptor, hydrophobic, and ring aromatic. After assessing all 10 hypotheses generated for each data set, the lowest energy cost hypothesis was considered the best.
Hepatocyte in vitro intrinsic clearance values for the 18 drugs examined (Lave et al., 1997)
The goodness of the structure activity correlation was estimated by means of the correlation coefficient (r). Catalyst also calculates the total energy cost of the generated pharmacophores from the deviation between the estimated activity and the observed activity, combined with the complexity of the hypothesis (i.e., the number of pharmacophore features). A null hypothesis was additionally calculated, which presumes that there is no relationship in the data and that experimental activities are normally distributed about their mean. Hence, the greater the difference between the energy cost of the generated hypothesis and the energy cost of the null hypothesis, the less likely it is that the hypothesis reflects a chance correlation. This criterion is then used as an assessment of the pharmacophore model selected.
Catalyst Pharmacophore Validation Using Permuting of Activity Data.
The statistical significance of the pharmacophore hypotheses generated for both data sets utilized was tested by permuting (randomizing) the structures and the activities 10 times and then repeating the Catalyst hypothesis generation procedure.
Modeling with Cerius2.
The training set molecules for our data (n = 26 molecules, Table 1) were aligned in Catalyst on the best hypothesis for each data set then imported into Cerius2. Descriptors (including 3D descriptors such as Jurs and Shadow indices) were generated in the 3D-QSAR functionality. 1/hepatocyte intrinsic clearance values were log-transformed and added to the study table. An equation was generated using the genetic function approximation to select descriptors that related to the log 1/hepatocyte intrinsic clearance. This process was repeated for the other published data set (n = 18 molecules, Table 2).
Testing Catalyst and Cerius2 Models.
To test the predictive nature of the models, we used each data set as the test set for the other. For testing the Catalyst models the test molecules were fitted to the pharmacophore by subjecting them to the fast-fit algorithm to predict a 1/hepatocyte intrinsic clearance value. Fast fit refers to the method of finding the optimum fit of the inhibitor to the hypothesis among all the conformers of the molecule without performing an energy minimization on the conformers of the molecule (Catalyst tutorials release 3.0; MSI, San Diego, CA). These predictions were then log-transformed and compared with the log observed in vitro values. This process was repeated with the opposing test and training set. For testing the Cerius2 models, the descriptors indicated by the genetic function algorithm analyses were used to generate predicted log 1/hepatocyte intrinsic clearance values, which were then in turn compared with the log observed in vitro values. The small test set of three molecules was also treated similarly to generate predictions for intrinsic clearance.
Modeling with Neuroshell Predictor.
The descriptors found to be significant for each data set using the Cerius2 QSAR function were then used along with the activity values to train a neural network using Neuroshell Predictor Software (Ward Systems Group, Inc., Frederick, MD). Once trained with each data set, the models were used to predict the other data set.
Results
Catalyst Pharmacophore Models of Hepatocyte Intrinsic Clearance.
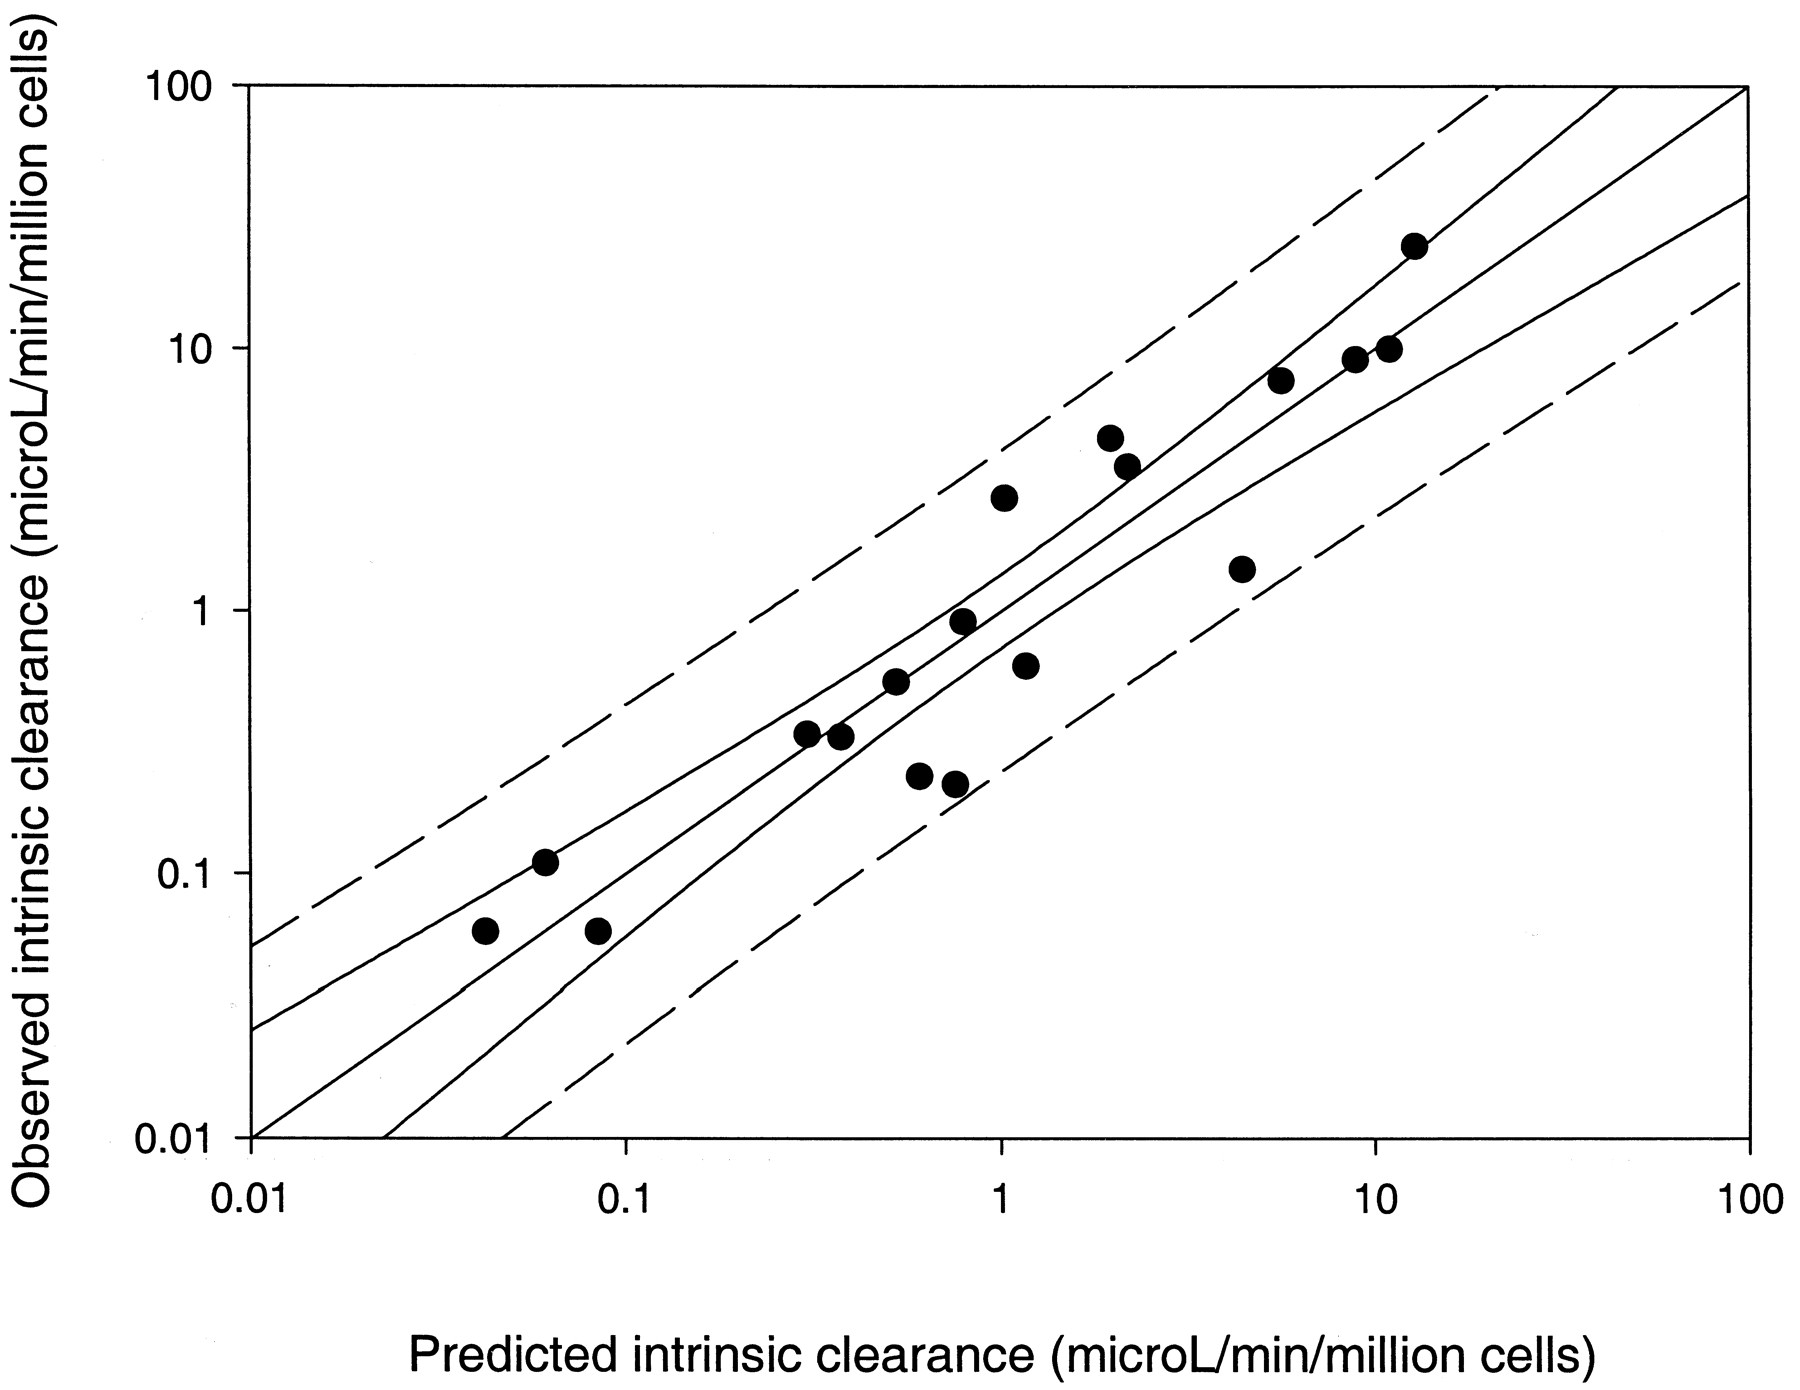
Catalyst uses a collection of molecules with activity spanning orders of magnitude to construct a useful model of the chemical features and their position in 3D space necessary for a biological response. In this study Catalyst was used to model hepatocyte intrinsic clearance values after conversion to enable a low clearance compound to have a high number and the high clearance compounds to have low numbers. This procedure is necessary for this software, because it relies on small numbers, which it equates with being active, and conversely, larger numbers being less active. The first model of our 26-molecule data set contained data over 2 orders of magnitude (Table 1) and produced a good correlation when compared with the estimated 1/hepatocyte intrinsic clearance (r of 0.77, Fig. 1). The lowest energy pharmacophore used to generate these estimates for the training set contained four features necessary for clearance, namely two hydrophobes, a hydrogen bond acceptor, and a ring aromatic feature (Fig.2). Previously published data from another group was also a useful source for modeling intrinsic clearance. Literature hepatocyte clearance values also covering greater than two orders of magnitude (Table 2) produced a greatly improved correlation when compared with the estimated 1/hepatocyte intrinsic clearance (r of 0.87, Fig. 3). The lowest energy pharmacophore used to generate these estimates for the literature training set also contained four features necessary for clearance, namely two hydrogen bond acceptors, a hydrophobe, and a positive ionizable feature (Fig. 4).

Correlation of Catalyst-produced predicted 1/hepatocyte intrinsic clearance values with the observed 1/hepatocyte intrinsic clearance values for the 26-molecule training set (seeMaterials and Methods). The central line corresponds to the regression for the data, the solid lines represent the 95% confidence interval for the regression, and the outer dashed lines represent the 95% confidence interval for the population.

The Catalyst-produced 26-molecule 1/hepatocyte intrinsic clearance pharmacophore (see Materials and Methods) illustrating two hydrophobic areas (cyan), a hydrogen bond acceptor (green), with a vector in the direction of the putative hydrogen bond, and a ring aromatic feature (orange). The inter-bond angles and the distance between features are also annotated.

Correlation of Catalyst-produced predicted 1/hepatocyte intrinsic clearance values with the observed 1/hepatocyte intrinsic clearance values for the 18-molecule training set (seeMaterials and Methods). The central line corresponds to the regression for the data, the solid lines represent the 95% confidence interval for the regression, and the outer dashed lines represent the 95% confidence interval for the population.

The Catalyst-produced, literature-derived, 18-molecule 1/hepatocyte intrinsic clearance pharmacophore (seeMaterials and Methods) illustrating one hydrophobic area (cyan), two hydrogen bond acceptors (green) with vectors in the direction of the putative hydrogen bonds, and a positive ionizable feature (red). The inter-bond angles and the distance between features are also annotated.
Catalyst Pharmacophore Validation Using Permuting of Activity Data.
Upon permuting our data set of 26 molecules (Obach, 1999) on 10 occasions, only one hypothesis generation resulted in a model withr = 0.52. Therefore, over the 10 attempts following permuting, the mean r value was 0.052. After permutation of the 18-molecule data set (Lave et al., 1997) used to produce a Catalyst pharmacophore, the result was a mean r value of 0.61 for 10 attempts. These r values are lower than those described above for their respective corresponding models (r = 0.77 and r = 0.87, respectively), suggesting the pharmacophores may be acceptable using this validation technique.
Catalyst Hepatocyte Intrinsic Clearance Pharmacophore Validation Using Test Sets.
After construction of each of the respective catalyst 3D-QSAR models for hepatocyte intrinsic clearance data, the other training set was used as a test set (e.g., the model fromn = 26 compounds used the published data set (n = 18) as the test set and vice versa). Our model for 26 compounds predicted the hepatocyte intrinsic clearance for most of the test set molecules with a number that were clearly overpredicted, including bosentan, naloxone,N-methyl-d-aspartate, antipyrine, and lorazepam (Fig. 5). The number of molecules predicted within a 1 log residual (10-fold) was 12 of 18, representing 66.6%. The model derived from the published data set of 18 compounds was used to predict the 26-compound test set resulting in many that were overpredicted, including verapamil, diclofenac, methoxsalen, lorcainide, amitriptyline, and imipramine (Fig.6). The number of molecules predicted within a 1 log residual was 13 of 26, representing 50%.

Correlation for the literature derived test set (n = 18 molecules) of the predicted 1/hepatocyte intrinsic clearance values with the observed 1/hepatocyte intrinsic clearance values using the 26-compound Catalyst-produced model (seeMaterials and Methods). The central line represents unity; the outer lines define the 1 log residual boundary.

Correlation for the test set (n = 26 molecules) of the predicted 1/hepatocyte intrinsic clearance values with the observed 1/hepatocyte intrinsic clearance values using the 18-compound Catalyst-produced model (see Materials and Methods). The central line represents unity; the outer lines define the 1 log residual boundary.
As a second test set of three molecules (prednisone, alprazolam, and ibuprofen) were held out from our previously published data set of 29 molecules (Obach, 1999). These were used primarily to assess the predictive nature of the 26-molecule training set, where intrinsic clearance values were calculated under the same experimental conditions. In addition, this test set was used along with the models derived from the 18-molecule training set. The 26-molecule training set was able to differentiate between the two higher clearance compounds and the lowest clearance compound (Table3). However, the predicted clearance values were considerably higher than those observed, with the value for prednisone being above the 1 log residual cutoff. The 18-molecule training set was less successful in separating high from low clearance values but was able to produce closer predictions for prednisone and alprazolam. In this case, ibuprofen was poorly predicted with a residual above the 1 log unit cutoff.
Observed and predicted CLint for molecules fit to Catalyst and Cerius2 models
Cerius2 3D-QSAR Models of Hepatocyte Intrinsic Clearance.
Cerius2 is used to generate multiple molecular descriptors for a collection of molecules with activity spanning orders of magnitude. The genetic function approximation was then used to find the most important descriptors related to the activity, to produce an equation to predict hepatocyte intrinsic clearance. The 1/observed hepatocyte intrinsic clearance values for the training sets were log-converted as required by Cerius2. Our 26-molecule training set then produced the following QSAR model:

Correlation of Cerius2-produced estimated 1/hepatocyte intrinsic clearance values with the observed 1/hepatocyte intrinsic clearance values for the 26-compound training set (see Materials and Methods). The central line corresponds to the regression for the data, the solid lines represent the 95% confidence interval for the regression, and the outer dashed lines represent the 95% confidence interval for the population.
Correlation of Cerius2-produced estimated 1/hepatocyte intrinsic clearance values with the observed 1/hepatocyte intrinsic clearance values for the 18-compound training set (see Materials and Methods). The central line corresponds to the regression for the data, the solid lines represent the 95% confidence interval for the regression, and the outer dashed lines represent the 95% confidence interval for the population.
Cerius2 Hepatocyte Intrinsic Clearance 3D-QSAR Model Validation Using a Test Set.
After construction of each of the respective Cerius2 3D-QSAR models for hepatocyte intrinsic clearance data, the other training set was used as a test set as previously described for Catalyst models. Our model for 26 compounds was used to predict the hepatocyte intrinsic clearance for the test set molecules. There was no clearly visible relationship for this model, and it overpredicted intrinsic clearance values for bosentan, lorazepam, remikiren, Ro-48-6791, Ro-48-8684, and warfarin (Fig.9). The number of molecules predicted within a 1 log residual was 11 of 18, representing 61.1%. The model derived from the published data set of 18 compounds appeared to offer more realistic predictions for the 26-compound test set, although there were a number of compounds that were underpredicted such as methoxsalen, tenidap, diclofenac, verapamil, and midazolam or overpredicted like amobarbital (Fig.10). The number of molecules predicted within a 1 log residual was 17 of 26, representing 65%.

Correlation for the literature derived test set (n = 18 molecules) of the predicted 1/hepatocyte intrinsic clearance values with the observed 1/hepatocyte intrinsic clearance values using the 26-compound Cerius2-produced model (see Materials and Methods). The central line represents unity; the outer lines define the 1 log residual boundary.

Correlation for the test set (n = 26 molecules) of the predicted 1/hepatocyte intrinsic clearance values with the observed 1/hepatocyte intrinsic clearance values using the 18-compound Cerius2-produced model (seeMaterials and Methods). The central line represents unity; the outer lines define the 1 log residual boundary.
The second test set of three molecules was also used to assess the predictive nature of the Cerius2 QSAR derived from the 26-molecule training set. This model was unable to differentiate between the two intermediate clearance compounds and the lowest clearance compound (Table 3) and poorly predicted alprazolam. The 18-molecule training set was also unsuccessful in separating intermediate from low clearance values and poorly predicted ibuprofen.
Modeling with Neuroshell Predictor.
Our intrinsic clearance data set and descriptors obtained from Cerius2, described above, were used to produce an observed versus predicted correlation r2 value of 0.82. The data from another published study (Lave et al., 1997) along with the descriptors selected from Cerius2 described above, produced an observed versus predicted correlationr2 value of 0.93. When opposing data sets were used as test sets for these trained models, the predicted hepatocyte intrinsic clearance values were not markedly improved over the Cerius2 models (data not shown).
Discussion
As suggested by many investigators, it is likely that methods to reliably predict clearance in humans would enhance drug discovery and development processes (Lave et al., 1997) if implemented earlier. Although much of the work using in vitro drug metabolism data to predict in vivo metabolic clearance has centered around studies with rodents [as reviewed by Houston (1994)], recently more studies have been described using human in vivo and in vitro data (Hoener, 1994;Iwatsubo et al., 1996; Iwatsubo et al., 1997; Lave et al., 1997; Obach et al., 1997). The human in vitro data has either been generated using microsomes (Hoener, 1994; Iwatsubo et al., 1997; Obach et al., 1997) or hepatocytes (Lave et al., 1997). When known selective substrates for specific CYPs are utilized in vivo and in microsomes in vitro (Hoener, 1994), intrinsic clearance data can then be assumed to relate to a single CYP. Others have suggested that recombinant CYPs would also provide a basis to predict metabolic clearance after utilizing a P450 content correcting factor (Iwatsubo et al., 1997). Using recombinant enzymes would also enable all likely CYPs to be studied, because a specific lot of human liver microsomes may not have the optimal or average content of each CYP known to be present within the population. Naturally, using microsomes discounts the involvement of many other enzymes in the clearance process for a given drug and may not give accurate predictions for in vivo studies. Therefore, human hepatocytes can be used to generate intrinsic clearance data, because they will allow the phase 1 and 2 processes to be studied simultaneously (Lave et al., 1997). The disadvantages of using human hepatocytes for clearance studies include their need for enzyme characterization and viability assessment before use, as well as the variability in successful culture and long-term storage. A second whole cell approach that has infrequently been used to calculate intrinsic clearance is the use of human liver slices (Ekins, 1996). This lack of use of this approach is partially due to the observation in rat that clearance for many compounds is lower than in hepatocytes (Worboys et al., 1995), which may result from restricted drug uptake in slices (Ekins et al., 1995;Olinga, 1996). However, it is uncertain whether this is also the case in general for human liver slices, because there have been few published studies where human liver slices have been compared with human hepatocytes or microsomes used to generate intrinsic clearance data (Vickers et al., 1993).
In the present study we have used human liver microsomal intrinsic clearance data for 29 molecules, which had been converted to hepatocyte intrinsic clearance values using accepted values for the amount of liver per kg of body weight and an estimate of the number of hepatocytes per gram of human liver. Three of these 29 molecules were held out from the training set (26 molecules) and used as a test set to evaluate the models. In addition, we used a published data set of 18 molecules with human hepatocyte clearance values. Between these two sets of data there were four common molecules that were ranked identically in terms of intrinsic clearance; midazolam > diltiazem > diazepam > warfarin. Both data sets were used to generate 3D-QSAR models, which were then used to predict in vitro intrinsic clearance in silico. The first technique generated pharmacophores that are essentially the chemical features found to be essential to explain the intrinsic clearance values. If a molecule does not possess one or more of these features, it is likely to have a lower hepatocyte intrinsic clearance. Both sets of molecules, when used as separate training sets, produced acceptable pharmacophores that could explain the data (Figs. 1 and 3). These pharmacophores contained a different arrangement and number of each of the features, with only hydrophobic and hydrogen bond acceptor features being common to both (Figs. 2 and 4). However, when test sets were constructed from the opposing training set, there was mixed success in predictions (Figs. 5and 6). It would appear that, although the 26-compound training set model contains a smaller range of hepatocyte intrinsic clearance values, it is superior at predicting the hepatocyte intrinsic clearance of molecules excluded from the model when compared with the 18-molecule training set pharmacophore (which seemed to overpredict mainly basic compounds). A measure of predictive ability to score the models was used, namely, the percentage of molecules predicted within 1 log residual. The n = 26 model predicts the highest percentage of molecules within the 1 log residual. The validity of these Catalyst pharmacophores was also assessed by permuting the structures with activities. This showed that the correlation coefficient decreased for the pharmacophores, indicative of the statistical importance of the initial pharmacophores generated for each data set. Interestingly, the n = 26 model appeared more significant as 9 out of 10 permuting attempts could not produce pharmacophores.
An alternative 3D-QSAR technique, Cerius2 was used to generate multiple electronic, thermodynamic, structural, topological, and conformational descriptors. This technique generates far more information for the molecules in the training set than Catalyst, which purely relies on chemical descriptors like hydrogen bond acceptors or donors. Once again, both sets of molecules were used as separate training sets to produce QSARs that could explain the intrinsic clearance data (Figs. 7 and 8). Cerius2QSAR also provides a means of internal validation using the leave-one-out technique (q2) for the QSARs selected by the genetic function approximation in this case. In both cases the QSARs generated produced significantq2 values of 0.42 and 0.79 for the 26- and 18-molecule data sets, respectively, which is indicative of internal consistency. In addition, there was mixed success in predicting the respective test set (Figs. 9 and 10), although the 18-molecule training set, as one would expect from the superiorq2, provided more realistic predictions even though acidic compounds proved most problematic. Interestingly, both models appeared to poorly predict at least one of the four common molecules described earlier. Using the method of assessing predictive ability described previously, then = 18 Cerius2 model predicted the highest percentage of molecules within the 1 log residual. The test set of three molecules with intrinsic clearance data generated in our laboratory was used to further test the models generated from both training sets. On the whole, two out of three molecules were predicted within a 1 log residual arbitrary cutoff. Only the Catalyst pharmacophore derived from 26 molecules was able to correctly differentiate the intermediate from lowest intrinsic clearance compounds, although the predictions were not as close as derived from other models. Interestingly, the Catalyst model from the 18-molecule training set was very successful in predicting intrinsic clearance values for prednisone and alprazolam (Table 3). The Cerius2 models were unsuccessful in classifying this test set.
Even though the plots of test set predictions (Figs. 5, 6, 9, and 10) do not provide an exact 1:1 correspondence, in some cases they may illustrate a potential for approximate rank ordering of compounds based on predicted hepatocyte intrinsic clearance. Alternatively, by using the cutoffs for low (<0.9 μl/min/106 cells), intermediate (>0.9 to <5 μl/min/106 cells), and high (>5 μl/min/106 cells) intrinsic clearance, these computational models may also have utility in predicting this parameter.
We believe that this study clearly represents a preliminary attempt at the computational prediction of intrinsic clearance based on molecular structure and expect that the future training sets will need to iteratively improve to reduce the number of predictions 10-fold higher than observed. To some extent we expect some difficulty in modeling a complex parameter such as intrinsic clearance, which is a hybrid of a rate and binding function. Previous successful models of drug-metabolizing enzymes only modeled or approximated the binding function (Ekins et al., 1999a–d). Furthermore, the two data sets used in this study represent molecules cleared by different enzymes in humans, unlike the previous CoMFA study of CYP2B1/2E1 clearance of essentially similar compounds in rodents (Waller et al., 1996). Also it is important to consider that the human liver microsomal data are simplistic in that they do not take account of potential molecules that are mainly cleared by phase 2 metabolism. Future models will need to balance not only neutral, acidic, and basic compounds but also those cleared by differing phase 1 and phase 2 enzymes. An early attempt at this involved the combination of both the n = 18 andn = 26 data sets to generate a single Cerius2 QSAR. This did not produce significant improvements in either the correlationr2 (0.579) or upon cross-validation to give a q2 (0.452). Future attempts in this direction may require a larger more structurally diverse data set for human intrinsic clearance than either described in this or previous studies. We believe the present approaches presented in this study are only partially satisfactory and may improve upon utilization of more complex algorithms.
In conclusion, we have shown that various preliminary 3D-QSAR models can be generated from human in vitro intrinsic clearance data and that these models could be used to classify molecules excluded from the training sets as likely to demonstrate low, intermediate, or high clearance. This would naturally be a very useful tool for virtual drug discovery, once the models were suitably refined to account for some of the poor predictions described herein. The present models also represent what appears to be a preliminary assessment of the utility of computational modeling approaches to predicting this pharmacokinetic parameter, which is scalable to the in vivo situation. Considerable optimization of these models will be needed, if we are to reach the 2-fold error cutoff observed with in vitro-in vivo comparisons of clearance (Obach et al., 1997). In the future, modeling of further important metabolic and pharmacokinetic parameters in silico may be attempted using similar approaches to those described in this study. These approaches can also be tested using in vitro data and, hence, represent a new paradigm in this field (Ekins et al., 2000).
Note Added in Review.
While this paper was in review the authors became aware of a more recent publication by Schneider et al. (1999), which used artificial neural networks and multivariate statistical techniques to model the previously published Lave et al. (1997) intrinsic clearance data.
Acknowledgments
The authors gratefully acknowledge Dr. Susan Gustafson, John Ohrn (Molecular Simulations Inc.) for software support and Carmen Grillo (Pfizer Inc.) for UNIX support.
Footnotes
-
Send reprint requests to: Sean Ekins, Ph.D., Lilly Research Laboratories, Eli Lilly and Co., Lilly Corporate Center, Drop Code 0730, Indianapolis, IN 46285. E-mail:ekins_sean{at}lilly.com
-
↵1 Present address: Lilly Research Laboratories, Eli Lilly and Co., Lilly Corporate Center, Drop Code 0730, Indianapolis, IN 46285.
- Abbreviations:
- 3D-QSAR
- three-dimensional quantitative structure activity relationship
- CYP
- cytochrome P450
- CoMFA
- comparative molecular field analysis
- CLint
- intrinsic clearance
- Received April 13, 2000.
- Accepted July 20, 2000.
- The American Society for Pharmacology and Experimental Therapeutics


