


Abstract
In the studies reported here, the ability of atomoxetine hydrochloride (Strattera) to inhibit or induce the metabolic capabilities of selected human isoforms of cytochrome P450 was evaluated. Initially, the potential of atomoxetine and its two metabolites, N-desmethylatomoxetine and 4-hydroxyatomoxetine, to inhibit the metabolism of probe substrates for CYP1A2, CYP2C9, CYP2D6, and CYP3A was evaluated in human hepatic microsomes. Although little inhibition of CYP1A2 and CYP2C9 activity was observed, inhibition was predicted for CYP3A (56% predicted inhibition) and CYP2D6 (60% predicted inhibition) at concentrations representative of high therapeutic doses of atomoxetine. The ability of atomoxetine to induce the catalytic activities of CYP1A2 and CYP3A in human hepatocytes was also evaluated; however, atomoxetine did not induce either isoenzyme. Based on the potential of interaction from the in vitro experiments, drug interaction studies in healthy subjects were conducted using probe substrates for CYP2D6 (desipramine) in CYP2D6 extensive metabolizer subjects and CYP3A (midazolam) in CYP2D6 poor metabolizer subjects. Single-dose pharmacokinetic parameters of desipramine (single dose of 50 mg) were not altered when coadministered with atomoxetine (40 or 60 mg b.i.d. for 13 days). Only modest changes (approximately 16%) were observed in the plasma pharmacokinetics of midazolam (single dose of 5 mg) when coadministered with atomoxetine (60 mg b.i.d. for 12 days). Although at high therapeutic doses of atomoxetine inhibition of CYP2D6 and CYP3A was predicted, definitive in vivo studies clearly indicate that atomoxetine administration with substrates of CYP2D6 and CYP3A does not result in clinically significant drug interactions.
Atomoxetine hydrochloride (Strattera; formerly known as tomoxetine hydrochloride) is known chemically as (–)-N-methyl-3-phenyl-3-(o-tolyloxy)-propylamine hydrochloride. Atomoxetine is a potent inhibitor of the presynaptic norepinephrine transporter with minimal affinity for other monoamine transporters or receptors (Wong et al., 1982; Gehlert et al., 1993) and is used clinically for the treatment of attention-deficit/hyperactivity disorder in children, adolescents, and adults.
Atomoxetine is rapidly and completely absorbed after oral administration (Sauer et al., 2003). The plasma pharmacokinetics of atomoxetine are linear over the recommended therapeutic dosing range (0.5–1.4 mg/kg) with proportional increases in both mean atomoxetine maximum plasma concentration (Cmax) and area under the plasma concentration time curve (AUC) with increasing dose (Witcher et al., 2003). Atomoxetine is predominantly metabolized by CYP2D6 (Ring et al., 2002); therefore, its pharmacokinetics and metabolism are influenced by the polymorphic expression of this enzyme (Farid et al., 1985; Sauer et al., 2003). As a result, the systemic clearance values of atomoxetine seem to be distributed in a bimodal manner. The enzymatic activity of CYP2D6 is regulated by a genetic polymorphism resulting in two major populations of individuals with either active metabolic capabilities (CYP2D6 extensive metabolizers, EM) or poor metabolic capabilities (CYP2D6 poor metabolizers, PM) (Evans et al., 1980; Steiner et al., 1988).
To understand the potential for atomoxetine to inhibit the metabolism of concomitantly administered drugs, the ability of atomoxetine and its primary oxidative metabolites (Sauer et al., 2003) N-desmethylatomoxetine and 4-hydroxyatomoxetine (Fig. 1) to inhibit the metabolism of probe substrates for CYP1A2, CYP2C9, CYP2D6, and CYP3A was evaluated in human hepatic microsomes. Furthermore, the potential for atomoxetine to induce CYP1A2 and CYP3A activity in human hepatocytes was assessed. Based on the findings of the in vitro studies, studies in healthy subjects were conducted using selective probe substrates for CYP2D6 and CYP3A.

Chemical structures of atomoxetine and its primary oxidative metabolites 4-hydroxyatomoxetine and N-desmethylatomoxetine.
Materials and Methods
Reference Compounds and Other Materials
The following compounds were synthesized at Lilly Research Laboratories: atomoxetine hydrochloride, (Strattera; LY139603; (–)-N-methyl-3-phenyl-3-(o-tolyloxy)-propylamine hydrochloride), 2H7-atomoxetine, N-desmethylatomoxetine hydrochloride [(–)-3-phenyl-3-(o-tolyloxy)-propylamine hydrochloride], 4-hydroxyatomoxetine oxalate [(–)-N-methyl-3-phenyl-3-(o-tolyloxy-4-hydroxy)-propylamine oxalate], and 2H5-4-hydroxyatomoxetine oxalate.
Midazolam was obtained from F. Hoffmann-La Roche (Nutley, NJ) and 4′-hydroxy diclofenac was obtained from BD Gentest (Woburn, MA). Bufuralol, 1′-hydroxy bufuralol, and 1′-hydroxy midazolam were purchased from Ultrafine (Manchester, UK). Acetaminophen was obtained from Eastman Kodak (Rochester, NY). Diclofenac, phenacetin, NADPH, rifampicin, 3-methylcholanthrene, and salicylamide were purchased from Sigma-Aldrich (St. Louis, MO). Resorufin and 7-ethoxyresorufin were obtained from Molecular Probes (Eugene, OR). Hepatocyte maintenance medium (HMM), gentamicin, and amphotericin B were purchased from Cambrex Bio Science Walkersville, Inc. (Walkersville, MD).
In Vitro Inhibition Studies
Human liver samples were obtained from the liver transplant unit at the Medical College of Wisconsin (Milwaukee, WI) and Indiana University School of Medicine (Indianapolis, IN) under protocols approved by the appropriate committee for the conduct of human research. Microsomes were prepared by differential centrifugation (van der Hoeven and Coon, 1974).
For the evaluation of CYP1A2, 2C9, 3A, and 2D6 activity in human microsomes, preparations were preincubated for 3 min at 37°C before the initiation of the reaction with NADPH. The amount of organic solvent in the preparations was less than 2% of the incubation volume. The reactions were stopped with the addition of an equal volume of solvent (CYP1A2, 2C9, and 3A) or 7.5 of a 60% perchloric acid solution (CYP2D6).
O-Deethylation of Phenacetin (CYP1A2). Incubations contained human liver microsomes (0.5 mg/ml protein) in 100 mM sodium phosphate buffer (pH 7.4), 1 mM NADPH, and phenacetin (12.5, 25, 50, 75, or 100 μM), in the absence or presence of atomoxetine (10, 200, 500, or 800 μM), N-desmethylatomoxetine (50, 100, 250, or 500 μM) or 4-hydroxyatomoxetine (0.5, 1.0, 10, 25, 50, 100, 250, or 500 μM) as inhibitor. After 30-min incubations (linear rate conditions) at 37°C, samples were analyzed for formation of acetaminophen (Ring et al., 2001).
4′-Hydroxylation of Diclofenac (CYP2C9). Incubations contained human liver microsomes (0.25 mg/ml protein) in 100 mM sodium phosphate buffer (pH 7.4), 1 mM NADPH, and diclofenac (2.5, 5, 10, 25, or 50 μM), in the absence or presence of atomoxetine (10, 100, 200, 500, or 800 μM), N-desmethylatomoxetine (25, 50, 100, or 250 μM), or 4-hydroxyatomoxetine (0.5, 1.0, 10, 25, 50, 100, 250, or 500 μM) as inhibitor. After 15-min incubations (linear rate conditions) at 37°C, samples were analyzed for the formation of 4′-hydroxy diclofenac (Ring et al., 2001).
1′-Hydroxylation of Bufuralol (CYP2D6). Incubations contained human liver microsomes (0.1 mg/ml protein) in 100 mM sodium phosphate buffer (pH 7.4), 1 mM NADPH, and bufuralol (5, 10, 25, 50, or 100 μM), in the absence or presence of atomoxetine (3.75, 7.5, 15, or 25 μM), N-desmethylatomoxetine (1, 5, 10, or 20 μM) or 4-hydroxyatomoxetine (5, 10, 25, or 50 μM) as inhibitor. After 30-min incubations (linear rate conditions) at 37°C, samples were analyzed for the formation of 1′-hydroxy bufuralol (Ring et al., 1996).
1′-Hydroxylation of Midazolam (CYP3A). Incubations contained human liver microsomes (0.5 mg/ml protein) in 100 mM sodium phosphate buffer (pH 7.4), 1 mM NADPH, and midazolam (5, 10, 25, 50, or 100 μM) in the absence or presence of atomoxetine (25, 50, 75, or 100 μM), N-desmethylatomoxetine (1, 10, 25, or 50 μM), or 4-hydroxyatomoxetine (25, 75, 250, or 500 μM) as inhibitor. After 1-min incubations (linear rate conditions) at 37°C, samples were analyzed for the formation of 1′-hydroxy midazolam (Ring et al., 2001).
In Vitro Induction Studies
Hepatocytes were isolated from three donors and were cultured as described by Strom et al. (1996). Hepatocyte monolayers in six-well culture plates (seeded with approximately 1 million cells/well) were incubated with 0.01, 0.1, 1, 10, or 100 μM atomoxetine in HMM supplemented with 100 nM insulin, 100 nM dexamethasone, 50 μg/ml gentamicin, and 50 ng/ml amphotericin B for approximately 48 h in triplicate wells. The concentrations of atomoxetine used in the induction experiments overlap the plasma concentrations of atomoxetine observed after repeated oral administration (Table 1). Cells were also incubated with 0.1% dimethyl sulfoxide (vehicle control), 1 μg/ml 3-methylcholanthrene (CYP1A2 induction control), and 10 μM rifampicin (CYP3A induction control). After the incubation, the cells were washed and then preincubated with 3 mM salicylamide, which was used to inhibit metabolite conjugation, for 10 min. Assessment of CYP1A2 and CYP3A activity was then performed with 2 μM 7-ethoxyresorufin or 10 μM midazolam, respectively, in HMM containing 3 mM salicylamide (7-ethoxyresorufin incubations only) for 30 min. Samples were analyzed using a reverse-phase liquid chromatography/mass spectrometry method for formation of 1′-hydroxymidazolam (Wrighton and Ring, 1994) or resorufin (Burke and Mayer, 1983). Cells were harvested by scraping in 0.5 ml of 100 mM potassium phosphate buffer (pH 7.4), and protein content was determined by the method of Lowry et al. (1951).
Estimated maximal plasma concentrations of atomoxetine and its metabolites in CYP2D6 extensive and poor metabolizer populations following 1.0 mg/kg twice-daily doses (2.0 mg/kg/day) of atomoxetine hydrochloride
To evaluate statistical significance among the treatment groups, single-factor analysis of variance was performed. Treatment groups, including the positive control were compared with the vehicle-treated control, and all groups consisted of three replicate wells. For CYP3A activity, the samples from each of the three wells were analyzed in duplicate, whereas for CYP1A2 activities the samples from each of the three wells were analyzed by a single determination.
In Vitro Prediction Strategy
Apparent kinetic parameters of Km, Vmax, and Ki, as well as the standard error of the estimated parameter were determined after the fit of the data to conventional inhibition (competitive or mixed competitive/noncompetitive) relationships (Segel, 1975) using WinNonlin Professional version 2.1 (Pharsight, Mountain View, CA) as described in detail by Ring et al. (1996). These data were used to guide the choice of in vivo drug-drug interaction studies by predicting the possible effect of atomoxetine on the metabolism of coadministered drugs that are substrates of these cytochromes P450. The relationship (I/(I + Ki)) × 100 was used to calculate an estimate of expected percentage of inhibition (Segel, 1975). In this formula, I was the potential inhibitor concentration of atomoxetine or metabolite, and Ki was the previously determined kinetic constant. To predict the maximal potential for drug-drug interactions, a conservative approach using total drug concentration (Table 1) instead of free drug concentration was used as the inhibitor concentration even though both atomoxetine (98.7% bound) and N-desmethylatomoxetine (99.1% bound) are highly bound to human albumin (Sauer et al., 2003).
Maximal plasma concentrations of atomoxetine, N-desmethylatomoxetine and 4-hydroxyatomoxetine (Table 1) from a multiple dose pharmacokinetic study in eight EM and six PM adult subjects were used to predict the degree of in vivo inhibition. Although the maximal recommended dose of atomoxetine is 1.2 mg/kg/day, a conservative approach was used and the concentrations of atomoxetine and its metabolites at a dose of 2.0 mg/kg/day were used for the predictions.
In Vivo Probe Drug Studies in Healthy Subjects
Subjects. The desipramine probe drug study was conducted at the Lilly Laboratory for Clinical Research (Indianapolis, IN). Protocol and informed consent documents were approved by the Institutional Review Board of Indiana University (Purdue University at Indianapolis). The midazolam probe drug study was conducted at PPD Development, Inc. (Austin, TX). Protocol and informed consent documents were approved by Research Consultants' Review Committee (Austin, TX). Both studies were conducted in accordance with the Declaration of Helsinki. All participants provided informed written consent before enrollment into the study. All volunteers were considered to be healthy on the basis of medical history, physical examination, electrocardiographic findings, and routine clinical laboratory tests. Volunteers with clinically abnormal results were excluded from the study. CYP2D6 EM and PM subjects, as determined by genotyping and phenotyping analyses, were entered in the desipramine and midazolam studies, respectively.
Determination of CYP2D6 Genotype. CYP2D6 genotype analysis was performed by Genaissance Pharmaceuticals, Inc. (formerly DNA Sciences) (Morrisville, NC). CYP2D6 genotype was evaluated by testing for the nonwild-type (PM) alleles *3, *4, *5, *6, *7, and *8. If patients were homozygous for any combination of these alleles, a PM genotype was assigned; otherwise, an EM genotype was assigned.
Briefly, DNA from whole blood samples were isolated and purified using the Gentra Puregene DNA isolation kit and analyzed for CYP2D6 genotype using a validated PCR method. The presence of the CYP2D6 alleles *3, *4, *6, *7, and *8 was determined using multiplex PCR. The first round amplification generates a 1578-base pair product containing the five alleles. The 1578-base pair product serves as the template for a multiplex allele-specific assay to simultaneously identify the five alleles. The first round PCR template is added to two separate master mixes containing primers that recognize wild-type or mutant alleles. These primers produce PCR products of 1394-, 1010-, 304-, 219-, and 167-base pairs in length for *7, *3, *4, *8, and *6 alleles, respectively. For wild-type genotypes, PCR products occur in the wild-type lanes, whereas no PCR products are observed in the mutant lane. For heterozygous genotypes, PCR products of the same fragment size occur in both the wild-type and mutant lanes. For mutant genotypes, PCR products occur only in the mutant lane. The CYP2D6 “*5” allele results from a complete deletion of the CYP2D6 gene. A long-range PCR method is used to identify a deletion of the CYP2D6 locus. Presence or absence of PCR products identifies the wild-type, heterozygous mutant, or homozygous mutant alleles. After electrophoresis, gels are photographed under ultraviolet light and the appropriate genotype is assigned.
Design of Desipramine Probe Drug Study. This study was an open-label, one-sequence crossover, repeated dose drug interaction study in healthy adult men and women characterized as CYP2D6 EM subjects. In period 1, each subject received a single 50-mg oral dose of desipramine (Norpramin) alone on study day 1. Blood samples for pharmacokinetic analysis of desipramine were collected before dosing desipramine, and then 0.5, 1, 2, 3, 4, 6, 8, 12, 24, 48, 72, 96, 120, and 144 h postdose. In period 2, the first six subjects received 40 mg of atomoxetine b.i.d.. Because the doses for the first six subjects were well tolerated in combination with desipramine, the remaining 16 subjects received 60 mg of atomoxetine b.i.d. Subjects were maintained on 40 or 60 mg of atomoxetine for 13 days to maintain atomoxetine exposure during the elimination of desipramine. On day 4 of atomoxetine administration, subjects received a single 50-mg oral dose of desipramine with the morning dose of atomoxetine. Blood samples for pharmacokinetic analysis of desipramine were collected before dosing desipramine, and then 0.5, 1, 2, 3, 4, 6, 8, 12, 24, 48, 72, 96, 120, 144, 168, 192, and 216 h postdose. Blood samples for pharmacokinetic analysis of atomoxetine were collected after the morning oral dose of atomoxetine on the day before desipramine administration and the day of desipramine administration (before dosing atomoxetine and then 0.5, 1, 2, 3, 4, 6, 8, and 12 h postdose).
Design of Midazolam Probe Drug Study. The study was an open-label, one-sequence crossover, replicated design drug interaction study in healthy men and women characterized as CYP2D6 poor metabolizers. A replicate design was used to enhance the power due to the difficulty in recruiting PM subjects. In period 1, each subject received a single 5-mg oral dose of midazolam (Versed; midazolam hydrochloride supplied as a 2 mg/ml syrup) alone on study days 1 and 2. Blood samples for pharmacokinetic analysis of midazolam were collected after the single doses of midazolam on study days 1 and 2 of period 1 (before dosing, and 0.25, 0.5, 1, 1.5, 2.5, 3.5, 5.5, 7.5, 9.5, 11.5, 15, and 23.5 h postdose). Treatment periods were separated by 1 day. In period 2, subjects were orally administered 60 mg of atomoxetine b.i.d. for 12 days. On study days 6 and 12 of period 2, subjects received a single 5-mg oral dose of midazolam approximately 30 min after their morning dose of atomoxetine. Blood samples for pharmacokinetic analysis of midazolam were collected on study days 6 and 12 of period 2 (before dosing, and 0.25, 0.5, 1, 1.5, 2.5, 3.5, 5.5, 7.5, 9.5, 11.5, 15, and 23.5 h postdose). Blood samples for pharmacokinetic analysis of atomoxetine were also collected on study days 6 and 12 of period 2 after the morning oral dose of atomoxetine (before dosing, and 0.5, 1, 1.5, 2, 3, 4, 6, 8, 10, and 12 h postdose).
Bioanalytical Methodologies for Clinical Studies. Plasma concentrations of atomoxetine, N-desmethylatomoxetine, and 4-hydroxyatomoxetine were determined using a validated liquid chromatography/atmospheric pressure chemical ionization/mass spectrometry/mass spectrometry method by Taylor Technology, Inc. (Princeton, NJ). The analytical methods for atomoxetine and its metabolites have been previously described in Sauer et al. (2003). For desipramine, plasma was analyzed using a validated gas chromatographic/nitrogen phosphorus detector method at PPD Development (Richmond, Virginia). The dynamic range for the assay was 0.5 to 100 for desipramine. The intra/interassay precision and accuracy ranged from 6.61 to 9.31% and 3.88 to 7.29%, respectively. Plasma concentrations of midazolam were analyzed using a validated liquid chromatography/atmospheric pressure chemical ionization/mass spectrometry/mass spectrometry method at Taylor Technology, Inc. The dynamic range for the assay was 0.5 to 100 ng/ml for midazolam. The intra/interassay precision and accuracy ranged from 1.53 to 15.6% and –3.60 to 3.20%, respectively.
Pharmacokinetic Analysis. Pharmacokinetic parameter estimates for midazolam and desipramine were calculated with noncompartmental analysis by using WinNonlin Professional version 2.1 (Pharsight, Mountain View, CA). The maximum plasma concentration (Cmax), corresponding time of the maximum concentration (Tmax), terminal half-life (t1/2), area under the plasma concentration time curve (AUC0-t), extrapolated to infinite time (AUC0-∞), apparent clearance (CL/F) and apparent volume of distribution (Vz/F) were calculated.
The pharmacokinetic evaluation of the steady-state atomoxetine, N-desmethylatomoxetine, and 4-hydroxyatomoxetine plasma concentration data used noncompartmental pharmacokinetic methods of analysis. The minimum plasma concentration (Css, min), maximum plasma concentration (Css, max), corresponding times of the maximal concentration (Tmax), area under the plasma concentration time curve (AUC0-τ) over the 12-h dosing interval (τ), average steady-state plasma concentration (Css, avg), apparent plasma clearance at steady state (CLss/F), and apparent volume of distribution (Vz/F) were calculated.
Statistical Analysis. A comparison of plasma pharmacokinetics of the probe drugs (desipramine and midazolam) alone and coadministered with atomoxetine was performed with Cmax, AUC0-t, AUC0-∞, and Tmax. A similar comparison was made for atomoxetine pharmacokinetics with and without desipramine coadministered. All statistical analyses used SAS version 6.12.
Besides Tmax, all analyses were carried out with a mixed effect analysis of variance on log-transformed values. Geometric means, ratio of geometric means, 90% confidence intervals of the ratio, and p values for the hypothesis of no treatment difference were calculated. For Tmax comparisons, treatment medians, the median of paired differences and the p value for the hypothesis of no treatment difference were calculated. The p value was calculated with Wilcoxon signed rank test.
A similar statistical approach was used for both the midazolam and desipramine interaction studies. The model, including treatment as a fixed effect and subject as a repeated factor, was used for analysis. The maximum likelihood method of estimation and Satterthwaite's degree of freedom method were used.
The determination of whether atomoxetine is a significant in vivo inhibitor of CYP3A or CYP2D6 was made primarily based on the ratio of geometric means and the 90% confidence intervals for AUC of midazolam or desipramine. If the 90% confidence interval for the ratio of geometric means of AUC was contained within the boundaries of 0.8 and 1.25, atomoxetine was not considered a significant inhibitor of CYP2D6. Additionally, if the 90% confidence interval for the ratio of geometric means of AUC for midazolam was contained within the boundaries of 0.74 to 1.35 and the p value for the null hypothesis that the treatments are equivalent is ≥0.1, atomoxetine was not considered a significant inhibitor of CYP3A. The predefined boundaries of midazolam are wider than the typical 0.8 to 1.25 boundaries due to fairly high variability in midazolam pharmacokinetics and the smaller sample size due to recruitment of poor metabolizer subjects.
Results
In Vitro Inhibition Studies
O-Deethylation of Phenacetin (CYP1A2). The formation of acetaminophen after incubation with 12.5 μM phenacetin, a concentration below Km, was inhibited approximately 30% by atomoxetine at concentrations at 800 μM and 10% by 4-hydroxyatomoxetine at concentrations at 500 μM. Therefore, CYP1A2 mediated metabolism is predicted not to be inhibited by atomoxetine or 4-hydroxyatomoxetine in vivo.
The kinetics of formation of acetaminophen by the human microsomal mixture in the inhibition study with N-desmethylatomoxetine yielded an apparent Km of 53 μM and Vmax of 805 pmol/min/mg protein. N-Desmethylatomoxetine was found to be a mixed competitive/noncompetitive inhibitor of acetaminophen formation, exhibiting a relatively high apparent Ki value of 271 μM (Table 2). Therefore, atomoxetine and these two metabolites at concentration reflective of a high therapeutic dose of atomoxetine (Table 1) were predicted to have little effect on CYP1A2 mediated metabolism (≤2.3%) in EM and PM subjects (Table 3).
In vitro inhibition of CYP3A, CYP2D6, CYP2C9, and CYP1A2 form-selective catalytic activities by atomoxetine, N-desmethylatomoxetine, and 4-hydroxyatomoxetine
Predicted in vivo inhibition of CYP2D6, CYP3A, CYP2C9, and CYP1A2 mediated metabolism by atomoxetine, N-desmethylatomoxetine, and 4-hydroxyatomoxetine in CYP2D6 extensive and poor metabolizer populations
4′-Hydroxylation of Diclofenac (CYP2C9). The formation of 4′-hydroxy diclofenac after incubation with 2.5 μM diclofenac, a concentration below Km, was inhibited approximately 37% by atomoxetine at concentrations of at 800 μM, and 34% by 4-hydroxyatomoxetine at concentrations at 500 μM. As a result, CYP2C9-mediated metabolism is predicted not to be inhibited by atomoxetine or 4-hydroxyatomoxetine in vivo.
The kinetics of formation of 4′-hydroxy diclofenac by the human microsomal mixture in the inhibition study with N-desmethylatomoxetine yielded apparent Km and Vmax values of 6.2 μM and 1703 pmol/min/mg protein, respectively. The best-fit model describing the inhibition of the formation of 4′-hydroxy diclofenac was found to be competitive for N-desmethylatomoxetine yielding an apparent Ki value of 53 μM (Table 2). The projected in vivo inhibition of CYP2C9-mediated metabolism by this metabolite was determined to be 0.4% in EM subjects and 11% in PM subjects (Table 3).
1′-Hydroxylation of Bufuralol (CYP2D6). The formation of 1′-hydroxy bufuralol followed simple Michaelis-Menten kinetics in human microsomal mixtures in the inhibition study with atomoxetine, N-desmethylatomoxetine, and 4-hydroxyatomoxetine. The mean apparent Km and Vmax value for the formation of 1′-hydroxy bufuralol in the presence of atomoxetine, N-desmethylatomoxetine, and 4-hydroxyatomoxetine was 7.8 μM and 129 pmol/min/mg protein, respectively.
The inhibition of bufuralol metabolism by atomoxetine, N-desmethylatomoxetine, and 4-hydroxyatomoxetine was found to model best to competitive inhibition, yielding apparent Ki values of 3.6, 5.3, and 17 μM, respectively (Table 2). The additive inhibition of CYP2D6 in the EM population by atomoxetine and its two metabolites is 60% (Table 3). Percentage of inhibition was not determined for the PM population due to the lack of CYP2D6 in this population.
1′-Hydroxylation of Midazolam (CYP3A). The formation of 1′-hydroxy midazolam was found to follow simple Michaelis-Menten kinetics in human microsomal mixtures in the inhibition study with atomoxetine, N-desmethylatomoxetine, and 4-hydroxyatomoxetine. The mean apparent Km and Vmax value for the formation of 1′-hydroxy midazolam in the presence of atomoxetine, N-desmethylatomoxetine, and 4-hydroxyatomoxetine was 5.1 μM and 2506 pmol/min/mg protein, respectively.
The inhibition of midazolam metabolism by atomoxetine and N-desmethylatomoxetine was found to model best to mixed competitive/noncompetitive inhibition, yielding apparent Ki values of 34 and 16 μM, respectively (Table 2). The best-fit model describing the inhibition of the formation of 1′-hydroxy midazolam by 4-hydroxyatomoxetine was found to be noncompetitive yielding an apparent Ki value of 461 μM. The additive effect of CYP3A inhibition by atomoxetine, N-desmethylatomoxetine, and 4-hydroxyatomoxetine in vivo would be predicted to be 12% in EM subjects and 56% in PM subjects (Table 3).
In Vitro Induction Studies
The activities of CYP1A2 and CYP3A were determined in cultured human hepatocytes exposed to atomoxetine and were compared with those in vehicle-treated cultures, as well as in cultures exposed to known inducers. After treatment with atomoxetine, samples from two of three hepatocyte preparations had 7-ethoxyresorufin O-deethylase activities that were not statistically different than control values (data not shown), indicating that induction had not occurred. The third preparation had 7-ethoxyresorufin O-deethylase activities that were significantly different from control values at 1.0 μM atomoxetine, but not at any other concentration. In all three preparations, the positive control 3-methylcholanthrene showed statistically significant increases in 7-ethoxyresorufin O-deethylase activity, ranging from 61- to 196-fold, compared with control activity.
In the hepatocyte preparations treated with atomoxetine, midazolam 1′-hydroxylase activities were not statistically different from control values (data not shown), indicating that induction had not occurred. Each hepatocyte preparation showed a significant increase in CYP3A mediated midazolam 1′-hydroxylase activity after treatment with rifampicin exposure, yielding increases ranging from 2.5- to 10.1-fold, compared with control activity.
In Vivo Probe Drug Studies in Healthy Subjects
Subject Characteristics. For the desipramine probe drug study, 22 CYP2D6 EM subjects were entered in the study and 21 subjects completed. There were 11 males and 11 females, ranging from 26 to 55 years of age, with a mean of 45 years. The body mass index for women ranged from 18.8 to 28.3 kg/m2 and for men ranged from 23.6 to 30.4 kg/m2. Of these subjects, there were two African-Americans and 20 Caucasians.
For the midazolam probe drug study, eight CYP2D6 poor metabolizer subjects were enrolled into the study; five subjects completed both treatment periods of the study. There were four males and four females, ranging from 20 to 35 years of age, with a mean age of 27 years. The body mass index for women ranged from 18.1 to 22.7 kg/m2, and for men ranged from 20.3 to 25.1 kg/m2. Of these subjects there were seven Caucasians and one Hispanic.
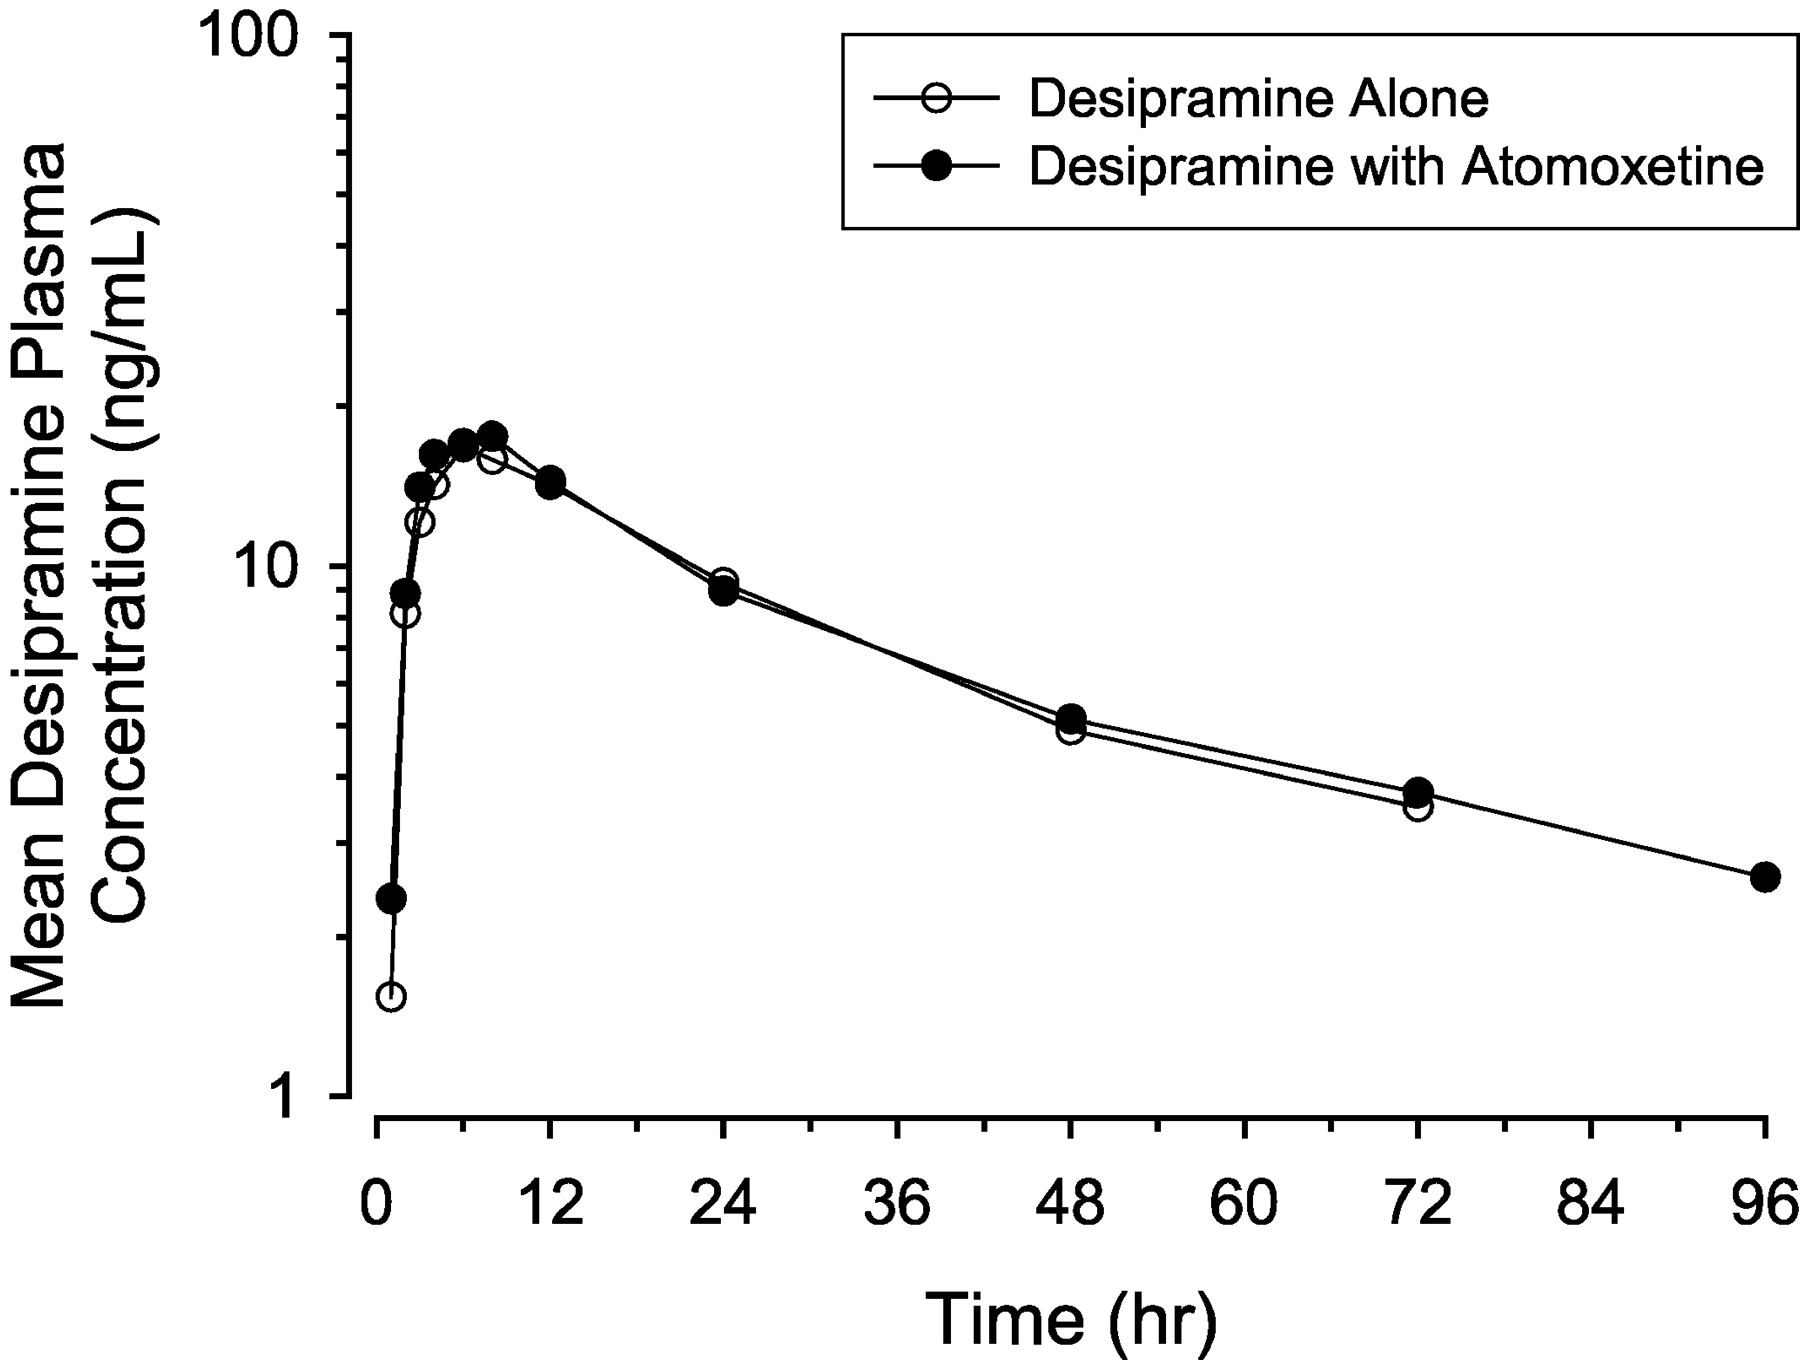
Desipramine Probe Drug Study. Plasma desipramine concentration-time data were evaluated after single 50-mg desipramine doses administered alone or during coadministration with 40- or 60-mg b.i.d. atomoxetine to CYP2D6 EM subjects. The relative ratios of desipramine alone to desipramine in the presence of atomoxetine (see “Statistical Analysis” section under Materials and Methods for description) were similar for subjects receiving the 40- or 60-mg b.i.d. dose of atomoxetine. Due to the inherent variability in these small populations, the AUC and Cmax values for atomoxetine could not be differentiated statistically between the 40- and 60-mg treatment groups. Therefore, analyses of desipramine data combined data from both groups.
When desipramine was administered to subjects given atomoxetine, the Cmax and AUC0-∞ of desipramine were nearly identical compared to when desipramine was administered alone (Fig. 2; Table 4). For both treatments, less than two-thirds of subjects had measurable concentrations beyond 96 h postdose. The 90% confidence intervals for the ratio of the geometric means were contained in the boundaries of 0.8 to 1.25 for AUC0-t, AUC0-∞, and Cmax (Table 5). Furthermore, the median Tmax values for the two treatments were the same. Based on these results, it is concluded that desipramine pharmacokinetics were not altered in the presence of atomoxetine.

Mean plasma concentration-time profiles for desipramine (single dose of 50 mg) given alone and with atomoxetine at steady state (40 or 60 mg b.i.d. for 13 days) in extensive metabolizer subjects.
Noncompartmental pharmacokinetic parameters of desipramine in CYP2D6 extensive metabolizer subjects following a 50 mg oral dose in the presence and absence of atomoxetine at steady state
Statistical comparison of desipramine pharmacokinetic parameters in the presence and absence of atomoxetine at steady state in CYP2D6 extensive metabolizer subjects
As expected, coadministration of desipramine and atomoxetine did not alter the pharmacokinetics of atomoxetine (Table 6). Statistical analysis (data not shown) of atomoxetine pharmacokinetics demonstrated the 90% confidence intervals for the ratio of the geometric means were within the 0.8 to 1.25 boundaries, and the Tmax was identical for the two treatments.
Noncompartmental pharmacokinetic parameters of atomoxetine at steady state in the presence and absence of desipramine in CYP2D6 extensive metabolizer subjects
Midazolam Probe Drug Study. Plasma midazolam concentration-time data were evaluated after single doses of midazolam administered alone or during coadministration with multiple doses of 60-mg atomoxetine (b.i.d.) to CYP2D6 poor metabolizer subjects. When midazolam was administered to subjects given atomoxetine for up to 12 days (period 2, days 6 and 12), the Cmax, Tmax, and AUC0-∞ of midazolam were slightly increased compared with when midazolam was administered alone (period 1, days 1 and 2) (Fig. 3; Table 7). The intrasubject variability, when midazolam was administered alone (period 1, days 1 and 2), for AUC0-t, AUC0-∞, and Cmax was 23.1, 18.6, and 19.4%, respectively. The 90% confidence intervals for the ratio of the geometric means were not contained in the predefined boundaries of 0.74 to 1.35 (based on the expected variability in the plasma pharmacokinetics of midazolam), with the upper interval extending to 1.46, 1.47, and 1.46 for AUC0-t, AUC0-∞, and Cmax, respectively (Table 8). Although the confidence intervals were outside the boundaries of being considered equivalent, the differences between treatments were not statistically significant. However, treatment differences were indicated for Tmax, indicating that the time to peak plasma midazolam concentration was statistically significantly longer (1.00 versus 0.69 h) when midazolam was administered with atomoxetine.

Mean plasma concentration-time profiles for midazolam (single dose of 5 mg) given alone and with atomoxetine at steady state (60 mg b.i.d. for up to 12 days) in poor metabolizer subjects.
Noncompartmental pharmacokinetic parameters of midazolam in CYP2D6 poor metabolizer subjects following a 5 mg oral dose in the presence of atomoxetine (60 mg b.i.d.) at steady state
Statistical comparison of midazolam pharmacokinetic parameters in the presence and absence of atomoxetine at steady state in CYP2D6 poor metabolizer subjects
The noncompartmental pharmacokinetic parameters obtained for atomoxetine and N-desmethylatomoxetine during coadministration with midazolam are shown in Table 9. Clearly, the maximal plasma concentration observed for atomoxetine and N-desmethylatomoxetine were well below the calculated Ki values for the inhibition of CYP3A-mediated clearance.
Noncompartmental pharmacokinetic parameters of atomoxetine and N-desmethylatomoxetine in CYP2D6 poor metabolizer subjects at steady state in the presence and absence of midazolam
Discussion
The primary purpose of the studies reported here was to evaluate the ability of atomoxetine to inhibit or induce human cytochrome P450-mediated metabolism and thus alter the pharmacokinetics of drugs metabolized by these enzymes. To understand the clinical potential of atomoxetine to inhibit CYP1A2, CYP2C9, CYP2D6, and CYP3A, the metabolism of the probe substrates phenacetin (Butler et al., 1989; Tassaneeyakul et al., 1993), diclofenac (Leemann et al., 1992), bufuralol (Distlerath et al., 1985), and midazolam (Wrighton and Ring, 1994) were initially evaluated in isolated human hepatic microsomes with atomoxetine and its primary oxidative metabolites. In primary human hepatocytes, 7-ethoxyresorufin (Guengerich, 1995) and midazolam (Wrighton and Thummel, 2000) were used to assess the potential of atomoxetine to induce CYP1A2 and CYP3A activity, respectively. Based on the in vitro findings, drug interaction studies in healthy subjects were conducted with desipramine, a selective probe substrate for CYP2D6 (Spina et al., 1997) and midazolam, a selective probe substrate for CYP3A (Wrighton and Thummel, 2000).
Atomoxetine is predominantly metabolized by CYP2D6 (Ring et al., 2002); therefore, its single- and multiple-dose pharmacokinetics are influenced by the activity of this enzyme (Farid et al., 1985; Belle et al., 2002; Sauer et al., 2003). As a result, the systemic clearance of atomoxetine has a bimodal distribution. Specifically, PM subjects have a substantially slower clearance of atomoxetine (CLss/F = 0.0357 l/h/kg) compared with EM subjects (CLss/F = 0.373 l/h/kg). In PM subjects, atomoxetine has a plasma half-life that ranges from 16.8 to 25.2 h and therefore accumulates in plasma after repeated daily administration (Sauer et al., 2003). Extensive metabolizers of CYP2D6 substrates, the majority of individuals, possess a range of activities considered to be normal CYP2D6 activity. In EM subjects, atomoxetine has a half-life that ranges from 3.7 to 9.1 h and shows little accumulation after repeated daily administration (Sauer et al., 2003). Due to the differences in the degree of plasma accumulation and overall exposure between EM and PM subjects administered atomoxetine, these factors were considered in the interpretation of the in vitro findings, as well as the design of the in vivo drug interaction (probe substrate) studies.
The degree of in vivo inhibition predicted from the in vitro studies used conservative estimates for concentrations of atomoxetine and its metabolites available to interact with the enzyme. Under the conservative concentrations modeled, these in vitro studies suggested that atomoxetine had the potential to inhibit the metabolism and affect the pharmacokinetics of pharmaceutical agents metabolized via CYP2D6. The in vitro predictions indicate that atomoxetine (54% predicted inhibition) and not its metabolites (5% predicted inhibition) would be primarily responsible for inhibition. It should be noted that the prediction strategy used here was for the purpose of risk assessment, and not for the precise prediction of the magnitude of interaction that would occur with atomoxetine administration. Although there are other prediction strategies available which may not predict any clinical significant interactions (especially with the inclusion of protein binding), such predictions may allow for clinically significant drug interactions not to be adequately evaluated in the clinic.
These in vitro findings led to an in vivo study in healthy CYP2D6 EM subjects evaluating the coadministration of atomoxetine and desipramine. The ability of atomoxetine to inhibit desipramine metabolism was not determined for the PM population due to the lack of CYP2D6 activity in this population. Desipramine is a sensitive and selective probe drug for CYP2D6-dependent metabolism. That is, its biotransformation to 2-hydroxydesipramine is almost exclusively mediated by CYP2D6 and is not affected by inhibitors of other metabolic pathways (Spina et al., 1997). During the conduct of the study, the daily dose relative to body weight of atomoxetine ranged from 1.2 to 2.3 mg/kg/day with a median dose of 1.6 mg/kg/day. At these doses, maximum steady-state plasma concentrations (Css, max) of atomoxetine ranged from 241 to 1046 ng/ml, with values in the range of and exceeding the predicted Ki of atomoxetine for CYP2D6 (919 ng/ml [3.6 μM]). However, due to the rapid elimination of atomoxetine, the average steady-state concentrations (Css, avg) were well below the Ki (Css, avg range = 105 to 569 ng/ml). No changes in desipramine pharmacokinetics were observed under these conditions. Thus, in clinical practice, atomoxetine administered to steady state at the maximum recommended clinical dose will not likely result in the inhibition of the metabolic clearance of drugs metabolized by CYP2D6.
The in vitro inhibition studies, under the conservative conditions modeled, also suggested that atomoxetine had the potential to affect the pharmacokinetics of agents metabolized by CYP3A but only when atomoxetine and N-desmethylatomoxetine plasma concentrations were relatively high. At therapeutic doses, only CYP2D6 PM patients would achieve plasma concentrations that would approach the Ki for the inhibition of CYP3A. Again, the conservative in vitro prediction indicated that atomoxetine (28% predicted inhibition) and N-desmethylatomoxetine (28% predicted inhibition) would be primarily responsible for inhibition. These in vitro findings lead to an in vivo study evaluating the coadministration of atomoxetine and midazolam in healthy CYP2D6 PM subjects. Midazolam is a sensitive and selective probe drug for CYP3A-dependent metabolism (Wrighton and Thummel, 2000). During the conduct of the study the daily dose relative to body weight of atomoxetine ranged from 1.5 to 2.7 mg/kg/day with a median dose of 1.7 mg/kg/day. At these doses in CYP2D6 PM subjects, maximum steady-state plasma concentrations (Css, max) of atomoxetine ranged from 1456 to 3319 ng/ml and N-desmethylatomoxetine ranged from 755 to 2485 ng/ml, below their predicted Ki values for CYP3A [8757 ng/ml (34 μM) and 3837 ng/ml (16 μM), respectively]. In healthy CYP2D6 PM subjects, the midazolam geometric means for Cmax and AUC0-∞ were about 16% greater when midazolam was coadministered with atomoxetine; however, this increase was not statistically or clinically significant.
Coadministration of the potent CYP3A inhibitor ketoconazole with midazolam has been reported to result in a 15-fold increase in the AUC and a 4-fold increase in the Cmax of midazolam (Olkkola et al., 1994). Furthermore, under these conditions the half-life of midazolam also increased from 2.9 to 7.0 h. Unlike the interaction observed with ketoconazole, atomoxetine did not alter the half-life of midazolam and the slight increase in midazolam exposure was not statistically significant. Previously, Yuan et al. (1999) demonstrated that moderate inhibitors, such as grapefruit juice, coadministered with midazolam resulted in pharmacokinetic changes (approximately 150% increased Cmax and AUC) much greater than that observed for atomoxetine. With only minimal changes in midazolam pharmacokinetics observed under these conditions, it is concluded that repeated administration of atomoxetine at the maximum expected clinical dose would not result in clinically significant inhibition of the metabolic clearance of drugs metabolized by CYP3A.
Incubation of atomoxetine in preparations of primary human hepatocytes did not cause an increase in the metabolic activities of either CYP3A or CYP1A2. Although not predicted by the in vitro studies to cause induction, the design of the midazolam probe drug study also allowed for an assessment of the ability of atomoxetine to increase CYP3A activity. When midazolam is administered after several days of treatment with rifampin, a known potent inducer of CYP3A, a substantial reduction in both the AUC (96% reduction) and Cmax (94% reduction) of midazolam is observed (Backman et al., 1996). Again, with only minimal increases in midazolam AUC and Cmax after administration of atomoxetine for up to 12 days, it is concluded that repeated administration of atomoxetine at the maximum expected clinical dose does not result in the in vivo induction of CYP3A-mediated metabolism.
In conclusion, in vitro inhibition studies demonstrated that atomoxetine is an inhibitor of both CYP2D6 and CYP3A, but not CYP1A2 or CYP2C9. When the in vitro data were conservatively evaluated in context with the observed total plasma concentrations of atomoxetine and metabolites after a high dose, predictions of potentially clinically significant inhibition of both CYP2D6 (in CYP2D6 EM patients) and CYP3A (in CYP2D6 PM patients) were made. However, the in vivo studies did not support these in vitro predictions. Coadministration of atomoxetine with desipramine, a model compound for drugs metabolized by CYP2D6, did not alter the plasma pharmacokinetics of atomoxetine or desipramine. Coadministration of atomoxetine with midazolam, a model compound for CYP3A-metabolized drugs, resulted in only a minor statistically insignificant increase in midazolam plasma exposure. Thus, drugs requiring systemic clearance via CYP1A2, CYP2C9, CYP2D6, or CYP3A would not require dose adjustment when coadministrated with atomoxetine at efficacious doses.
Acknowledgments
We thank Beth Ann Sheets and Andrea L. Riggio for assistance and dedication in conducting these studies. We also thank Dr. Jenny Yuehling Chien for rigorous scientific review of this work.
Footnotes
-
DOI: 10.1124/jpet.103.058727.
-
ABBREVIATIONS: AUC, area under the time versus plasma concentration curve; EM, extensive metabolizers; CL, clearance; PM, poor metabolizers; HMM, hepatocyte maintenance medium; Vz, volume of distribution during terminal phase; Css, avg, average plasma concentration at steady state; Css, max, maximal plasma concentration at steady state; Css, min, minimal plasma concentration at steady state; F, bioavailability.
- Received August 25, 2003.
- Accepted October 16, 2003.
- The American Society for Pharmacology and Experimental Therapeutics


