


Abstract
The strategic localization of peptide transporter 2 (PEPT2), a proton-coupled oligopeptide transporter, to the apical membrane of epithelial cells in the kidney and choroid plexus suggests that it plays an important role in the disposition of peptides/mimetics in the body. Therefore, the in vivo significance of PEPT2 was investigated in wild-type and PEPT2 null mice following an i.v. bolus dose (0.05 μmol/g body weight) of [14C]glycylsarcosine (GlySar). In PEPT2 null mice, the clearance (total and renal) of GlySar was markedly increased (2-fold), resulting in concomitantly lower systemic concentrations. In addition, renal reabsorption was almost abolished, and GlySar was eliminated by glomerular filtration. Of the 46% of GlySar reabsorbed in wild-type mice, PEPT2 accounted for 86% and PEPT1 accounted for 14% of reabsorbed substrate. Analysis of GlySar uptake in kidney sections revealed that PEPT2 was primarily localized in the outer medullary region. Wild-type mice also had greater choroid plexus concentrations of GlySar and a 5-fold greater choroid plexus/cerebrospinal fluid (CSF) ratio as compared with null mice at 60 min. Null mice exhibited a greater CSF/blood ratio at 60 min (0.9 versus 0.2) and area under the curve (AUC)CSF/AUCblood ratio over 60 min (0.45 versus 0.12), indicating that PEPT2 significantly reduces the exposure of GlySar in CSF. Our in vivo results demonstrate that PEPT2 is the predominant peptide transporter in kidney and that it acts as an efflux transporter in choroid plexus. Thus, PEPT2 may have profound effects on the sensitivity and/or toxicity of peptides and peptide-like drugs.
PEPT2, a member of the proton-coupled oligopeptide transporter (POT) family (i.e., PEPT1, PEPT2, PHT1, PHT2), is an electrogenic, sodium-independent symporter that translocates small peptides (i.e., sequence-independent di- and tripeptides) along with protons across biological membranes via an inwardly directed electrochemical gradient of protons (Herrera-Ruiz and Knipp, 2002). PEPT2 is also important in its ability to transport peptide-like drugs (e.g., aminocephalosporins, angiotensin-converting enzyme inhibitors, and antiviral nucleoside prodrugs), endogenous peptidomimetics (e.g., 5-aminolevulinic acid), and neuropeptides (e.g., carnosine) (Rubio-Aliaga and Daniel, 2002; Smith et al., 2004). PEPT2 was initially cloned from a human kidney cDNA library (Liu et al., 1995) and is characterized as a high-affinity (i.e., micromolar Km), low-capacity transporter (Daniel and Rubio-Aliaga, 2003). PEPT2 is widely expressed in a variety of tissues including the kidney, brain, lung, eye, and mammary gland (Daniel and Kottra, 2004; Smith et al., 2004). In particular, PEPT2 mRNA and protein are highly expressed in the apical membrane of epithelium in kidney proximal tubule and brain choroid plexus. Despite the high expression of PEPT2, other POT members are present in the kidney (i.e., PEPT1) and brain (i.e., PHT1, PHT2), thereby complicating an accurate assessment of the physiological role and pharmacological significance of PEPT2 in these tissues.
PEPT2 functions in concert with the low-affinity (i.e., millimolar Km), high-capacity transporter PEPT1 (Daniel, 1996; Leibach and Ganapathy, 1996) at the apical membrane of renal proximal tubular epithelium for the efficient reabsorption of peptide-bound amino nitrogen from the glomerular filtrate. It is generally believed that PEPT2 is the predominant POT in kidney responsible for the reabsorption of small peptides and peptide-like drugs (Smith et al., 1998; Takahashi et al., 1998; Shen et al., 1999), although definitive proof for this assertion is lacking. If true, the activity of PEPT2 in kidney could have significant consequences on the systemic exposure to and renal elimination of peptidomimetics, potentially altering the sensitivity or toxicity to certain therapeutic agents.
The choroid plexus epithelium with linking tight junctions and array of membrane transporters forms the blood-cerebrospinal fluid (CSF) barrier (BCSFB). PEPT2 mRNA transcripts (Berger and Hediger, 1999), protein (Novotny et al., 2000; Shu et al., 2002; Shen et al., 2004), and functional activity (Teuscher et al., 2000, 2001), along with PHT1 transcripts (Yamashita et al., 1997), have been reported in rat choroid plexus. PHT2 transcripts have also been found in rat brain (Sakata et al., 2001). Studies in rat choroid plexus epithelial cells in primary culture (Shu et al., 2002; Teuscher et al., 2004) have demonstrated that PEPT2 (as opposed to PHT1 and PHT2) is functionally active on the apical membrane of choroid plexus (i.e., CSF-facing) and that it may play a role in neuropeptide homeostasis. However, in vivo experiments in support of this contention are lacking at the present time.
Although cellular, molecular, and physiological studies have made major contributions toward a mechanistic understanding of PEPT2 structure, function, and localization, the experimental approaches are often limited by an in vitro design and lack of blood supply, overlapping substrate specificities, and contribution of multiple transport systems, some of which are unknown at the time of study. As a result, it is difficult, if not impossible, to define the function of a single specific gene product and its significance in relation to other possible proteins that are present in the tissue or organ of interest. The recent generation of PEPT2 knockout mice by this laboratory (Shen et al., 2003) and others (Rubio-Aliaga et al., 2003) has provided a unique tool to probe the functional activity of PEPT2 on a multiorgan level under physiological conditions.
With this in mind, we have investigated the role and relative importance of PEPT2 in affecting the in vivo pharmacokinetics, tissue distribution, and systemic exposure of a hydrolysis/peptidase-resistant synthetic dipeptide, glycylsarcosine (GlySar), in PEPT2+/+ (wild-type) and PEPT2-/- (null) mice. Our results are novel in demonstrating, for the first time, that PEPT2 has a substantial influence on the in vivo disposition of a dipeptide within the body, particularly the kidney and brain.
Materials and Methods
Materials. [Glycine-U-14C]glycylsarcosine (106 mCi/mmol) and [3H]inulin (17 Ci/mmol) were supplied by Amersham Biosciences Inc. (Piscataway, NJ). [3H]Glycine (30 Ci/mmol) was purchased from Moravek Biochemicals (Brea, CA). Unlabeled GlySar was obtained from Sigma-Aldrich (St. Louis, MO), and hyamine hydroxide was purchased from MP Biomedicals (Irvine, CA). All other chemicals were obtained from standard sources. PEPT2 transgenic mice were generated in-house on a C57BL/6 mouse background and genotyped by polymerase chain reaction, as described by Shen et al. (2003). Animals were housed in a temperature-controlled environment with a 12-h light/dark cycle and given ad libitum access to food and water. All studies were carried out in accordance with the Guide for the Care and Use of Laboratory Animals as adopted and promulgated by the U.S. National Institutes of Health.
Pharmacokinetic and Tissue Distribution Studies. Gender-matched PEPT2+/+ and PEPT2-/- litter mates (6-8 weeks old) were anesthetized with sodium pentobarbital (65 mg/kg i.p.). Mice were then administered [14C]GlySar (5 μCi/mouse plus unlabeled GlySar for a total dose of 0.05 μmol/g body weight) by a tail vein injection (100 μl of normal saline). Serial blood samples (5 μl) were collected at 0.25, 1, 2, 5, 10, 20, 30, 45, and 60 min after the i.v. bolus by tail transection. At the end of blood sampling, a CSF sample (∼5 μl) was obtained by inserting the tip of a 28G1/2 U-100 insulin syringe (BD Biosciences, Franklin Lakes, NJ) into the cisterna magna (Carp et al., 1971). The mouse was immediately decapitated, and multiple tissues/organs were harvested (i.e., lateral and fourth ventricle choroid plexuses, cerebral cortex, kidney, liver, eye, lung, heart, spleen, small and large intestines, skeletal muscle, thymus, and pancreas). Kidney tissue was processed intact for one kidney and after separating the renal cortex, outer medulla (outer and inner stripe), and inner medulla for the other kidney. Tissue samples were blotted dry, weighed, and digested in 0.5 ml of 1 M hyamine hydroxide (a tissue solubilizer) for 24 h at 37°C. Ecolite(+) liquid scintillation cocktail (MP Biomedicals) was added to the solubilized tissues, CSF, and blood samples, and the radioactivity in each sample was measured by a dual-channel liquid scintillation counter (Beckman LS 3801; Beckman Coulter, Fullerton, CA). [3H]Inulin (1 μCi/mouse) was administered i.v. 2 min prior to harvesting the tissues so that GlySar tissue concentrations could be corrected for vascular space of brain (Keep et al., 1999; Ennis et al., 2003) or extracellular space of other tissues. Corrected tissue concentrations of GlySar (nanomoles per gram of wet tissue) were calculated as Ctiss - V × Cb, where Ctiss is the uncorrected GlySar tissue concentration (nanomoles per gram), V (milliliters per gram) is the inulin space, and Cb is the GlySar blood concentration (nanomoles per milliliter).
Time Course Studies of Tissue Distribution. Since the tissue (or CSF)-to-blood concentration ratio of GlySar may change as a function of time (i.e., a temporal relationship exists), a select number of tissues were harvested during the 1st h of dosing. Following sodium pentobarbital anesthesia (65 mg/kg i.p.), gender-matched PEPT2+/+ and PEPT2-/- litter mates (6-8 weeks old) were administered [14C]GlySar (5 μCi/mouse plus unlabeled GlySar for a total dose of 0.05 μmol/g body weight) by a tail vein injection (100 μl of normal saline), and tissue samples were corrected for vascular volume using [3H]inulin. Blood, CSF, choroid plexus, cerebral cortex, and kidney samples were obtained at 2, 5, and 15 min after dosing and processed as described previously (note: 60-min samples were obtained from previous study).
Renal Clearance Studies. Following sodium pentobarbital anesthesia (65 mg/kg i.p.), gender-matched PEPT2+/+ and PEPT2-/- litter mates (6-8 weeks old) were coadministered [14C]GlySar (5 μCi/mouse plus unlabeled GlySar for a total dose of 0.05 μmol/g body weight) and [3H]inulin (0.5 μCi/g body weight; 0.00086 μmol/g body weight) by a tail vein injection (100 μl of normal saline). Inulin was coadministered to estimate the glomerular filtration rate (GFR) of each animal, since inulin is not bound to plasma proteins and is freely filtered, with no secretion or reabsorption by the kidneys (Rowland and Tozer, 1995). Serial blood samples (∼25 μl) were collected at 0.25, 1, 2, 5, 10, 20, 30, 45, and 60 min after the i.v. bolus by tail transection. Blood samples were immediately transferred into 0.2-ml thin-wall PCR tubes (United Laboratory Plastics, St. Louis, MO) containing 1 μl of 7.5% potassium EDTA and then centrifuged at 2000g for 10 min at ambient temperature. The total urine of each animal was aspirated directly from the bladder with a 28G1/2 U-100 insulin syringe at 60 min. Radioactivity in the plasma and urine samples was determined by dual-channel liquid scintillation counting, as described previously.
Plasma Protein Binding Studies. The plasma protein binding of GlySar was determined by ultrafiltration, as described previously (Lepsy et al., 2003). Blank plasma from each genotype was spiked with [14C]GlySar to produce standard concentrations of 10, 100, and 1000 μM, values that span the plasma concentrations observed after an i.v. bolus dose of GlySar (0.05 μmol/g body weight). Subsequently, a 0.5-ml aliquot of each standard was added to a disposable Microcon YMT-30 centrifugal filter device (Millipore Corporation, Billerica, MA), using an anisotropic hydrophilic membrane that excludes molecules larger than ∼30 kDa. The device was capped, equilibrated at 37°C for 15 min in a 35° fixed-angle rotor, and centrifuged for 25 min at 37°C and 1800g. The protein-free ultrafiltrate (∼300 μl) was then collected for each sample. Preliminary studies demonstrated a negligible binding of GlySar to the ultrafiltration device and a lack of protein leakage during the ultrafiltration process (data not shown). The unbound fraction of GlySar in plasma (fu) was calculated as the ratio of the GlySar concentration in the ultrafiltrate to that in the original plasma standard.
Metabolic Stability Studies. Following sodium pentobarbital anesthesia (65 mg/kg i.p.), gender-matched PEPT2+/+ and PEPT2-/- litter mates (6-8 weeks old; n = 3 per genotype) were administered [14C]GlySar (5 μCi/mouse plus unlabeled GlySar for a total dose of 0.05 μmol/g body weight) by a tail vein injection (100 μl of normal saline). Each mouse was separately placed in a Nalgene metabolic cage with diuresis adapter (Harvard Apparatus Inc., Holliston, MA) for 24 h. At the end of this period, the diuresis adapter was washed with water, and the diluted urine was collected and measured. An aliquot (100 μl) of the diluted urine sample was taken, and total recovery of GlySar radioactivity was determined by liquid scintillation counting, as described previously. A second aliquot (100 μl) of the diluted urine sample was pretreated with 200 μl of acetonitrile in a 1.5-ml polypropylene microcentrifuge tube (Safe-Lock; Brinkmann Instruments, Westbury, NY), vortex-mixed for 5 s, and centrifuged at 2000g for 10 min under ambient conditions. The stability of GlySar was determined by its recovery and the appearance of glycine in the 24-h urine collection. GlySar and/or glycine were detected in the resultant supernatant using a high-performance liquid chromatography system consisting of a pump (model 616 with 600S controller; Waters, Milford, MA), a Rheodyne injector port (Rohnert Park, CA) with 100-μl sample loop, a reversed-phase column (5-μm, Hypersil ODS C-18, 4.6 × 250 mm; Alltech Associates, Deerfield, IL), and a radiochemical detector (FLO-ONE 515TR Series Flow Scintillation Analyzer; PerkinElmer Life and Analytical Sciences, Boston, MA). The mobile phase was composed of 0.01 M phosphate buffer (pH 2.0) and 0.1% heptafluorobutyric acid and isocratically pumped at 1 ml/min under ambient conditions. Retention times for glycine and GlySar were approximately 4.8 and 9.8 min, respectively. Peaks were identified by injecting known standards of radiolabeled glycine and GlySar.
Pharmacokinetics of GlySar Blood Concentrations. Blood concentration versus time data for GlySar were best described by a two-compartment open model with first-order elimination and a weighting factor of unity (WinNonlin version 4.1; Pharsight, Mountain View, CA):  where Cb is the GlySar blood concentration at time t, and C1 and C2 are the coefficients associated with the λ1 and λ2 exponents, respectively, where λ1 > λ2. The quality of the fit was determined by evaluating the coefficient of determination (r2), the S.E. of parameter estimates, and by visual inspection of the residuals. The following standard pharmacokinetic parameters were then generated by WinNonlin:


 where D is the i.v. bolus dose of GlySar, V1 is the volume of the central compartment, Vdss is the volume of distribution steady state, AUC is the area under the blood concentration-time curve, CL is the total blood clearance, K10 is the elimination rate constant from the central compartment, t1/2 is the terminal half-life, and MRT is the mean residence time.
Renal Pharmacokinetics of GlySar Plasma Concentrations. The renal clearance (CLR) of GlySar (or inulin, GFR) was calculated as:  where Ae60 is the amount of GlySar (or inulin) excreted unchanged in the urine over 60 min, and AUC60 is the area under the GlySar (or inulin) plasma concentration-time curve from 0 to 60 min (determined noncompartmentally by WinNonlin). In the absence of tubular secretion (of which there is no evidence for GlySar), the renal clearance of GlySar can be expressed as (Levy, 1980):
  where fu is the fraction of GlySar unbound in plasma, and F is the fraction of available dipeptide that is reabsorbed. The excretion ratio of GlySar (ER), which normalizes CLR for any differences in protein binding (fu) and functional nephron mass (GFR), was calculated as:
Based on the sequential expression of PEPT1 and PEPT2 in the proximal tubule (Smith et al., 1998; Shen et al., 1999), this equation can be transformed, by taking into account the individual contributions of peptide transporters, such that:  where F1 is the fraction of available dipeptide that is reabsorbed by PEPT1, and F2 is the fraction of available dipeptide that is reabsorbed by PEPT2. Since F2 = 0 in null mice and having experimentally determined values for CLR, fu, and GFR, an estimate of F1 can be made in the PEPT-/- mice. An estimate of F2 can then be made in the PEPT2+/+ mice since all remaining values are known (i.e., CLR, fu, and GFR experimentally determined and F1 assumed to be unchanged in the wild-type mice). The relative contribution of each transporter was calculated as %PEPT1 = 100 × (F1/F) and %PEPT2 = 100 × [F2 × (1 - F1)/F], where %PEPT1 is the percentage of reabsorbed GlySar that occurs via PEPT1, and %PEPT2 is the percentage of reabsorbed GlySar that occurs via PEPT2.
Statistics. All data are reported as mean ± S.E. Statistical comparisons were performed with analysis of variance (GraphPad Prism, version 3.0; GraphPad Software Inc., San Diego, CA) in which a probability of p ≤ 0.05 was considered statistically significant.
Results
Pharmacokinetics of GlySar. As shown in Fig. 1, the blood concentrations of GlySar were significantly lower in PEPT2-/- mice as compared with PEPT2+/+ control animals. A summary of the pharmacokinetic parameters for each genotype is presented in Table 1. Although it appears that PEPT2 did not influence volume of distribution [central compartment volume (V1) or steady-state volume (Vdss)], the total blood clearance (CL) and central compartment elimination rate constant (K10) of GlySar were about 2-fold greater in PEPT2 null mice, resulting in a 2-fold reduction in area under the blood concentration-time curve (AUC). Less dramatic differences were observed in the terminal half-life (t1/2) and mean residence time (MRT) of GlySar since these parameters reflect distribution (which does not change) as well as elimination (which does change).
Pharmacokinetics of GlySar blood concentrations in PEPT2+/+ and PEPT2-/- mice

Blood concentrations of GlySar as a function of time in PEPT2+/+ (wild-type) and PEPT2-/- (null) mice after an i.v. bolus dose of dipeptide (0.05 μmol/g body weight). Data are expressed as mean ± S.E. (n = 12-14).
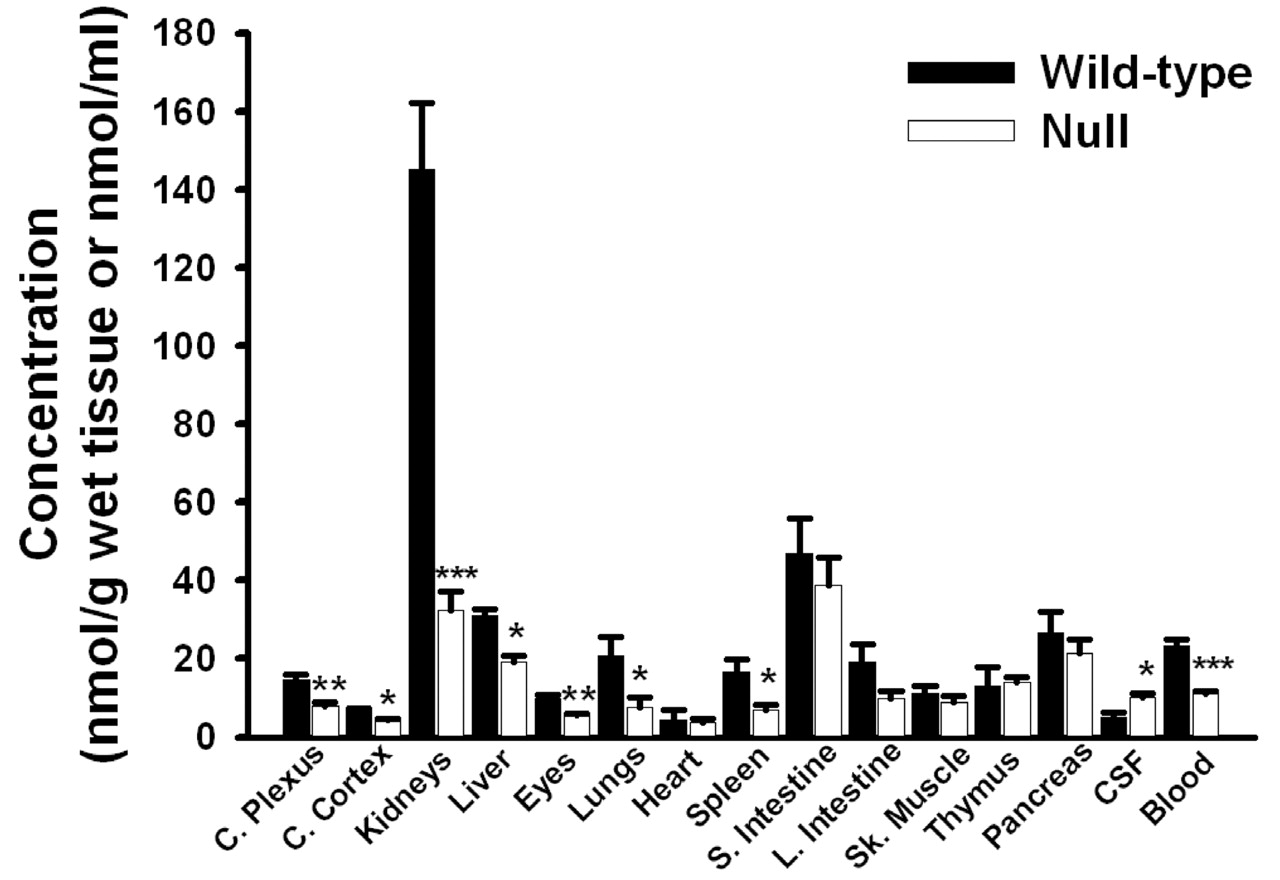
Tissue Distribution of GlySar at 60 Min.Figure 2 displays the concentrations of GlySar, 60 min following an i.v. bolus, in a variety of tissues, CSF, and blood. As evident, PEPT2 deletion had a significant effect on the ability of these tissues to accumulate dipeptide. As a result, GlySar concentrations were significantly reduced in the kidney (4.5-fold), lung (2.8-fold), spleen (2.4-fold), choroid plexus (1.9-fold), eye (1.8-fold), liver (1.6-fold), and cerebral cortex (1.4-fold) of PEPT2-/- mice. Because kidney was the tissue demonstrating the highest concentration of GlySar in wild-type animals and the most dramatic difference between genotypes, the functional presence of PEPT2 was further probed by examining concentration differences in three distinct anatomical segments. As shown in Fig. 3A, GlySar concentrations were significantly reduced in all three kidney segments of PEPT2 null mice (as compared with wild-type animals), especially in the outer medulla where concentrations were the greatest, and an 85% reduction was observed. However, when the data were corrected for differences in blood concentrations, the outer medulla was the only region of kidney to demonstrate a statistically significantly difference between genotypes in the tissue/blood concentration ratio of GlySar (Fig. 3B). When the data were not adjusted for wet tissue weight, the outer medulla accounted for 66% of the total GlySar uptake by the kidney (data not shown).

Tissue, CSF, and blood concentrations of GlySar in PEPT2+/+ (wild-type) and PEPT2-/- (null) mice, 60 min after an i.v. bolus dose of dipeptide (0.05 μmol/g body weight). Data are expressed as mean ± S.E. (n = 5-10). *, p < 0.05; **, p < 0.01; ***, p < 0.001 compared with wild-type mice.
In contrast to tissue and blood, PEPT2-/- mice had a 2-fold greater concentration of GlySar in CSF, despite having significantly lower blood concentrations (Fig. 2). As a result, the CSF/blood concentration ratio of GlySar was 4-fold greater in PEPT2 null animals as compared with wild-type controls (p < 0.001; Fig. 4B). In the absence of PEPT2, the CSF/blood ratio was approximately 0.9, indicating that GlySar can achieve CSF concentrations roughly equivalent to that observed in blood. However, when PEPT2 is functionally present, GlySar's access to the CSF is dramatically limited (i.e., CSF/blood ratio of 0.2). Although a modest 1.4-fold increase was observed in the cerebral cortex/blood concentration ratio of GlySar in PEPT2-/- mice (i.e., 0.28 in wild-type versus 0.39 in PEPT2 null animals; p < 0.01; Fig. 4D), no differences were observed between genotypes in the choroid plexus/blood ratio (i.e., 0.62 in wild-type versus 0.68 in PEPT2 null animals; p > 0.50; Fig. 4C). Nevertheless, a substantial difference was observed in the choroid plexus/CSF concentration ratio of GlySar, where PEPT2+/+ mice had a 5-fold greater value (i.e., 4.2 in wild-type versus 0.8 in PEPT2 null animals; p < 0.01).

A, whole kidney, renal cortex, outer medulla, and inner medulla concentrations of GlySar in PEPT2+/+ (wild-type) and PEPT2-/- (null) mice, 60 min after an i.v. bolus dose of dipeptide (0.05 μmol/g body weight). B, corresponding tissue/blood concentration ratios of GlySar. Data are expressed as mean ± S.E. (n = 4). *, p < 0.05; **, p < 0.01; ***, p < 0.001 compared with wild-type mice.

Time course of GlySar concentrations (or tissue-to-blood ratios) in the kidney (A), cerebrospinal fluid (B), choroid plexus (C), and cerebral cortex (D) of PEPT2+/+ (wild-type) and PEPT2-/- (null) mice after an i.v. bolus dose of dipeptide (0.05 μmol/g body weight). Data are expressed as mean ± S.E. (n = 4-10). *, p < 0.05; **, p < 0.01; ***, p < 0.001 compared with wild-type mice.
Time Course of GlySar Tissue Distribution. The tissue concentrations and tissue/blood concentration ratios of GlySar are shown over 1 h following an i.v. bolus injection of dipeptide (Fig. 4). In general, PEPT2+/+ mice exhibited greater tissue concentrations of GlySar in the kidney (Fig. 4A), choroid plexus (Fig. 4C), and cerebral cortex (Fig. 4D) than PEPT2-/- mice over the entire study period. In contrast, the wild-type animals had reduced levels of GlySar in CSF (Fig. 4B). Although these significant differences were reduced (kidney) or absent (choroid plexus) when tissue concentrations were corrected for differences in blood concentrations, the differences were magnified when tissue/blood ratios were compared between genotypes for CSF and reversed when tissue/blood ratios were compared between genotypes for cerebral cortex. In this regard, there was almost a 4-fold greater exposure of GlySar in CSF, relative to systemic blood levels, for PEPT2-/- versus PEPT2+/+ mice (AUCCSF/AUCblood ratios of 0.45 versus 0.12, respectively; p < 0.001). In addition, although cerebral cortex concentrations of GlySar were low (compared with these other tissues) and relatively constant, the tissue/blood ratio of GlySar steadily increased over time for both genotypes and was significantly greater in PEPT2 null mice.
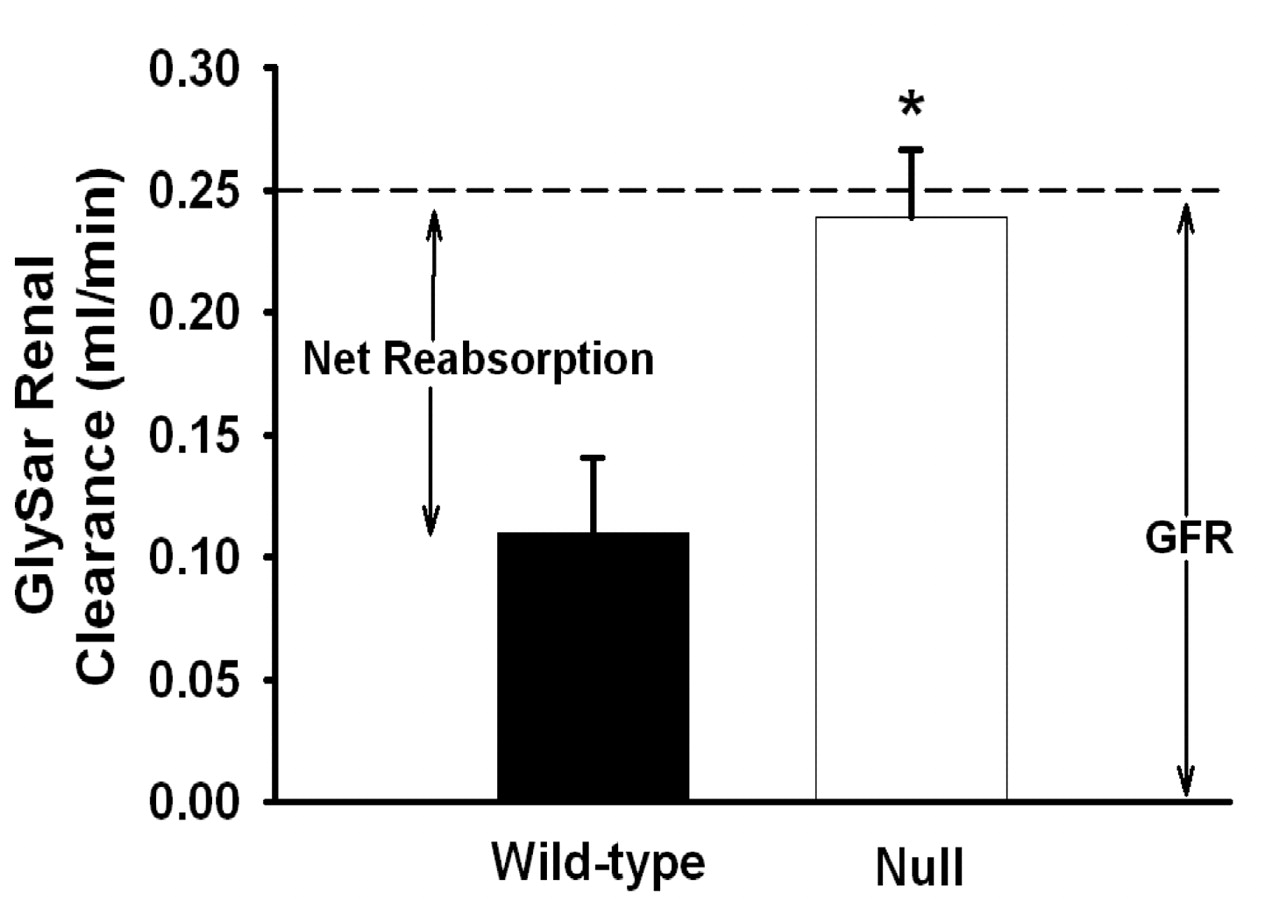
Renal Clearance of GlySar. Plasma concentration-time profiles of GlySar and inulin are shown in Fig. 5, A and B, respectively, following their coadministration by i.v. bolus injection. Although the plasma levels of GlySar were significantly reduced in PEPT2-/- mice (as shown before in Fig. 1 for blood), the inulin plasma concentrations were similar, indicating that GFR was unchanged between genotypes. Since urine samples were obtained in these studies, along with estimates of plasma protein binding, an analysis of the renal tubular transport mechanisms of GlySar was possible, as shown in Table 2 and Fig. 6. The binding of GlySar to plasma proteins was negligible (< 10%), and no difference was observed between wild-type and PEPT2 null mice. There was also no statistical difference between genotypes in the urinary excretion of GlySar over 60 min (i.e., 0.57 μmol in wild-type versus 0.68 μmol in PEPT2 null animals; p > 0.10), where about 60% of the dipeptide dose was recovered in the urine unchanged. However, the renal clearance of GlySar was increased by 2-fold in PEPT2-/- mice as compared with PEPT2+/+ animals (i.e., CLR of 0.11 ml/min in wild-type versus 0.24 ml/min in PEPT2 null mice; p = 0.020), and as a result, its excretion ratio was also substantially increased (i.e., ER of 0.54 in wild-type versus 0.94 in PEPT2 null mice; p = 0.012). Thus, 46% of the available GlySar dose was reabsorbed by the kidney in PEPT2+/+ animals (F = 0.46), accounting for the 2-fold lower renal clearance for this genotype. Moreover, of the 46% of GlySar reabsorbed in wild-type mice, PEPT2 accounted for 86% and PEPT1 accounted for 14% of reabsorbed substrate. In contrast, the renal clearance of GlySar in PEPT2-/- mice was almost identical to that of GFR. With an excretion ratio of 0.94, it appears that GlySar is almost exclusively filtered in PEPT2 null animals with only 6% of the available dipeptide being reabsorbed by the kidney (F = 0.06). Taken together, these results explain the 2-fold difference in systemic exposure profiles observed between genotypes.
Renal pharmacokinetics of GlySar plasma concentrations in PEPT2+/+ and PEPT2-/- mice

Plasma concentrations of GlySar (0.05 μmol/g body weight; A) and inulin (0.00086 μmol/g body weight; B) in PEPT2+/+ (wild-type) and PEPT2-/- (null) mice after coadministration by i.v. bolus injection. Data are expressed as mean ± S.E. (n = 4). Note the dual importance of inulin in serving as an estimate of GFR, as well as a negative control between genotypes.

Renal clearance of GlySar in PEPT2+/+ (wild-type) and PEPT2-/- (null) mice after an i.v. bolus dose of dipeptide (0.05 μmol/g body weight). The estimated GFR was approximately 0.25 ml/min for both genotypes and is indicated with a dashed line. Data are expressed as mean ± S.E. (n = 4). *, p < 0.05 compared with wild-type mice.
Metabolic Stability of GlySar. High-performance liquid chromatography with radiochemical detection, coupled to liquid scintillation counting spectrometry, demonstrated that approximately 90% of GlySar was recovered in the urine 24 h after an i.v. bolus dose of dipeptide and that 95% of the sample was intact GlySar (i.e., <5% hydrolysis to glycine) for both genotypes. Therefore, GlySar instability was not a confounding issue in these studies, and no further correction of the data was necessary.
Discussion
The present study examined the in vivo disposition of a model dipeptide substrate, GlySar, in wild-type and PEPT2 null mice. The absence of PEPT2 caused profound changes in the pharmacokinetics, tissue distribution, and systemic exposure of GlySar. In particular, PEPT2 was essential for the efficient renal tubular reabsorption of GlySar (i.e., F = 0.46 in wild-type versus F = 0.06 in null mice) and in dramatically limiting the exposure of GlySar in CSF. This study provides, to our knowledge, the first direct in vivo evidence that PEPT2 is the predominant peptide transporter in kidney and that it acts as an efflux transporter in the choroid plexus.
Functional analysis of GlySar uptake in kidney sections revealed that PEPT2 is localized primarily in the outer medullary region. This result coincides with previously reported reverse transcription-PCR and immunolocalization studies detailing the differential expression of PEPT1 and PEPT2 along the rat proximal tubule (Smith et al., 1998; Shen et al., 1999). In rat, PEPT1 was expressed in the early region of the proximal tubule (i.e., S1 segment of pars convoluta in renal cortex), whereas PEPT2 was expressed in the latter regions of the proximal tubule (i.e., S2/S3 segments of pars recta in deep cortex and outer stripe of outer medulla). Although the direct immunolocalization of PEPT1 and PEPT2 proteins in mouse kidney has not been performed, indirect localization studies in PEPT2 knockout mice (using β-galactosidase expression and fluorophore-conjugated dipeptide accumulation) suggested that PEPT1 and PEPT2 are also sequentially distributed in mouse proximal tubule (Rubio-Aliaga et al., 2003).
The sequential nature for peptide/mimetic processing in the proximal tubule, first by PEPT1 and then by PEPT2, was the basis for the model used to estimate the relative contribution of each POT in the renal reabsorption of GlySar. Renal pharmacokinetic studies revealed that of the 46% of GlySar reabsorbed by the kidney in wild-type mice, PEPT2 accounted for 86% and PEPT1 accounted for 14% of reabsorbed substrate. Combining these results with GlySar renal uptake (Figs. 3B and 4A) and renal clearance data in null mice (Fig. 6) clearly showed that PEPT2 is the dominant peptide transporter in kidney. However, it is important to note that fractional reabsorption (F), including the fractional reabsorption by each transporter (F1 and F2), may vary depending on GlySar concentrations in the glomerular filtrate. In this study, GlySar produced plasma concentrations of about 10 to 400 μM. Although the concentrations and composition of plasma di/tripeptides are unknown, animal studies suggest that about 10 to 30% of circulating amino acids in plasma might be peptide bound (Daniel and Rubio-Aliaga, 2003). Moreover, the highest plasma concentration of a known individual dipeptide (i.e., cysteinylglycine) is about 50 to 70 μM in humans (Pastore et al., 1998). Because GlySar is not secreted and has negligible binding in plasma, the filtrate concentrations of GlySar are likely to approximate that in plasma. If true, the average filtrate concentrations of GlySar would be around its estimated Km value (i.e., 50-100 μM) determined in rat renal brush border membrane vesicles (Tiruppathi et al., 1990; Takahashi et al., 1998) and the SKPT-0193 renal cell line (Brandsch et al., 1995; Shu et al., 2001) and, thus, favor transport by PEPT2. The low-affinity, high-capacity PEPT1 transporter may be responsible for handling higher di- and tripeptide concentrations, whereas PEPT2 dominates at lower, more physiologically relevant substrate concentrations. It is worth emphasizing the dual importance of inulin in this study since inulin not only provided an estimate of GFR in each animal but also served as a negative control between genotypes, validating the pharmacokinetic and tissue distribution data for GlySar.
Rubio-Aliaga et al. (2003) illustrated the importance of PEPT2 in the renal uptake of d-[3H]Phe-Ala by demonstrating that only 35% of the dipeptide remained in kidney homogenates prepared from PEPT2 null mice (as compared with wild-type animals) after an i.p. injection of compound. Those studies were limited, however, by examining kidney concentrations at a single time point and by not characterizing the impact of PEPT2 on the renal clearance of dipeptides from the systemic circulation. Renal clearance of a compound is a function of glomerular filtration (fu × GFR), tubular secretion, and tubular reabsorption. When tubular reabsorption occurs (and tubular secretion is absent), renal clearance is less than fu × GFR, and the ER is less than unity. Therefore, an ER of 0.54 in wild-type mice indicates that 46% of the available GlySar dose is reabsorbed (i.e., F = 0.46). In contrast, PEPT2 null mice had a 2-fold greater renal clearance of GlySar and almost complete abolishment of renal tubular reabsorption (i.e., ER = 0.94 and F = 0.06), indicating that GlySar is almost exclusively filtered by the kidney (i.e., CLR ≈ GFR). The urinary excretion of GlySar was not statistically different between genotypes over the 60-min collection period (Ae60). This finding is consistent with the relationship Ae60 = CLR × AUC60, in which equal and opposite changes (2-fold) were observed in CLR and AUC60 between wild-type and PEPT2 null mice. For a compound in which the kidney is the only route of elimination, no difference in urinary excretion is expected.
The partitioning of GlySar in red blood cells relative in that in plasma (i.e., Crbc/Cp) was estimated at 0.19 for each genotype and was calculated using AUCblood/AUCplasma ratios (0.61 in PEPT2+/+ mice versus 0.62 in PEPT2-/- mice) and hematocrit determinations (0.47 in PEPT2+/+ mice versus 0.48 in PEPT2-/- mice). The relatively minor partitioning of GlySar in mouse red blood cells is consistent with a study by Lochs et al. (1990), who reported the in vitro uptake of trace amounts of dipeptides by human red blood cells. As a result, red blood cells do not appear to play an appreciable role in the clearance of GlySar from plasma. Therefore, when these results are combined with the lack of metabolism for GlySar (less than 5% over 24 h based on urinary excretion data), it was concluded that renal PEPT2 activity determines the overall clearance and systemic exposure of similar peptides.
Although PEPT2+/+ mice had greater choroid plexus GlySar concentrations, compared with PEPT2-/- mice, no differences were found in the corresponding tissue/blood concentration ratios at 60 min postdose. However, PEPT2 is located at the interface of choroid plexus epithelium and CSF, and as a result, the tissue-to-CSF concentration ratios were more informative. We observed that wild-type mice had a 5-fold greater choroid plexus/CSF ratio, suggesting that although PEPT2 is responsible for the cellular uptake of GlySar from CSF, a significant accumulation of GlySar in CSF occurs in the protein's absence. Reinforcing this finding were the 2-fold greater CSF concentrations and 4-fold greater CSF/blood and AUCCSF/AUCblood ratios of GlySar in PEPT2-/- mice, indicating that PEPT2 activity at the BCSFB reduces the exposure of GlySar in CSF. Thus, it was concluded that PEPT2 operates in vivo as an efflux transporter at the BCSFB, as suggested previously from in vitro studies on the choroid plexus uptake of GlySar and 5-aminolevulinic acid (Ocheltree et al., 2004a), carnosine (Teuscher et al., 2004), and cefadroxil (Ocheltree et al., 2004b) in transgenic mice. This conclusion is in complete accordance with the current model of peptide/mimetic trafficking at the BCSFB (Smith et al., 2004). Moreover, these results suggest that PEPT2 could have important implications for the distribution of peptide-like drugs (e.g., aminocephalosporins) in CSF, a factor potentially altering pharmacological response.
The role of PEPT2 in brain (i.e., excluding the choroid plexus) currently remains unclear. Shen et al. (2004) recently showed that the PEPT2 protein is found extensively throughout the rat brain, with strongest expression in the cerebral cortex. However, the lower and less dramatic differences in cerebral cortex concentrations between genotypes suggest that these changes may be slower relative to the more rapid changes in CSF or blood, thereby complicating the accurate assessment of PEPT2 in this tissue. The role of PEPT2 in cerebral cortex will need to be further investigated, perhaps following i.c.v. administration of peptide.
Because no pathological phenotype was observed during our initial development and validation of PEPT2-deficient mice (Shen et al., 2003), it is possible that other POT family members may be up-regulated as a compensatory response to PEPT2 gene disruption. This was further investigated by performing semiquantitative PCR (i.e., POT/GAPDH ratio) on kidney samples obtained from PEPT2+/+ and PEPT2-/- mice (n = 12 per genotype, equal gender). In this study, we found that PEPT1, PHT1, and PHT2 mRNA were not very different between the two genotypes, with enhancement ratios (null/wild type) of 1.33, 0.99, and 1.04, respectively. These findings are in agreement with Rubio-Aliaga et al. (2003), who found that renal PEPT1 protein and PHT1 mRNA levels were not increased in PEPT2 knockout mice. In a more limited study (i.e., a single pooled sample), we found that PHT1 mRNA levels were not different in the choroid plexuses (1.04 enhancement ratio) and brain (0.96 enhancement ratio) of wild-type versus PEPT2 null animals and that PEPT1 and PHT2 mRNA were not detectable. This is consistent with PEPT1 protein being absent in rat choroid plexus and brain (Shen et al., 2004), although PHT2 mRNA was detected faintly in rat brain (Sakata et al., 2001). Taken as a whole, it appears that PEPT2 null mice do not exhibit an adaptive up-regulation in the expression level of related POT genes (i.e., as least in kidney and brain).
In conclusion, our results are unique in demonstrating that under physiologic in vivo conditions PEPT2 is the predominant oligopeptide transporter in kidney and that it operates as an efflux transporter in choroid plexus. Moreover, renal PEPT2 alters the systemic concentrations of GlySar, which provide the driving force for distribution of dipeptide to important tissues and fluids (e.g., brain and CSF). The combined effort of PEPT2 in the kidney and brain may potentially influence the sensitivity or toxicity to peptide-like drugs. As a result, the rational design of new peptide-based pharmaceuticals may need to take into account the affinity of these agents for PEPT2 as well as the protein's expression in targeted tissues. Future studies will be directed at understanding the affect of PEPT2 on the pharmacokinetics and pharmacodynamics of neuropeptides and peptidomimetic drugs.
Footnotes
-
This work was supported in part by Grants R01 GM035498 (to D.E.S.) and R01 NS034709 and P01 HL018575 (to R.F.K.) from the National Institutes of Health. S.M.O. was supported by an American Foundation for Pharmaceutical Education Predoctoral Fellowship and by the Pharmacological Sciences Training Program of the National Institutes of Health Grant T32 GM007767.
-
Article, publication date, and citation information can be found at http://jpet.aspetjournals.org.
-
doi:10.1124/jpet.105.089359.
-
ABBREVIATIONS: PEPT, peptide transporter; POT, proton-coupled oligopeptide transporter; PHT, peptide/histidine transporter; CSF, cerebrospinal fluid; BCSFB, blood-cerebrospinal fluid barrier; GlySar, glycylsarcosine; GFR, glomerular filtration rate; PCR, polymerase chain reaction; ER, excretion ratio; AUC, area under the curve.
- Received May 10, 2005.
- Accepted June 23, 2005.
- The American Society for Pharmacology and Experimental Therapeutics


