


Abstract
To predict the magnitude of P-glycoprotein (P-gp)-based drug interactions at the human blood-brain barrier (BBB), rodent studies are routinely conducted where P-gp is chemically inhibited. For such studies to be predictive of interactions at the human BBB, the plasma concentration of the P-gp inhibitor must be comparable with that observed in the clinic. Therefore, we determined the in vivo EC50 of P-gp inhibition at the rat BBB using verapamil as a model P-gp substrate and cyclosporine A (CsA) as the model P-gp inhibitor. Under isoflurane anesthesia, male Sprague-Dawley rats were administered i.v. CsA to achieve pseudo steady-state CsA blood concentrations ranging from 0 to ∼12 μM. Then, an i.v. tracer dose of [3H]verapamil was administered, and 20 min after verapamil administration, the animals were sacrificed for determination of blood, plasma, and brain 3H radioactivity by scintillation counting. The percentage increase in the brain/blood 3H radioactivity (relative to 0 μM CsA) was described by the Hill equation with Emax, 1290%; EC50, 7.2 μM; and γ, 3.8. Previously, using [11C]verapamil, we have shown that the human brain/blood 11C radioactivity was increased by 79% at 2.8 μM CsA blood concentration. At an equivalent CsA blood concentration, the rat brain/blood 3H radioactivity was increased by a remarkably similar extent of 75%. This is the first time that an in vivo CsA EC50 of P-gp inhibition at the rat BBB has been determined and the magnitude of such inhibition was compared between the rat and the human BBB at the same blood CsA concentration.
The blood-brain barrier (BBB) modulates the entry of drugs and xenobiotics into the central nervous system (CNS). This barrier is composed of endothelial cells that form tight junctions. Therefore, hydrophilic drugs have limited capacity to enter the CNS, except by a carrier mechanism that can transport the drug across the BBB. Although lipophilic drugs are capable of readily diffusing across the BBB, several efflux transporters present in this barrier prevent or reduce the entry of these drugs into the CNS (Bart et al., 2000; Bendayan et al., 2002; Demeule et al., 2002; Golden and Pollack, 2003). A prominent one among these transporters is P-glycoprotein (P-gp), an ATP-binding cassette transporter encoded by the multidrug resistance 1 (MDR1) gene (Schinkel et al., 1996). Numerous studies in the P-gp knockout mouse model [mdr1ab(-/-)] have revealed that ablation of P-gp has a significant effect on absorption, distribution, and elimination of drugs, with the largest effect occurring on the distribution of drugs across the BBB and into the CNS. For example, compared with the wild-type mouse, the brain/blood concentration ratio of the anti-human immunodeficiency virus protease inhibitors nelfinavir, indinavir, and saquinavir are increased from 7- to 36-fold (Kim et al., 1998); anti-cancer taxanes, paclitaxel, and docetaxel are increased from 6- to 28-fold (Kemper et al., 2003, 2004a,b); and digoxin is increased 10-fold (Mayer et al., 1997), whereas that of verapamil is increased 8.5-fold (Hendrikse et al., 1998). Similar data have been obtained in mice and rats where P-gp has been chemically ablated with selective inhibitors of P-gp, such as PSC 833 (Valspodar), GF120918 (Elacridar), and LY335979 (Zosuquidar) (Kusuhara et al., 1997; Mayer et al., 1997; Kemper et al., 2003, 2004a,b). For example, the brain/blood ratio of verapamil is increased 9.6-fold when the rat is pretreated with cyclosporine A (CsA) (Hendrikse et al., 1998).
Although rodent studies make a compelling case for the importance of P-gp at the BBB in the CNS distribution of drugs, their ability to predict the magnitude of P-gp-based drug interactions at the human BBB has not been investigated. We postulate that the mdr1a/b(-/-) mouse or chemical ablation of P-gp at the rodent BBB are likely to overestimate the magnitude of clinically relevant P-gp-based interactions at the human BBB. To better predict such drug interactions, we propose that the concentration of the P-gp inhibitor used in the rodent studies be compared with that observed in the clinic. Therefore, we determined the in vivo EC50 of inhibition of P-gp activity at the rat BBB using verapamil as a model P-gp substrate and CsA as the model P-gp inhibitor. We then compared the magnitude of inhibition of P-gp at the rat and the human BBB at an identical blood CsA concentration. The human data were previously obtained in our laboratory (Sasongko et al., 2005) using virtually identical experimental protocol ([11C]verapamil as the P-gp substrate) as that used in the rat, with the exception that the brain distribution of [11C]verapamil radioactivity was quantified using the noninvasive but quantitative methodology, positron emission tomography (PET).
Materials and Methods
Materials. (±)-[3H]Verapamil (80 Ci/mmol) and [14C]sucrose (600 mCi/mmol) were purchased from American Radiolabeled Chemicals (St. Louis, MO). Cyclosporine A (Sandimune, 50 mg/ml) was purchased from Abbott Laboratories (Chicago, IL). Verapamil metabolites D617, D717, D702, and D703 were a gift from Abbott Laboratories (formally Knoll AG, Ludwigshafen, Germany). All other reagents were of the highest grade available from commercial sources.
Animals. Male Sprague-Dawley rats (∼8-10 weeks, ∼300 g) were purchased from Charles River Laboratories, Inc. (Wilmington, MA) and housed in a temperature- and humidity-controlled room with a 12-h light/dark cycle, with free access to food and water. The experimental protocol was approved by the Institutional Animal Care and Use Committee of the University of Washington. All experimental procedures were conducted according to the Guide for the Care and Use of Laboratory Animals (Institute of Laboratory Animal Resources, Commission on Life Sciences, National Research Council, Washington, DC, 1996).
Experimental Protocol. Under isoflurane anesthesia (5% induction, ∼1-1.5% maintenance at 1.0 l/min), each animal was cannulated in either the left or right femoral artery and vein. Anesthesia was maintained throughout the experiment. The anesthesia plane and the condition of the animal were evaluated by routine tail/toe-pinching test, respiration rate, and the palpebral reflex test. CsA (or saline) (0, 2.3, 5.0, 7.0, and 10.1 mg/kg in 0.1 ml) was administered as an i.v. bolus followed by a constant-rate i.v. infusion (0, 3.24, 6.48, 9.0, and 12.96 mg/kg/0.5 ml/h) via the femoral vein to achieve pseudo steady-state blood CsA concentration of 0, ∼3.0 (3.6), 6.0 (7.2), 8.3 (10), and 12.0 (14.4) μM (μg/ml), respectively. CsA blood samples (∼0.5 ml) were collected in heparinized tubes via the femoral artery at 0 (pre-CsA), 30, 45, 60, and 80 min. Hematocrit in each blood sample (∼50 μl) was determined immediately following each blood draw. At 60 min, a tracer i.v. bolus dose of [3H]verapamil (43 μCi/kg, 0.24 μg/kg) was administered via the femoral vein. At 79 min, a tracer i.v. bolus dose of [14C]sucrose (3.3 μCi/kg, 1.9 μg/kg), a brain vascular volume marker, was administered via the femoral vein. Immediately following the 80-min blood draw (i.e., 20 min after [3H]verapamil administration), the animal was sacrificed by decapitation and the brain was harvested. This time point was chosen to minimize the metabolism of verapamil and because previously reported studies (Hendrikse et al., 1998; Bart et al., 2003; Luurtsema et al., 2005) indicated that such a duration was adequate to reach pseudoequilibrium between the brain and plasma. Blood CsA concentrations were determined within 24 h by HPLC/UV (Laboratory of Medicine, University of Washington Medical Center), whereas the brain, blood, and plasma samples were stored at -20°C until analysis by HPLC and/or scintillation counting.
Blood and Brain Tissue Processing. Each blood sample (50 μl) was incubated at 50°C with 1 ml of Biolsol (National Diagnostics, Atlanta, GA) for 3 h in a 20-ml scintillation vial. Then, 30% H2O2 (300 μl) was added to the vial to bleach the solution. One hour later, scintillation fluid (10 ml) was added to the vial and stored at room temperature for 5 days to allow any chemical quenching to dissipate prior to scintillation counting. Previous experiments with blood samples spiked with known quantities of radioactivity showed that this time was sufficient to dissipate chemical quenching. Brain sample (0.7-1 g) was homogenized with PBS (100 μl of PBS per 100 mg of brain). The brain/PBS homogenate (200 μl) was then processed and counted as described above. All blood and brain samples were processed and counted in triplicate.
Metabolite Analysis. Nonradioactive standards of verapamil (5.6 ng/ml) and verapamil metabolites (D617, D717, D702, and D703; 2.0 ng/ml) were added to each brain/PBS homogenate (900 μl). The spiked homogenate was then precipitated with 1:1 acetonitrile followed by centrifugation at 20,800g and filtered through a 0.2-μm filter. The filtrate was then injected (500 μl) onto a Zorbax SB-C8 HPLC column (5 μm, 4.6 × 250 mm; Agilent Technologies, Palo Alto, CA) and eluted at 1 ml/min with a gradient mobile phase consisting of 100% acetonitrile (mobile phase A) and 30 mM ammonium acetate, pH 5.0 (mobile phase B). The gradient was adjusted linearly as follows: 25% A/75% B for the first 3 min, 35% A/65% B from 3 to 7 min, 50% A/50% B from 7 to 12 min, maintained at this composition from 12 to 20 min, and then 90% A/10% B from 20 to 20.5 min to rapidly elute any highly retained peaks. Then, from 20.5 to 21 min, the gradient was reduced linearly to 25% A/75% B and was subsequently maintained at this composition up to 25 min for re-equilibration. The nonradioactive spiked standards were detected at 229 nm. Fractions of HPLC effluent were collected at 1-min intervals over 25 min to separate verapamil and its metabolites that had retention times of 9.5 (D617), 12 (D717), 17 (D702/D703), and 20 (verapamil) min. The collected factions were counted using a scintillation counter.
Each plasma sample (850 μl) was spiked with nonradioactive standards of verapamil and verapamil metabolites (same concentrations as the brain homogenate), precipitated with 1:1 acetonitrile, centrifuged at 20,800g, and then filtered through a 0.2-μm filter. The filtrate (500 μl) was then analyzed by HPLC, and the fractions were collected for counting as described above. Metabolite content in blood was not determined because of limited sample volume and the analytical challenge for conducting such analysis.
Data Analysis. The average of CsA blood concentration at 60 and 80 min after beginning CsA infusion was computed for each animal and averaged across the animals studied. This value (mean ± S.D.) is henceforth referred to as the pseudo steady-state blood CsA concentration. The brain/blood ratio of total 3H radioactivity was adjusted for vascular contamination. The vascular volume (microliters per gram) was calculated as the ratio of the [14C]sucrose radioactivity per gram of brain and the [14C]sucrose radioactivity per milliliter of blood (Fenstermacher et al., 1981). The brain/plasma ratio of [3H]verapamil or the 3H-metabolites was also computed. Using nonlinear regression (WinNonlin; Pharsight, Mountain View, CA), the Hill equation was fit to the percentage increase in the brain/blood ratio of total 3H radioactivity or brain/plasma ratio of [3H]verapamil as a function of blood CsA concentration. Unless otherwise stated, data are presented as mean ± S.D. Student's t test or analysis of variance was used to determine the statistical significance of difference (p < 0.05) between experimental groups.
Comparison with Previously Published Human Data. We have previously published a study (Sasongko et al., 2005) in which we determined the inhibition of [11C]verapamil P-gp transport across the human BBB by CsA. In this study, we used the same experimental conditions as those employed in the above rat study, with the exception that the distribution of 11C radioactivity in the brain was measured at a single pseudo steady-state blood CsA concentration of 2.8 μM using PET. In brief, [11C]verapamil (∼0.2 mCi/kg) was administered to healthy volunteers (n = 12, six females and six males) as an IV infusion over ∼1 min before and after at least 1-h infusion of CsA (2.5 mg/kg/h). Arterial blood samples and brain PET images were obtained at frequent intervals over 45 min. Both blood and plasma radioactivity contents were determined in each verapamil sample. The content of verapamil and its metabolites in each plasma sample were determined by a rapid solid-phase extraction method. The brain uptake of 11C radioactivity (brain/blood at 45 min) was determined in the presence and absence of CsA. For additional details on the methods, see Sasongko et al. (2005).
Results
Changes in CsA blood concentration did not significantly affect the estimate of the brain vascular volume (data not shown); therefore, data from all of the CsA groups were pooled and compared with data obtained in the absence of CsA (control). Estimate of the brain vascular volume in the CsA (24.4 ± 9 μl/g) and the control (26.3 ± 10 μl/g) groups were not significantly different. The blood/plasma ratio of total 3H radioactivity ([3H]verapamil and 3H-metabolites) was 0.75 ± 0.1 and was independent of CsA blood concentration (data not shown).
Except at the highest CsA infusion rate, the targeted pseudo steady-state blood CsA concentrations were achieved during the 20-min period after [3H]verapamil administration. These concentrations were 2.9 ± 0.3 (n = 5), 5.8 ± 0.2 (n = 5), 9.3 ± 1.7 (n = 5), and 17.3 ± 3.2 (n = 6) μM at infusion rates of 3.24, 6.48, 9.0, and 12.96 mg/kg/0.5 ml/h, respectively (Fig. 1). The highest blood CsA concentration achieved (17.3 ± 3.2 μM) differed from the expected (12 μM), most probably because of nonlinearity in the pharmacokinetics of CsA.

Pseudo steady-state blood CsA concentrations were achieved by 60 min after an i.v. loading dose of CsA followed by an i.v. infusion of CsA. Sixty minutes after beginning CsA dosing, [3H]verapamil was administered, and the animals were sacrificed at 80 min (i.e., 20 min after [3H]verapamil administration). The value of n represents the number of animals studied per CsA blood concentration.
At 20 min post-[3H]verapamil administration, the brain/blood 3H radioactivity (corrected for vascular volume) was 0.79 ± 0.1 (n = 10), 1.39 ± 0.2 (n = 5), 2.87 ± 0.4 (n = 5), 7.06 ± 0.6 (n = 5), and 9.19 ± 1.4 (n = 6) at 0, 2.9, 5.8, 9.3, and 17.3 μM blood CsA concentration, respectively (Fig. 2). The percentage increase in the brain/blood 3H radioactivity, expressed relative to that in the control group (absence of CsA), increased as the blood CsA concentration increased and appeared to reach a plateau at blood CsA greater than 15 μM (Fig. 3A). The Hill equation (Fig. 3A) was fit to these data using nonlinear regression (uniform weighting) and yielded the following estimates (percent CV of the estimate): Emax, 1290% (7.1%); EC50, 7.2 μM (7.3%); and γ, 3.8 (22.5%).
Although the brain/blood ratio for the 3H radioactivity was significantly increased by CsA, the total 3H radioactivity in the blood or plasma was independent of blood CsA concentration (data not show). Furthermore, CsA did not significantly (p > 0.05) affect [3H]verapamil content in the plasma at 20 min post-[3H]verapamil administration (46.6 ± 8.7, 46.8 ± 8.9, 46.7 ± 7.6, 40.9 ± 6.6, and 38.6 ± 8.7% of total plasma radioactivity at 0, 2.9, 5.8, 9.3, and 17.3 μM blood CsA concentrations, respectively). 3H-Radiolabeled D617, D717, and D702/D703 (Fig. 4) concentrations in the plasma were below those that could be quantified with confidence. Due to high structural similarity, metabolites D702 and D703 could not be chromatographically separated and, therefore, are reported as combined fractions. An appreciable amount of unidentified 3H-metabolite(s) was measured in the plasma. These unidentified 3H-metabolite(s) collectively had a retention time of approximately 3 min and eluted as a relatively broad peak (2-5 min). This metabolite(s) is henceforth referred to as the unknown 3H-metabolite(s). The plasma content of this unknown 3H-metabolite(s) was not significantly (p > 0.05) affected by CsA (47.7 ± 9.9, 45.9 ± 11.3, 46.1 ± 8.3, 50.7 ± 6.1, and 52.8 ± 8.4% of total plasma radioactivity at 0, 2.9, 5.8, 9.3, and 17.3 μM blood CsA concentrations, respectively).
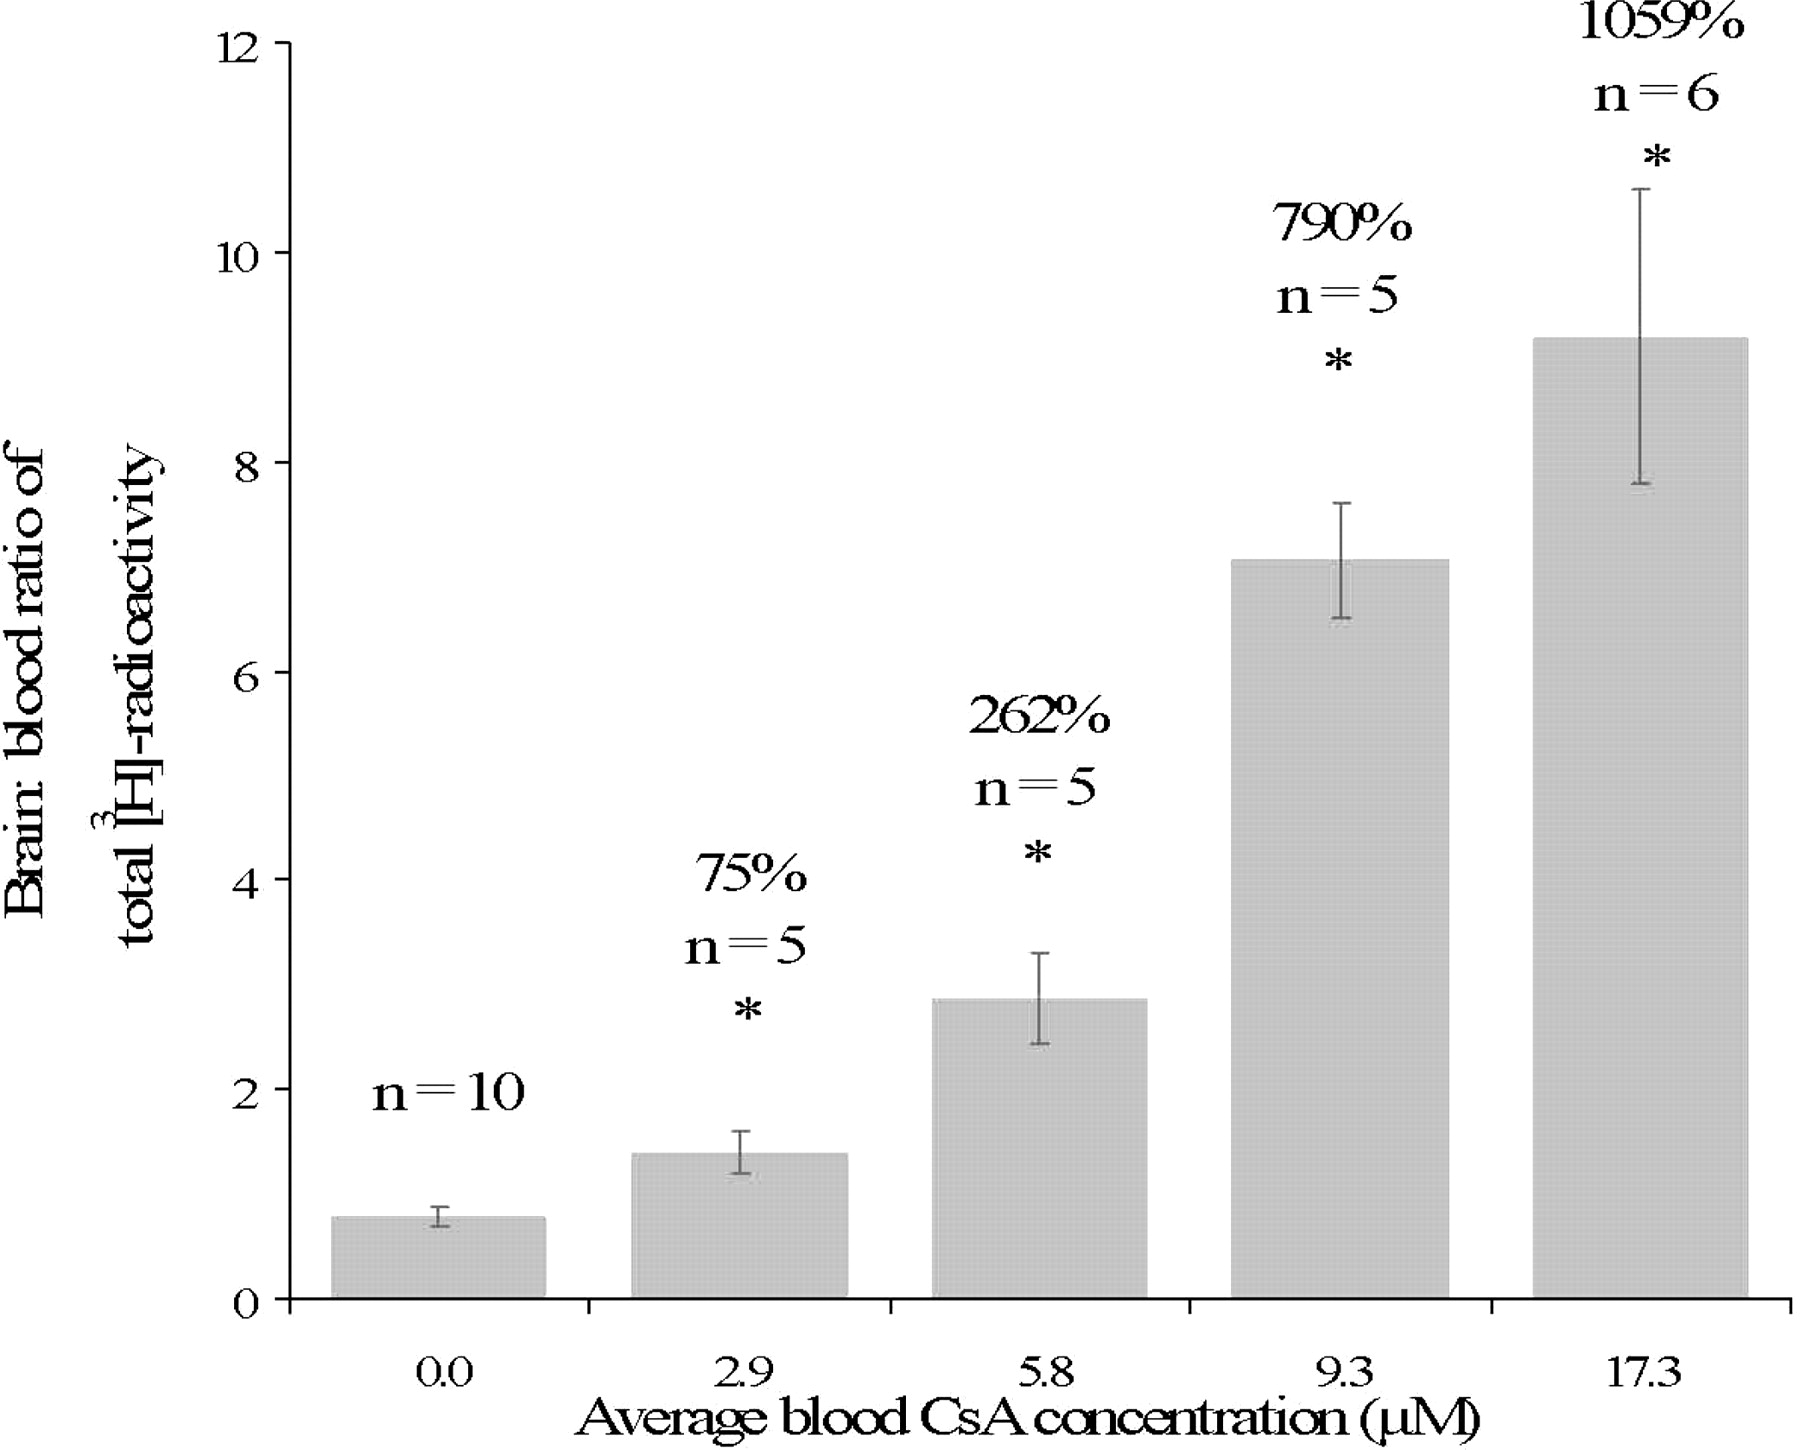
Brain/blood total 3H radioactivity at increasing pseudo steady-state blood CsA concentration. The average percentage increases in brain/blood 3H radioactivity for each CsA groups, relative to the absence of CsA, are listed above each histogram bar. These values, determined at 20 min after [3H]verapamil administration, increased as the pseudo steady-state blood CsA concentration increased; *, p < 0.05 compared with the control group, 0 μM CsA. The value of n represents the number of animals studied per CsA blood concentration.

A, the Hill equation was fitted to the percentage increase in brain/blood 3H radioactivity, expressed relative to that in the control group (absence of CsA) (data shown in Fig. 2). This increase reached a plateau comparable with previously published value in the mdr1a (-/-) mice (Hendrikse et al., 1998). At an equivalent blood CsA concentration (∼3 μM), there is a remarkable agreement between the rat and humans (denoted by the square) in the percentage increase in the brain/blood 3H radioactivity. The estimates of the Hill equation parameters were Emax, 1290% (7.1%); EC50, 7.2 μM (7.3%); and γ, 3.8 (22.5%). The values in parentheses are percentage CV of the estimates. B, percent increase in brain/plasma [3H]verapamil, expressed relative to that in the control group (absence of CsA), increased as the pseudo steady-state blood CsA concentration increased. The fitted curve is mathematically described by the Hill equation with Emax, 2630% (7.1%); EC50, 7.9 μM (7.1%); and γ, 3.7 (19.7%). The values in the parentheses are percentage CV of the estimates.
In the absence of CsA and 20 min post-[3H]verapamil administration, the brain content of [3H]verapamil and the unknown 3H-metabolite(s) was 46.3 ± 9.7 and 45.8 ± 10.9%, respectively. As expected, the increase in brain 3H radioactivity content produced by CsA was predominantly due to a significant (p < 0.05) increase in the brain [3H]verapamil content (Fig. 5). The percentage increase in the brain/plasma [3H]verapamil, expressed relative to that in the control group, increased as the blood CsA concentration increased. The fit of the Hill equation to these data, using nonlinear regression (uniform weighting; Fig. 3B), resulted in the following estimates (percentage CV of the estimate): Emax, 2630% (7.1%); EC50, 7.9 μM (7.1%); and γ, 3.7 (19.7%). In contrast to [3H]verapamil, the brain content of the unknown 3H-metabolite(s) was not significantly altered by CsA (p > 0.05) but that of [3H]D702/D703 increased as blood CsA concentration increased (Fig. 5, inset). The latter was not expressed as brain/blood ratio because the blood concentrations of D702/D703 were negligible and could not be determined with confidence. The brain concentrations of the other metabolites (D617 and D717) were below those that could be quantified with confidence.
We compared the above total 3H radioactivity data obtained in the rat with those we obtained previously in our human study. To do so, we computed the human brain/blood 11C radioactivity concentration at a single time point of 45 min. We chose this time point for comparison because the plasma content of known P-gp substrates (verapamil and metabolites) in human plasma (58.3 ± 13.7% of the total 11C radioactivity) at 45 min is close to that observed in the rat plasma at 20 min (46.6 ± 8.7% of the total 3H radioactivity). In the absence of CsA, the brain/blood radioactivity ratio in the human (0.79 ± 0.19) and the rat (0.79 ± 0.09) was found to be virtually identical. In addition, at a comparable CsA blood concentration (∼3 μM), this brain/blood radioactivity increased in the human and rat to 1.40 ± 0.39 and 1.39 ± 0.20, respectively (Fig. 6). This translates into an increase in the brain/blood radioactivity of 79 and 75% in humans and rats, respectively. The human data presented here differ slightly from those published earlier (Sasongko et al., 2005), because they are ratios of brain/blood radioactivity at a single time point (45 min), whereas those published earlier are area under the curve brain/area under the curve blood ratios at 45 min.
Discussion
Prior studies have suggested that the combined use of verapamil and CsA as P-gp substrate and inhibitor, respectively, would be ideal for measurement of P-gp transport across the rat and human BBB (for details, see Sasongko et al., 2005). Although the metabolism of verapamil is stereoselective (Nelson et al., 1988; Bhatti and Foster, 1997), its transport by P-gp is not (Luurtsema et al., 2003). For this reason and because our measure is brain/blood ratio of radioactivity, the use of the racemic verapamil does not in any way confound the interpretation of our data.
In our study, the lack of difference in brain vascular volume in the absence and presence of CsA indicated that the integrity of the BBB was not compromised by CsA. Our values of the rat brain vascular volume are similar to those previously reported (Brown et al., 1997). Because the vascular content of the brain was only 2 to ∼4%, vascular volume correction of the brain/blood 3H radioactivity ratio or the brain/plasma [3H]verapamil ratio produced only minor changes in the values of these ratios.
The brain/blood total 3H radioactivity was significantly increased by CsA (Fig. 2), indicating that CsA is capable of inhibiting P-gp-mediated efflux of verapamil-associated radioactivity across the rat BBB. CsA inhibited P-gp at the rat BBB with an EC50 of 7.2 μM (Fig. 3A). The maximal increase in brain/blood total 3H radioactivity produced by CsA was comparable with that found by others in the mdr1a/b(-/-) mice (Hendrikse et al., 1998), indicating that greater than 15 μM blood CsA concentration is necessary to produce chemical knockout of P-gp at the rat BBB. Since the brain/blood ratio of 3H radioactivity includes verapamil metabolites, we also determined the contents of [3H]verapamil and [3H]verapamil metabolites in both plasma and brain.
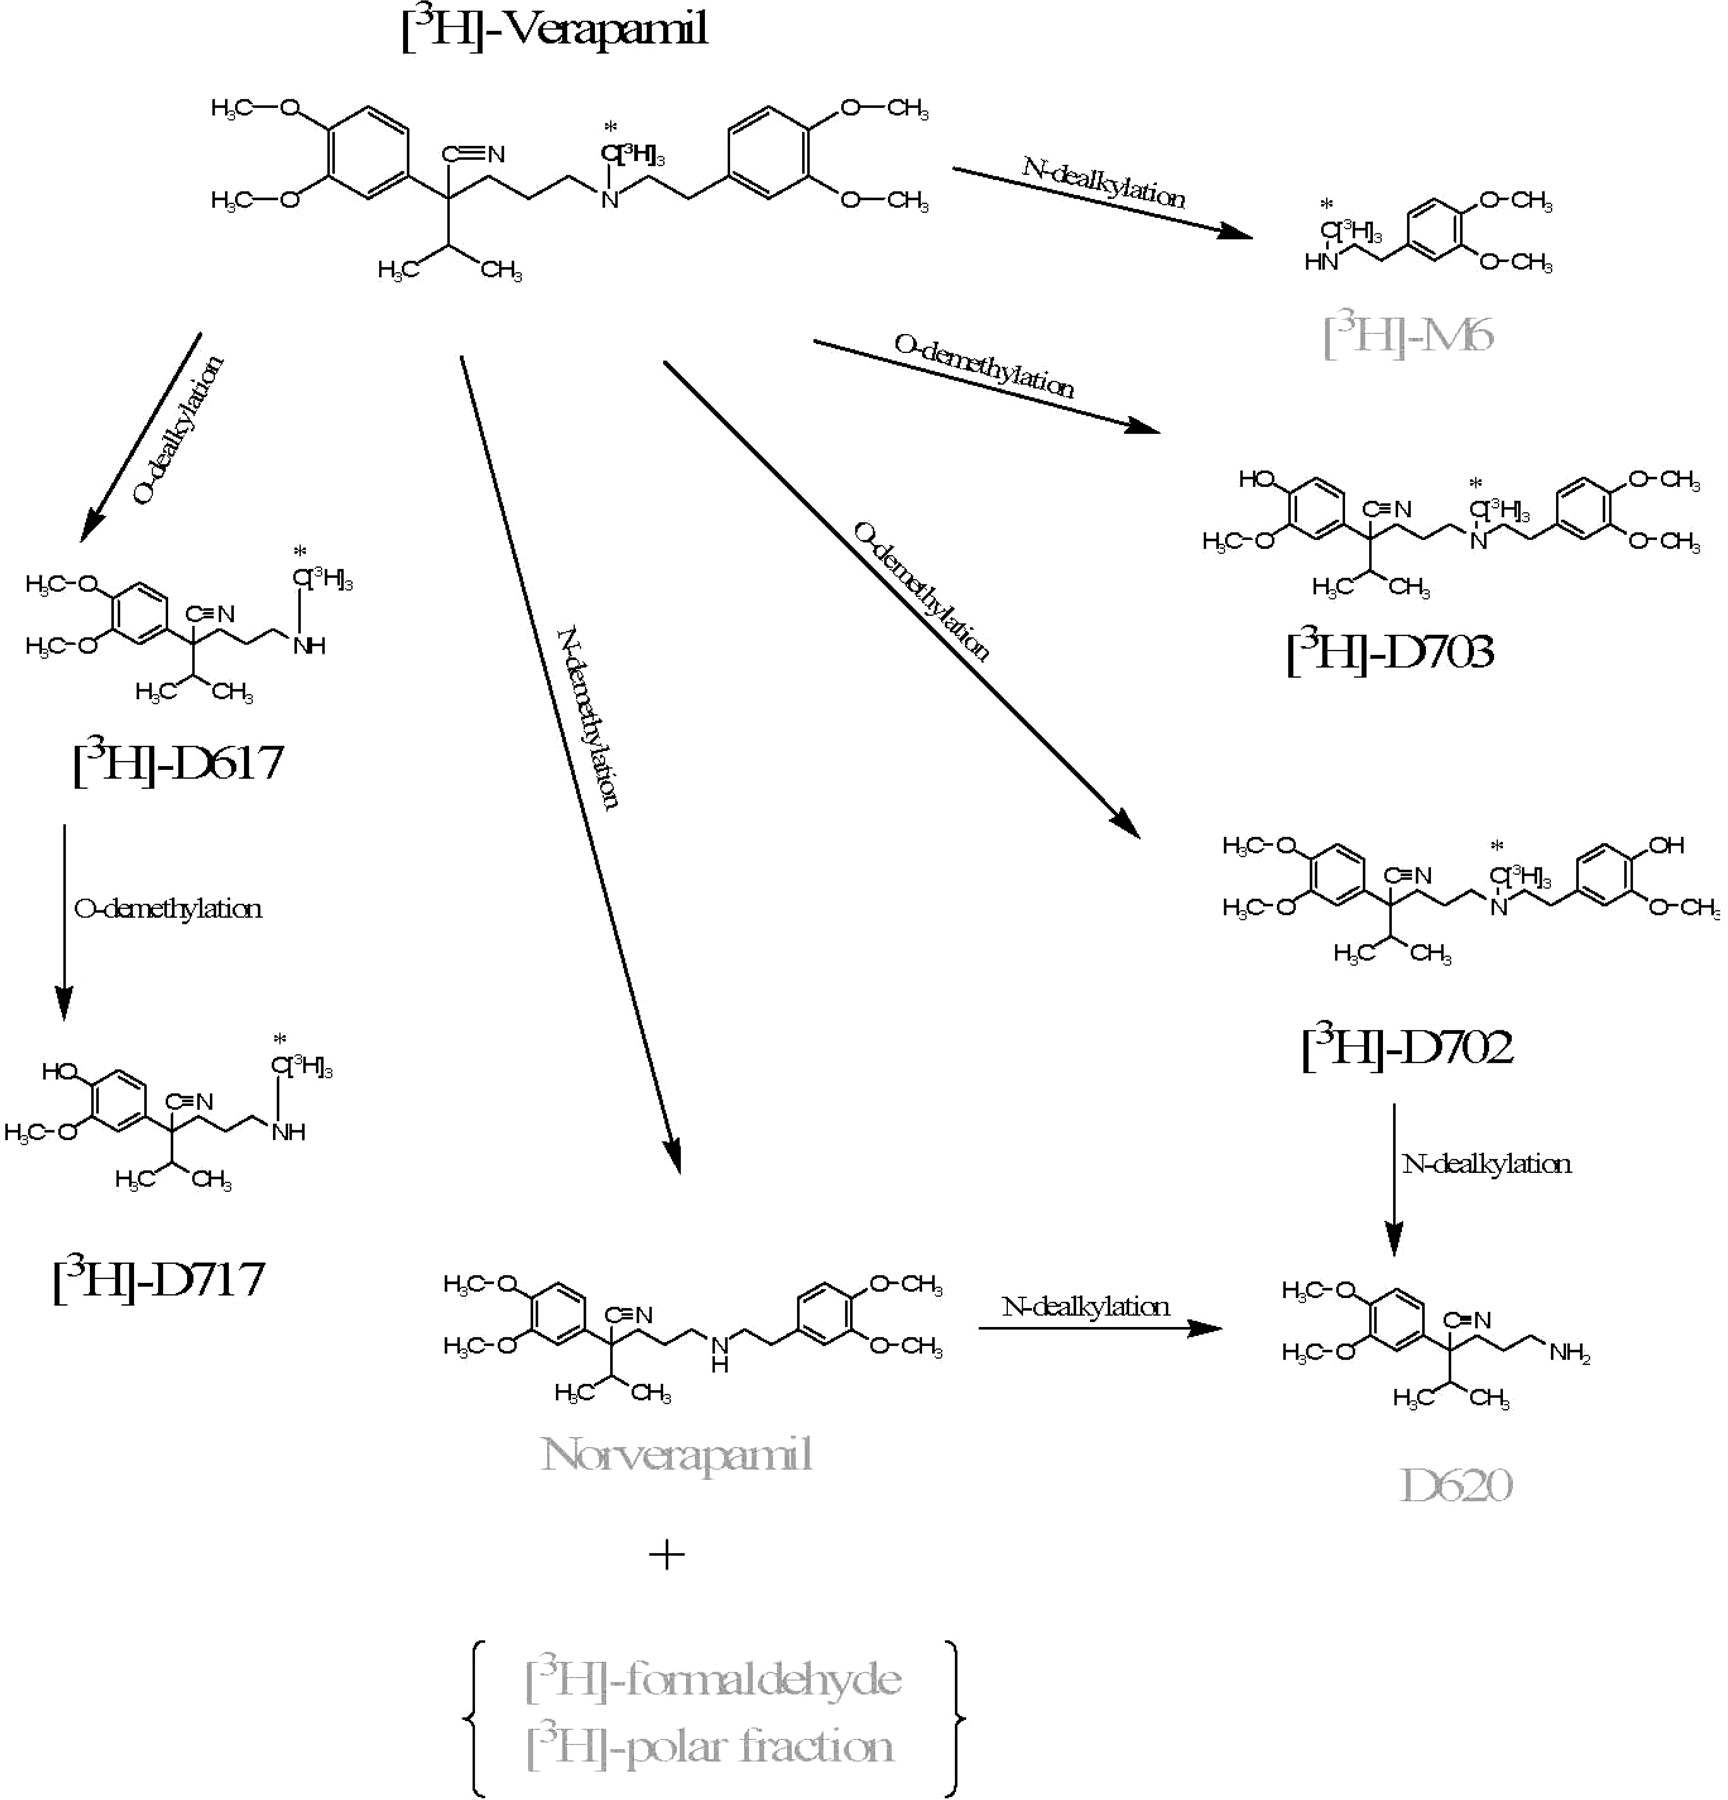
Metabolic pathways of verapamil in humans. The label is denoted with an asterisk. Labeled in gray are metabolites not detectable in this study, either due to loss of the label or unavailability of the standard.
In the rat plasma, we detected small quantities of D617, D717, D702, and D703 (Fig. 4), but these concentrations were too low to determine with confidence. In contrast, the contribution of an unknown metabolite(s) was significant. The identity of this metabolite(s) is not known, because it did not correspond to any of the standards of verapamil metabolites in our possession (D617, D717, and D702/D703; Fig. 4). Since CYP3A enzymes are involved in metabolism of both verapamil and CsA, alteration in verapamil metabolism due to CsA was possible. However, in our study, the plasma verapamil or metabolite profiles did not change in the presence of CsA, indicating that CsA does not inhibit the metabolism of verapamil. This observation is consistent with that obtained in our human study (Sasongko et al., 2005). The brain verapamil and D702/D703 content increased as blood CsA concentration increased (Fig. 5, inset). In contrast, the brain content of the unknown metabolite was unaffected by CsA (Fig. 5, inset). These data indicate that D702/D703 are P-gp substrates, whereas the unknown metabolite is not. Others have also shown that D702 and D703 are P-gp substrates (Luurtsema et al., 2005) as are D617 and D717 (Pauli-Magnus et al., 2000).
Determination of brain and plasma [3H]verapamil content allowed us to compute and model the change in brain/plasma [3H]verapamil ratio with change in CsA blood concentration. Interestingly, CsA inhibited the P-gp-mediated efflux of [3H]verapamil from the brain with an EC50 (7.9 μM) comparable with that obtained when only total 3H radioactivity was considered (7.2 μM). This close agreement between total 3H radioactivity and [3H]verapamil is not surprising because the unknown metabolite is not a P-gp substrate and the only other metabolites found in the brain, D702/D703, were in a small quantity and are P-gp substrates (Luurtsema et al., 2005). Thus, the magnitude of inhibition of their efflux from the brain is unlikely to be different from that of verapamil.

At 20 min post-[3H]verapamil administration, the brain [3H]verapamil or [3H]D702/D703 (see inset) content, but not that of the unknown 3H-metabolite(s), was significantly affected by CsA. Data are expressed as mean ± S.D. and were analyzed by the Student's t test; *, p < 0.05 compared with the corresponding control group, 0 μM CsA. The value of n represents the number of animals studied per CsA blood concentration.

At identical pseudo steady-state CsA blood concentrations of 0 and ∼3 μM, the brain/blood ratios of total 3H radioactivity in the rat (gray bars, n = 15) are virtually identical to that previously obtained by us in humans (open bars; n = 12) using PET. The numerical values of the percentage increase in brain/blood total 3H radioactivity (relative to the absence of CsA) produced by pseudo steady-state CsA blood concentrations of ∼3 μM are listed above the histogram bars. The value of n represents the number of animals studied per CsA blood concentration.
In drug development, mice and rats are frequently used as animal models in preclinical studies. For example, in evaluating the distribution of drugs into the CNS, high-affinity P-gp substrates, which are efficiently effluxed from the CNS, are often discarded from further drug development. It is assumed that such drugs will be efficiently effluxed by P-gp at the human BBB and therefore unlikely to achieve pharmacologically effective concentrations in the human brain. Furthermore, if the candidate drug is found during development to be an excellent P-gp substrate, there is concern that there will be significant drug-drug interactions with such a drug, resulting in increased distribution of the drug into the human brain and significant neurological toxicity. Such an extrapolation from rodents to human is based on the assumption that P-gp activity at the mouse or the rat BBB is representative of that at the human BBB. It is also assumed that the magnitude of P-gp inhibition at the mouse or rat BBB by drugs that are P-gp inhibitors (e.g., CsA, the azoles, or the macrolides) is also predictive of inhibition of P-gp at the human BBB. Often, the increase in CNS distribution of the candidate drug in the P-gp knockout mouse is viewed as representative of the “worst” case scenario of a drug-drug interaction where P-gp activity at the BBB is completely ablated.
We propose that the mdr1a/b(-/-) mouse or chemical ablation of P-gp at the rodent BBB overestimate the magnitude of clinically relevant P-gp-based interaction at the human BBB. To better predict such drug interactions, the concentration of the P-gp inhibitor used in the rodent studies must be comparable with that observed in the clinic. The data presented above show that, at clinical CsA blood concentration (0.13-0.34 μM) (Rowland and Tozer, 1995), the inhibition of P-gp at the rat BBB is modest and that concentrations as high as 7 μM are required to produce significant inhibition (∼50%) of P-gp activity at the rat BBB. Given that CsA is one of the most potent inhibitors on the market (relative to the plasma concentrations achieved at therapeutic doses), it is unlikely that other drugs will produce a greater inhibition of P-gp at the rat BBB than CsA at therapeutic concentrations of those drugs.
To date, there are no data available to compare P-gp activity at the rodent and human BBB or to compare between these two species the magnitude of P-gp inhibition at the BBB by a known P-gp inhibitor. The lack of such data is not surprising, because hitherto it was impossible to measure P-gp activity at the human BBB. Recently, we have developed a noninvasive PET method to determine P-gp at the human BBB and the ability of CsA to inhibit such activity (Sasongko et al., 2005). This method uses [11C]verapamil as the P-gp substrate and CsA as the P-gp inhibitor. In the absence of CsA, the brain/blood radioactivity ratio in the human (0.79 ± 0.19) and the rat (0.79 ± 0.09) was found to be virtually identical. In addition, at a comparable CsA blood concentration (∼3 μM), this brain/blood radioactivity increased in the human and rat to 1.40 ± 0.39 and 1.39 ± 0.20, respectively (Fig. 6). This translates into an increase in the brain/blood radioactivity of 79% and 75% in humans and rats, respectively.
This remarkable agreement between human and rat BBB P-gp activity, in the absence of CsA, suggests that the rat appears to be a suitable animal model to predict P-gp activity at the human BBB. In addition, at a comparable CsA concentration of 3 μM, the inhibition of P-gp activity at the human and the rat BBB was virtually identical. This agreement was obtained despite the fact that verapamil is metabolized. Therefore, the brain/blood partition coefficient of the nontransported unknown metabolite(s) in the rat and the human must be comparable. This promising agreement between human and rat needs to be confirmed by additional studies in both species with other P-gp inhibitors (e.g., quinidine, the azoles, and clarithromycin) and P-gp substrates (e.g., [11C]loperamide).
The data presented here have important implications for both drug development and the use of CsA as a P-gp inhibitor to overcome the P-gp efflux barrier. In the first, our data suggests that concentrations of CsA much higher (>15 μM) than those achieved at clinical doses (less than 1 μM) will need to be administered to overcome the P-gp efflux barrier in either resistant tumor cells or at the BBB. However, administration of such high doses of CsA to humans would be unethical due to potential nephrotoxicity of CsA (Mourad et al., 1998; Li et al., 2004). To overcome this limitation, more potent third generation P-gp inhibitors, such as PSC 833 (Valspodar), LY-335979 (Zosuquidar), XR9576 (Tariquidar), and VX710 (Biricodar), will need to be used. At the same time, the data presented here also suggest that P-gp-based drug interactions at the human BBB at therapeutic CsA blood concentrations are unlikely. Second, our data would suggest that the use of the rat as preclinical model to estimate the distribution of drugs (P-gp substrates) across the human BBB appears to be promising. In conclusion, this is the first in vivo study to determine an in vivo CsA EC50 of inhibition of P-gp transport activity at the rat BBB. In addition, this is the first time that the rodent and human P-gp activity at the BBB has been compared in the absence and the presence of an identical blood concentration of a P-gp inhibitor.
Footnotes
-
This work was supported by National Institutes of Health Grants MH063641 and GM32165.
-
Article, publication date, and citation information can be found at http://jpet.aspetjournals.org.
-
doi:10.1124/jpet.105.097931.
-
ABBREVIATIONS: BBB, blood-brain barrier; CNS, central nervous system; P-gp, P-glycoprotein; CsA, cyclosporine A; PET, positron emission tomography; D617, 3,4-dimethoxy-α-[3-(methylamino)propyl]-α-(1-methylethyl)benzeneacetonitrile; D717, 4-hydroxy-3-methoxy-α-[3-(methylamino)propyl]-α-(1-methylethyl)benzeneacetonitrile; D702, α-[3-[[2-(4-hydroxy-3-methoxyphenyl)ethyl]methylamino]propyl]-3,4-dimethoxy-α-(1-methylethyl)benzeneacetonitrile; D703,α-[3-[[2-(3,4-dimethoxyphenyl)ethyl]methylamino]propyl]-4-hydroxy-3-methoxy-α-(1-methylethyl)benzeneacetonitrile; HPLC, high-performance liquid chromatography; PBS, phosphate-buffered saline.
- Received October 31, 2005.
- Accepted January 11, 2006.
- The American Society for Pharmacology and Experimental Therapeutics


