


Abstract
Methadone is administered as a racemate, although opioid activity resides in the R-enantiomer. Methadone disposition is stereoselective, with considerable unexplained variability in clearance and plasma R/S ratios. N-Demethylation of methadone in vitro is predominantly mediated by cytochrome P450 CYP3A4 and CYP2B6 and somewhat by CYP2C19. This investigation evaluated stereoselectivity, models, and kinetic parameters for methadone N-demethylation by recombinant CYP2B6, CYP3A4, and CYP2C19, and the potential for interactions between enantiomers during racemate metabolism. CYP2B6 metabolism was stereoselective. CYP2C19 was less active, and stereoselectivity was opposite that for CYP2B6. CYP3A4 was not stereoselective. With all three isoforms, enantiomer N-dealkylation rates in the racemate were lower than those of (R)-(6-dimethyamino-4,4-diphenyl-heptan-3-one) hydrochloride (R-methadone) or (S)-(6-dimethyamino-4,4-diphenyl-heptan-3-one) hydrochloride (S-methadone) alone, suggesting an enantiomeric interaction and mutual metabolic inhibition. For CYP2B6, the interaction between enantiomers was stereoselective, with S-methadone as a more potent inhibitor of R-methadone N-demethylation than R-of S-methadone. In contrast, enantiomer interactions were not stereoselective with CYP2C19 or CYP3A4. For all three cytochromes P450, methadone N-demethylation was best described by two-site enzyme models with competitive inhibition. There were minor model differences between cytochromes P450 to account for stereoselectivity of metabolism and enantiomeric interactions. Changes in plasma R/S methadone ratios observed after rifampin or troleandomycin pretreatment in humans in vivo were successfully predicted by CYP2B6- but not CYP3A4-catalyzed methadone N-demethylation. CYP2B6 is a predominant catalyst of stereoselective methadone metabolism in vitro. In vivo, CYP2B6 may be a major determinant of methadone metabolism and disposition, and CYP2B6 activity and stereoselective metabolic interactions may confer variability in methadone disposition.
The chiral opioid methadone, a mainstay in the treatment of opiate addiction and acute and chronic pain, is used clinically as a racemate, although opioid activity resides in the R-enantiomer. Methadone disposition is stereoselective; there is considerable interindividual variability in clearance (up to 100-fold) and plasma R/S ratios (4-fold), and methadone clearance is subject to numerous drug interactions (Plummer et al., 1988; Eap et al., 2002). Nevertheless, the mechanism of stereoselective clearance and metabolism and interindividual variability remains poorly understood. Methadone elimination is due mainly to metabolic clearance (Anggard et al., 1975). The main pathway of methadone metabolism is N-demethylation to inactive 2-ethylidine-1,5-dimethyl-3,3-diphenylpyrrolidine (EDDP). A minor reductive route to normethadol is not cytochrome P450-mediated. The significant correlation between methadone clearance and the plasma EDDP/methadone area under the curve ratios suggest that N-demethylation, at least in part, determines clinical methadone clearance (De Vos et al., 1995).
Methadone N-demethylation in human liver microsomes and in vivo has historically been attributed to CYP3A4 (Iribarne et al., 1996; Moody et al., 1997; Foster et al., 1999; Shinderman et al., 2003; Wang and DeVane, 2003). More recently, in vitro experiments at therapeutic concentrations have shown a predominant role for CYP2B6 (Gerber et al., 2004; Kharasch et al., 2004; Totah et al., 2004) and minor activity with CYP2C19 (Foster et al., 1999; Gerber et al., 2004). The first clinical evaluation of P450 involvement in human methadone disposition using isoform-selective probes failed to support a role for CYP3A but did suggest a role for CYP2B6 (Kharasch et al., 2004).
Less information exists about stereoselective methadone metabolism. N-Demethylation by CYP2B6 appears to be stereoselective (Gerber et al., 2004; Totah et al., 2004), whereas CYP3A4 has been reported to be stereoselective (Wang and DeVane, 2003) or not (Foster et al., 1999; Gerber et al., 2004; Totah et al., 2004). Methadone enantiomer N-demethylation at clinically relevant concentrations by recombinant CYP2B6, CYP3A4, and CYP2C19 was S > R, S = R, and S ≪ R, respectively, with CYP2B6 and CYP3A4 most active (Totah et al., 2004). Preliminary evaluation suggested the appearance of a metabolic interaction between the two methadone enantiomers in CYP2B6-catalyzed N-demethylation.
Metabolic enantiomeric interactions arise when one enantiomer affects the metabolism and clearance of its antipode. Possible explanations include enantiomeric competition for metabolism by the same enzyme and active site, enantioselective binding to the enzyme with metabolism at different rates, or allosteric inhibition when one enantiomer binds elsewhere than the active site and is not a substrate. Enantiomeric interactions may have increased clinical consequence when only one of the enantiomers is pharmacologically active and can complicate the pharmacokinetics of the racemate drug. Stereoselective and nonstereoselective enantiomeric interactions have been previously observed during metabolism mediated by cytochrome P450 enzymes. For example, during the metabolism of racemic warfarin by CYP2C9, the less active R-warfarin inhibits the metabolism of the more active S-enantiomer (Kunze et al., 1991). In addition, R-propafenone is a more potent inhibitor of S-propafenone metabolism during the CYP2D6-catalyzed 5-hydroxylation reaction (Kroemer et al., 1991).
Previous investigations of methadone N-demethylation, primarily evaluating racemic methadone metabolism but also more recently methadone enantiomer metabolism, have used a Michaelis-Menten model (Oda and Kharasch, 2001; Wang and DeVane, 2003; Gerber et al., 2004). However, enantiomeric interactions can be characterized and kinetic parameters can be determined only if the metabolism of the enantiomers and the racemate are measured. If there are metabolic enantiomeric interactions between (R)-(6-dimethyamino-4,4-diphenyl-heptan-3-one) hydrochloride (R-methadone) and (S)-(6-dimethyamino-4,4-diphenyl-heptan-3-one) hydrochloride (S-methadone), particularly if these are isoform-selective, methadone metabolism would be more complex than previously appreciated and simple Michaelis-Menten models might not be appropriate. Therefore, the purpose of this investigation was to test the hypothesis that there are enantiomeric interactions in methadone N-demethylation in vitro and to evaluate fully the stereoselective metabolism of methadone by CYP2B6, CYP3A4, and CYP2C19. Kinetic models were developed that incorporated the stereoselective metabolism of methadone and competitive stereoselective enantiomeric inhibition. The models were used to predict the effect of CYP3A inhibition and rifampin induction on plasma R/S-methadone ratios observed clinically.
Materials and Methods
Materials. (RS)-(6-Dimethyamino-4,4-diphenyl-heptan-3-one) hydrochloride (RS-methadone; 1:1 enantiomeric ratio by liquid chromatography/mass spectrometry) and (S)-(6-dimethyamino-4,4-diphenyl-heptan-3-one) hydrochloride (S-methadone; 99% enantiomeric excess) were purchased from Sigma (St. Louis, MO). (R)-(6-Dimethyamino-4,4-diphenyl-heptan-3-one) hydrochloride (R-methadone; 99% enantiomeric excess) was purchased from Sigma/RBI (Natick, MA). (±)-2-Ethyl-1,5-dimethyl-3,3-diphenylpyrrolimium perchlorate (EDDP) and [ethyl-2′,2′,2′-2H3]-3,3-diphenyl-2-ethyl-5-methyl-1-pyrroline hydrochloride (d3-EDDP) were obtained from the National Institute on Drug Abuse through Research Triangle Institute (Research Triangle Park, NC). High-performance liquid chromatography-grade methanol was purchased from Fisher Scientific (Pittsburgh, PA). Baculovirus-insect cell microsomes (Supersomes) containing expressed CYP3A4, CYP2B6, and CYP2C19, with coexpressed human cytochrome P450 reductase, and human cytochrome b5 were purchased from BD Gentest Corporation (Woburn, MA). All stock drug solutions, buffers, and high-performance liquid chromatography mobile phase were prepared using Milli-Q grade water (Millipore, Bedford, MA).
Incubation Conditions. All incubations were carried out in 96-well plates and contained 100 mM potassium phosphate buffer, pH 7.4, enzyme (10 pmol/ml CYP3A4 and CYP2B6 or 20 pmol/ml CYP2C19), and RS-, R-, or S-methadone and were preincubated at 37°C for 5 min. The reaction was initiated by adding an NADPH-regenerating system (final concentrations: 10 mM glucose 6-phosphate, 1 mM β-NADP, 1 U/ml glucose-6-phosphate dehydrogenase, and 5 mM magnesium chloride, preincubated at 37°C for 10 min to preform NADPH). Incubations were quenched with 15% zinc sulfate or 20% trichloroacetic acid and internal standard added (d3-EDDP, 250 ng/ml) (both quench and internal standard were added at 10% of the final incubation volume) and placed on ice before centrifugation for 10 min at 1800g. The supernatant was transferred to a clean 450-μl conical bottom plate for analysis of EDDP by liquid chromatography/mass spectrometry using selected ion monitoring as described previously (Kharasch et al., 2004) with minor changes. The samples were injected (5 μl) directly onto the column following protein precipitation. Control incubations substituted 100 mM potassium phosphate buffer for the NADPH-regenerating system and were performed for all experiments. Any background in controls (due to 0.2 and 0.4% EDDP in R- and S-methadone, respectively) was subtracted from that in incubations containing NADPH. Incubations were performed in triplicate unless otherwise indicated. Results are the mean ± S.D.
For determination of Ks and νmax, incubations (final volume 0.2 ml) contained RS-, R-, or S-methadone (0.5 to 1500 μM) and were terminated after 10 (CYP3A4 and CYP2B6) or 20 min (CYP2C19). For determination of the interaction between R- and S-methadone, incubations (10 min, 2.5 pmol of CYP2B6, 0.25 ml) containing 2, 20, 50, 100, and 200 μM R-or S-methadone, alone or in combination, were performed. Incubation conditions were based on preliminary experiments to assure linearity with time and protein concentration.
Data Analysis. Microsomal velocity versus substrate concentration data were analyzed using models of increasing complexity (single-site Michaelis-Menten, dual-site, cooperative, etc.) until optimal goodness of fit was obtained. Models were developed in Mathematica 5.2 (Wolfram Research, Champaign, IL) under rapid equilibrium assumptions according to the method of Segel (1975). All data were modeled by nonlinear regression using Mathematica 5.2 and SigmaPlot 9.0 (Systat Software, San Jose, CA) with 1/s weights, where s is the standard deviation within data point replicates. Goodness of fit to various models was evaluated using adjusted R2, distribution of residuals, standard error estimates of the parameters, and corrected Akaike's information criterion (Motulsky and Christopoulos, 2004). For all models, Ks(R) and Ks(S) are the reversible binding affinities for the R- and S-enantiomers of methadone, α and β are the homotropic and heterotropic interaction factors, respectively, and νmax(R) = 2kR, and νmax(S) = 2kS are the maximal rates of R- and S-EDDP formation. Models presented here correspond to the best-fit model for each dataset.

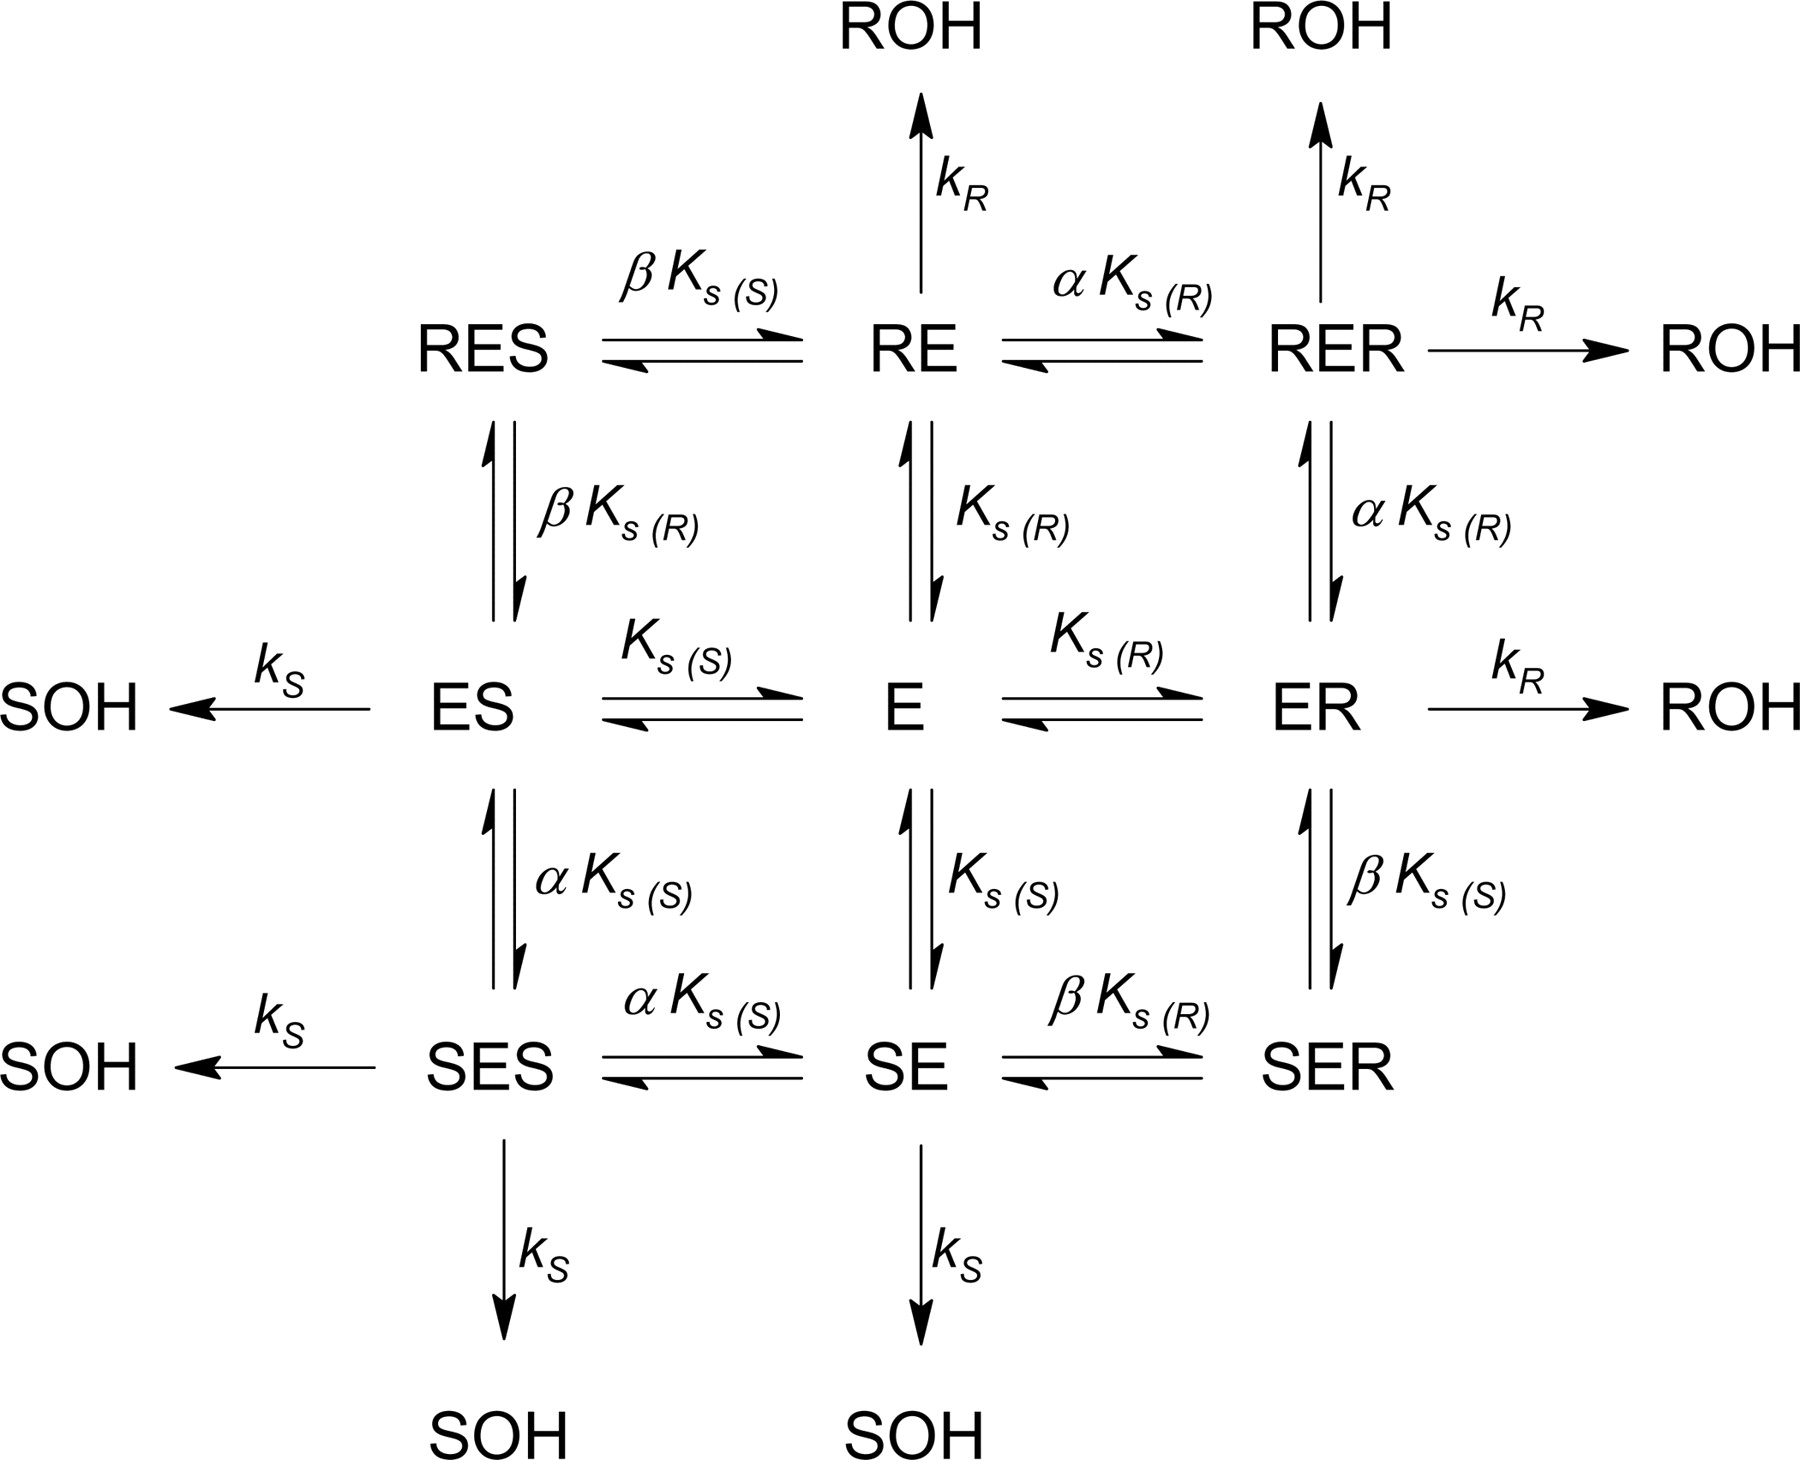
Kinetic scheme depicting CYP2B6-mediated RS-methadone metabolism.
The model affording the best fit to the CYP2B6 kinetic data was a competitive inhibition, two substrate, two-site model allowing for homotropic and heterotropic interactions in binding (Scheme 1; see Appendix 1 for a derivation of eq. 1). The velocity equations for R- and S-EDDP formations are: 

Enantiomeric EDDP formation rate data were modeled individually with eq. 1 or 2 and also simultaneously (referred to subsequently as a global model) with eq. 3, where VTotal-EDDP is equal to the sum of the velocities of R- and S-EDDP formation and VR-EDDP and VS-EDDP are equal to the right-hand sides of eqs. 1 and 2. 
The model affording the best fit to CYP3A4-catalyzed EDDP formation was also a competitive inhibition, two-substrate, two-site model allowing for homotropic and heterotropic interactions in binding (Scheme 2). In this model, the RES and SER complexes are inhibitory rather than productive, resulting in the following velocity equations: 

Mathematically, eqs. 4 and 5 differ from eqs. 1 and 2 only by the absence of the [R][S] term from the numerators. To determine Ks, α and β in the global analysis (eq. 3, based on eqs. 4 and 5), total EDDP formation rates (νTotal-EDDP data) were fit using the vmax values for EDDP formation from individual enantiomers in the absence of inhibitor, obtained using the Adair-Pauling (eq. 6), where X is the selected enantiomer (Segel, 1975; Tran et al., 2005). 
Metabolism of methadone by CYP2C19 was modeled using a competitive inhibition, two-substrate, two-site substrate inhibition model shown in Scheme 3. In this model, all ternary complexes are inhibitory rather than productive. The resulting velocity equations are: 
 which differ from eqs. 1 and 2 in that there are no longer terms in the numerators for [R]2, [S]2, or [R][S]. To determine Ks, α and β in the global analysis (eq. 3, based on eqs. 7 and 8), total EDDP formation rates were fit using the vmax values for EDDP formation from individual enantiomers in the absence of inhibitor obtained using eq. 9, as described for CYP2C19.
For all equations, VEDDP = Vmax/Ks for a single enantiomer when α > 1 and β > 1; therefore, intrinsic clearance was used as a measure of catalytic efficiency comparing various isoforms.

Kinetic scheme depicting CYP3A4-mediated RS-methadone metabolism.

Kinetic scheme depicting CYP2C19-mediated RS-methadone metabolism.
Predictions. The following method was used to predict in vivo R/S-methadone plasma ratios. Total hepatic clearance was calculated using the well stirred model,  where X is either the R-or S-enantiomer of methadone. Intrinsic clearances, Clint(X) (Table 1), were scaled to whole-liver values using scaling factors of 33 mg of microsomal protein per gram of liver and a liver weight of 1500 g (Wilson et al., 2003; Hakooz et al., 2006). The effect of the relative contents of CYP3A4 and CYP2B6 on the predicted plasma R/S-methadone ratio were simulated by varying their fraction of hepatic P450 (assuming metabolism by no other P450). The effects of hepatic CYP3A4 inhibition or CYP2B6 and CYP3A4 induction were simulated using constitutive hepatic concentrations of 100 pmol/mg CYP3A4 and 20 pmol/mg CYP2B6 as determined by Western blot analysis. Values for the unbound fractions in plasma, fu(X), were 0.21 and 0.14 for R- and S-methadone (Boulton et al., 2001). Given total hepatic clearance, the rate of change in the concentration of a single enantiomer in the body is
  where X is either the R-or S-enantiomer and Vd(X) is the volume of distribution of enantiomer X. Knowing that the initial concentration of X is
  where D is the dose of racemic methadone, eq. 11 can be integrated to give
  which describes the concentration of enantiomer X in the plasma at any time (t). Thus, the R-to S-methadone ratio at any time can be calculated as
Kinetic Parameters for methadone N-demethylation by cytochromes P450 2B6, 3A4, and 2C19
Equations 10 and 14 were used to predict the effects of partial inhibition of CYP3A4 by troleandomycin (assuming 62% inhibition) and 3-fold induction of both CYP3A4 (Kharasch et al., 2004) and CYP2B6 by rifampin on the in vivo plasma R/S-methadone ratios over a 72-h period after administration of a single RS-methadone IV dose. The 3-fold induction of CYP2B6 by rifampin was from the recent study by Loboz et al. (2006). Volumes of distribution were 550 and 340 liters for R- and S-methadone, respectively [unpublished result from Kharasch et al. (2004)], which are similar to those reported previously (Kristensen et al., 1996). After rifampin induction, volumes of distribution were 634 and 363 liters for R- and S-methadone, respectively.
Results
Kinetic Profile of MethadoneN-Dealkykation Catalyzed by Recombinant Cytochromes P450. There were striking differences between cytochromes P450 in the stereoselectivity, concentration dependence, and enantiomeric interactions of methadone N-demethylation. CYP3A4 exhibited no stereoselectivity over the entire substrate concentration range (Fig. 1, A and B), metabolizing R- and S-methadone at similar rates, whether racemic methadone or single enantiomers were the substrate. However, enantiomers in racemic methadone were metabolized at a rate less than half that of the single enantiomer at equimolar concentrations, indicating enantiomeric inhibition. Reduction in enantiomers turnover in the racemate was equivalent for R- and S-methadone, indicating that the enantiomeric interaction was not stereoselective.
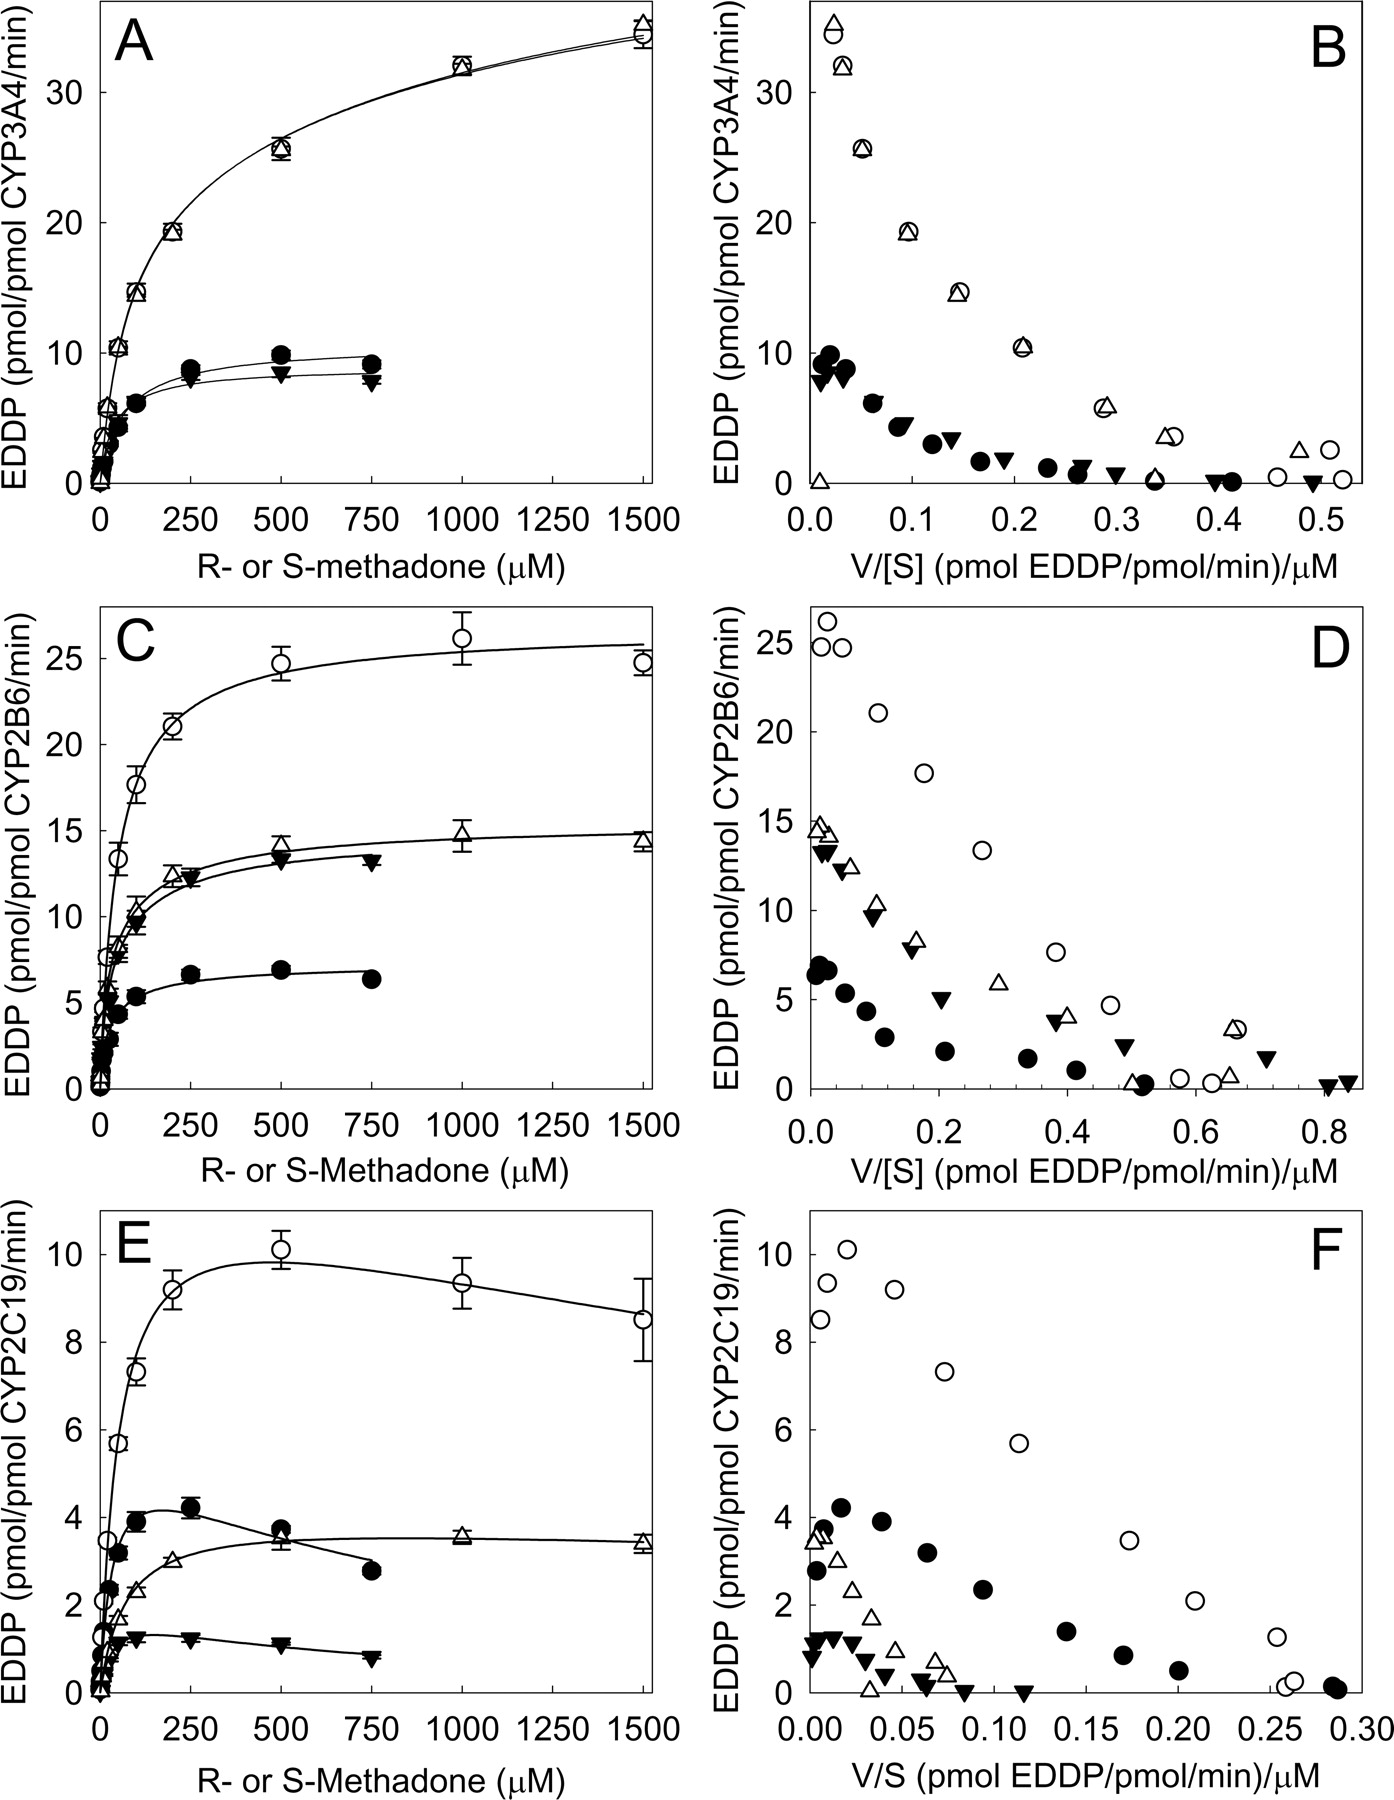
Recombinant CYP3A4- (A and B), CYP2B6- (C and D), and CYP2C19- (E and F) catalyzed metabolism of methadone to EDDP. Corresponding Eadie-Hofstee plots are shown in B, D, and F. Each data point represents the mean ± S.D. of triplicates. Symbols represent R-EDDP from RS-methadone (•), S-EDDP from RS-methadone (▾), R-EDDP from R-methadone (○), and S-EDDP from S-methadone (▿). Racemic methadone concentrations were 0 to 1500 μM, corresponding to 0 to 750 μM of each enantiomer. Lines represent rates predicted from nonlinear regression analysis of data according to the Adair-Pauling equation (Segel, 1975).
CYP2B6-catalyzed methadone N-dealkylation was stereoselective and also more complex. At therapeutic concentrations (1 μM), S-EDDP formation rates exceeded those for R-EDDP from both single enantiomers and the racemate. At higher concentrations, rates of single enantiomer demethylation were 2-fold greater for R- than S-methadone. In contrast, with racemic methadone, demethylation rates were 2-fold greater for S-methadone compared with R-methadone (Fig. 1, C and D). This occurred because R-methadone N-dealkylation rates in the racemate were less than one-fourth those of the individual enantiomer, whereas those of S-methadone was similar between the enantiomer and the racemate. Thus, for CYP2B6, there was an inhibitory enantiomeric interaction, and furthermore, this interaction was stereoselective.
Rates of methadone N-demethylation by CYP2C19 were substantially less than either CYP3A4 or CYP2B6. Metabolism was stereoselective (Fig. 1, E and F) and with selectivity opposite to that of CYP2B6. R-EDDP formation was approximately 3-fold greater than that of S-EDDP, throughout the concentration range evaluated, with both methadone racemate and single enantiomers. R-Methadone and S-methadone N-dealkylation by CYP2C19 in the racemate was less than half that of individual enantiomers alone, indicating an inhibitory enantiomeric interaction. As the degree of inhibition was similar for both R- and S-methadone, the interaction was not stereoselective. At higher R-methadone concentrations, there appeared to be substrate inhibition.

Metabolic interaction of methadone enantiomers during N-dealkylation catalyzed by CYP2B6. A, rate of R-EDDP formation versus R-methadone concentration in the presence of increasing S-methadone. B, rate of S-EDDP formation versus S-methadone concentration in the presence of increasing R-methadone. C, Lineweaver-Burk plots with S-methadone as the inhibitor. D, Lineweaver-Burk plots with R-methadone as the inhibitor. E, Eadie-Hofstee plots with S-methadone as the inhibitor. F, Eadie-Hofstee plots with R-methadone as the inhibitor. Symbols represent substrate alone (•) and substrate in the presence of 2 μM (○), 20 μM (▾), 50 μM (▿), 100 μM (▪), and 200 μM (□) of the opposing enantiomer as inhibitor. Each data point represents the mean ± S.D. of triplicates. Lines in A and B represent predicted velocities for each observed curve through application of the best fit parameters from global analysis (Table 1).
Inhibitory Enantiomeric Interaction of MethadoneN-Dealkylation by CYP2B6. The mechanism of the stereoselective enantiomeric interaction for CYP2B6 was investigated using methadone antipodes as inhibitors. Figure 2 shows the rate versus concentration profiles, Lineweaver-Burk plots, and Eadie-Hofstee plots for S-methadone as an inhibitor of R-methadone metabolism (Fig. 2, A, C, and E, respectively) and R-methadone as an inhibitor of S-methadone metabolism (Fig. 2, B, D, and F, respectively). Inhibition by either enantiomer was competitive, with greater S-methadone inhibition of R-methadone metabolism than R-of S-methadone metabolism.
EDDP formation data were analyzed using a succession of increasingly complex models, first for CYP2B6 and then for the other cytochromes P450. Eadie-Hofstee plots (Fig. 1, B, D, and F) for N-dealkylation of both racemic methadone and individual enantiomers by CYP2B6 (and the other cytochromes P450) were nonlinear and concave upward, indicating apparent multiple-site or multiple-affinity binding with complex allosteric kinetics or homotropic cooperativity. The Adair-Pauling equation (eq. 6), which allows for two binding sites, was used first to model N-demethylation of individual methadone enantiomers (Fig. 1). Kinetic parameters are provided in Table 1.
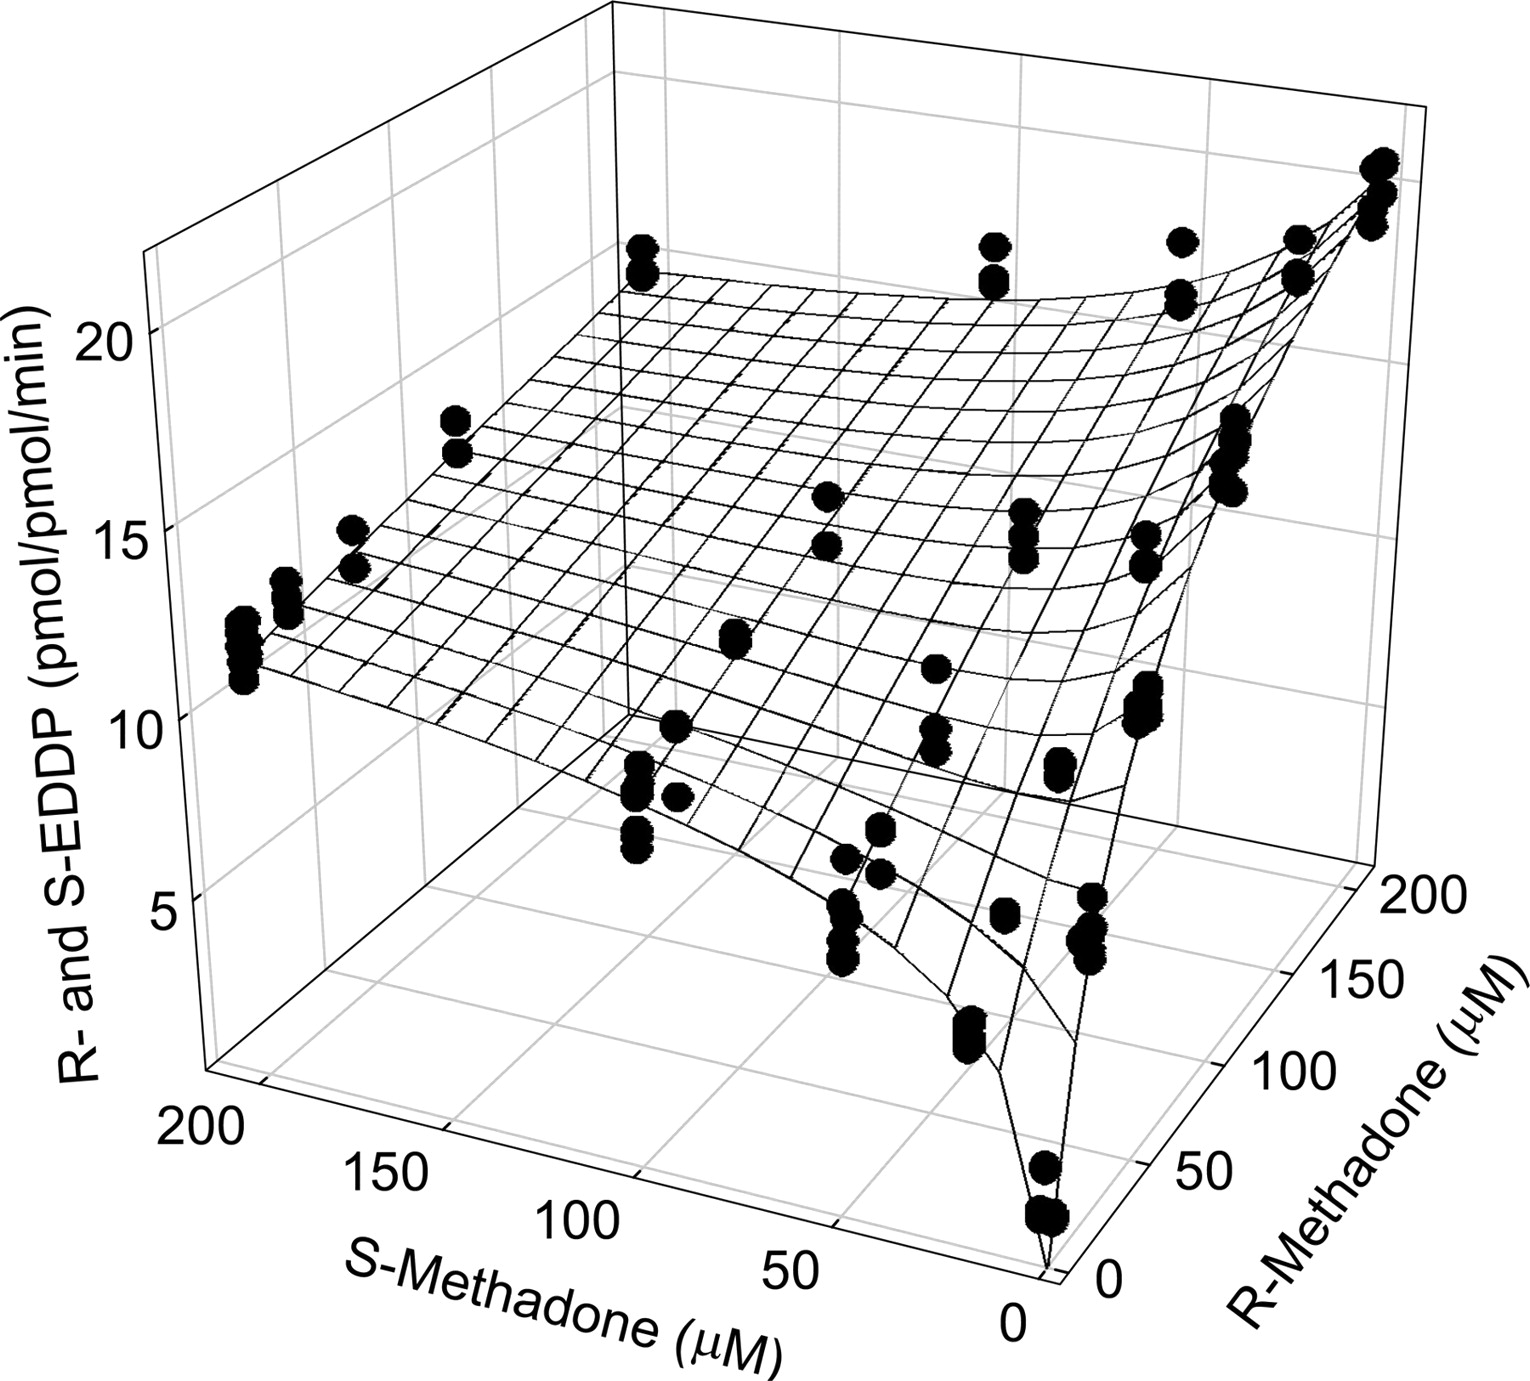
Although adequate for analyzing single enantiomer metabolism, the Adair-Pauling equation (eq. 6) does not incorporate competitive enantiomeric inhibition and, hence, could not be used to analyze EDDP enantiomer formation from the racemate. Therefore, more complex models that accommodate the experimental observations unique for each isozyme were developed. Experimental total (R+S)-EDDP formation rates by CYP2B6 were analyzed using a kinetic model that incorporates the stereoselective competitive inhibitory interaction between the two methadone enantiomers. The model that best described CYP2B6-mediated N-dealkylation of R- and S-methadone is presented in Scheme 1. In this model, all four ternary complexes (RER, RES, SER, and SES) are metabolically productive, and the model is described by eq. 3 (substituted with the right-hand sides of eqs. 1 and 2, respectively). The mesh surface in Fig. 3 represents the best fit to total EDDP formation; kinetic parameters are provided in Table 1.
In an internally consistent kinetic model, the parameters νmax and Ks estimated from a global analysis of total EDDP formation from racemic methadone should, because of the inclusion of the interaction parameters α and β, agree with νmax and Ks estimated by fitting R-or S-EDDP formation from individual methadone enantiomers. In addition, the global model should accurately predict the formation of EDDP from individual enantiomers. When the parameters from the global fit were used to predict EDDP formation from individual methadone enantiomers using eq. 1 or 2, respectively, there was reasonable agreement with the experimental data (Fig. 2, A and B). In addition, parameters obtained from individually fitting EDDP formation rates from each methadone enantiomer using eqs. 1 and 2, respectively (Table 1, columns 3 and 4), were similar to those from the global fit (Table 1, column 5). Thus, the model was internally consistent. The parameter estimates indicate that CYP2B6 is enantioselective, binding S-methadone more tightly (smaller Ks) and metabolizing it more efficiently (larger, Clint) compared with R-methadone (Table 1). Homotropic and heterotropic interaction factors (α and β) greater than one indicate mild negative cooperativity in binding in both cases. In addition, S-methadone was a more potent inhibitor of R-methadone demethylation (Ks(S) 16 ± 2 μM) than was R-methadone of S-methadone metabolism (Ks(R) 60 ± 8 μM) (Table 1).

CYP2B6 catalyzed N-dealkylation of methadone enantiomers from racemic methadone. Data were analyzed using a global fit of EDDP formation from both enantiomers, incorporating the inhibitory interaction between enantiomers. Each data point is a single incubation. Lines represent rates predicted from nonlinear regression analysis of data according to eq. 3 (substituted with eqs. 1 and 2).
CYP3A4-MediatedN-Dealkylation of Methadone. The kinetic model that best fit methadone N-dealkylation by CYP3A4 is depicted in Scheme 2. In this model, the heterotropic ternary complexes (RES and SER) are inhibitory and do not lead to product formation from either methadone enantiomer. The experimental velocity versus concentration data for single methadone enantiomers in Fig. 1A were analyzed using the Adair-Pauling equation (eq. 6); the Ks and νmax are reported in Table 1, columns 6 and 7. Before globally fitting the velocity versus concentration data in Fig. 1A to eq. 3 (substituted with eqs. 4 and 5), νmax values were fixed for individual enantiomers obtained from the Adair-Pauling equation. Figure 4 represents the global fit of total EDDP formation from R- and S-methadone, with parameters provided in Table 1, column 8. Parameters generated from this fit indicate that CYP3A4 binds R- and S-methadone with equal affinity, metabolizing them at the same rate; thus, no enantiomeric selectivity was observed. Homotropic and heterotropic interaction factors indicate mild negative cooperativity in binding. The two methadone enantiomers were equipotent inhibitors of the metabolism of their antipode, as assessed by the similarity of Ks(S) and Ks(R). In addition, there may be the appearance of substrate inhibition with racemic methadone at the highest concentration (750 μM) tested (Fig. 1A, closed symbols). This is consistent with a model involving inhibitory heterotropic ternary complexes, which would predict more prominent substrate inhibition if higher racemic methadone concentrations had been analyzed.

CYP3A4 catalyzed formation of EDDP. Data were analyzed using a global fit of total (R+S)-EDDP versus S- versus R-methadone to eq. 3 (substituted with eqs. 4 and 5). Each data point is the result of a single incubation, which were performed in triplicate. Lines represent rates predicted from nonlinear regression analysis of data.
CYP2C19-MediatedN-Dealkylation of Methadone. Models were developed, which fit the CYP2C19-mediated EDDP formation data, incorporating the stereoselective metabolism, nonstereoselective enantiomeric inhibition, and substrate inhibition observed. The experimental velocity versus concentration data for single methadone enantiomers (Fig. 1E) were fit using eq. 9; the Ks and νmax are reported in Table 1, columns 9 and 10. The kinetic model for total EDDP formation from R- and S-methadone, which best fit the data, is depicted in Scheme 3 and described in eqs. 7 to 9. This model suggests that all ternary complexes are inhibitory rather than productive, explaining the experimental observations of substrate inhibition and enantiomeric inhibition shown in Fig. 1E. As single enantiomer substrate concentrations increase, this forces the enzyme into the ternary complexes RER or SES, which are predicted to be inactive. Likewise, in the presence of both enantiomers, the additional inhibitory RES and SER complexes are formed, reducing product formation of both enantiomers in a racemic mixture. For the global fit to total EDDP formation versus R- and S-methadone concentration (eq. 3 substituted with eqs. 7 and 8), νmax values were determined for each enantiomer in the absence of the other using eq. 9 (Table 1, columns 9 and 10) and then fixed for the global fitting to determine affinities and interaction factors (α and β). Results of the global modeling are shown in Fig. 5, and parameters are provided in Table 1, column 11. These indicate that CYP2C19 is enantioselective, binds R-methadone somewhat more tightly, and metabolizes it more efficiently than S-methadone. Furthermore, the extent of homotropic negative cooperativity (α = 42) is much greater than that of heterotropic negative cooperativity (β = 3), indicating that heterotropic complexes (RES, SER) are favored over homotropic complexes (RER, SES). Thus, apparent substrate inhibition of CYP2C19 is more likely to appear at lower methadone concentrations when racemic methadone is used as opposed to single enantiomers, as evident in Fig. 1E.

CYP2C19 catalyzed formation of EDDP. Data were analyzed using a global fit of total (R+S)-EDDP versus S- versus R-methadone to eq. 3 (substituted with eqs. 7 and 8). Each data point is the result of a single incubation, which were performed in triplicate. Lines represent rates predicted from nonlinear regression analysis of data.
Model Application to Predict in VivoR/S-Methadone Plasma Concentration Ratios in Humans. The effect of varying hepatic contents of constitutive CYP3A4 and CYP2B6 and the effect of drug interactions on plasma R/S-methadone concentration ratios expected after a single IV methadone dose were predicted using the total hepatic clearance (eq. 10). Figure 6 (left) shows the effect of varying the relative proportions of constitutive CYP3A and CYP2B6 activity, which predicts that the plasma R/S-methadone concentration ratio will increase as the hepatic content of CYP2B6 increases compared with CYP3A4. Figure 6 (right) shows that inhibition of CYP3A (for example, by troleandomycin) is predicted to have minimal effect on the plasma R/S-methadone ratio, whereas a 3-fold induction of both CYP3A4 and CYP2B6 (as would be caused by rifampin) is predicted to increase the plasma R/S-methadone ratio.
Discussion
The first major finding of this investigation was that methadone N-dealkylation by CYP3A4, CYP2C19, and CYP2B6 all displayed a metabolic enantiomeric interaction, whereby EDDP formation rates from RS-methadone were lower than those from either individual enantiomer. Furthermore, there was isoform-specific substrate stereoselectivity to the interaction observed only with CYP2B6. Specifically, the inactive S-methadone is a more potent competitive inhibitor of pharmacologically active R-methadone N-dealkylation by CYP2B6 than is R-methadone of S-methadone metabolism.
The second major finding is the isoform-selective and intricate models for methadone N-demethylation, which are more complex than those proposed previously. The Adair-Pauling equation (eq. 6) for a two-site system, which is used to model CYP3A4 and CYP2B6-catalyzed metabolism, and the substrate inhibition equation (eq. 9), which is used to model CYP2C19 data, provided adequate fits to single enantiomer N-demethylation data (Fig. 1). Although these equations seemed, upon visual inspection, to adequately model racemic methadone data, this was somewhat misleading. Evaluating metabolism of both the single enantiomers and the racemate, along with stereospecific analysis of R- and S-EDDP formation, unveiled the metabolic enantiomeric interaction that would otherwise have been undetected if experiments had been performed only with the single enantiomers alone or racemic methadone alone. For all three cytochromes P450, kinetic parameters from the Adair-Pauling equation for modeling total EDDP formation from racemic methadone were substantially different from those for EDDP formation from individual enantiomers, indicating an enantiomeric interaction. Parameter differences also indicated that this model is not internally consistent (as defined under Results) and is mis-specified for racemic methadone. Therefore, more complex models were derived to account for experimentally observed stereoselective metabolism, enantiomeric interaction, stereoselective enantiomeric inhibition, and substrate inhibition. Comparison of modeling diagnostics (R2, residuals, parameter error estimates, Akaike's information criterion), and predictions from analysis of EDDP formation from racemic methadone using the global model versus individual enantiomer metabolism showed improvements afforded by the former model.
A kinetic model for methadone N-demethylation by CYP3A4 was required to explain nonstereoselective metabolism, nonstereoselective enantiomeric inhibition, apparent substrate inhibition, and negative cooperativity. CYP3A4 displays allosteric kinetics with many substrates (Shou et al., 1999; Houston and Galetin, 2005), Nonetheless, none of the published allosteric models for CYP3A4 adequately described EDDP formation from racemic methadone. Dual substrate models with positive homotropic or heterotropic cooperativity have been used to model kinetics for other CYP3A4 substrates, such as diazepam and midazolam (Shou et al., 1999; Huang et al., 2004). Negative cooperativity, although less common, has been reported for CYP3A-catalyzed metabolism of methadone and other compounds (Korzekwa et al., 1998; Kharasch et al., 2004). The kinetic model presented here accounts for all the experimental observations for methadone N-demethylation by CYP3A4.
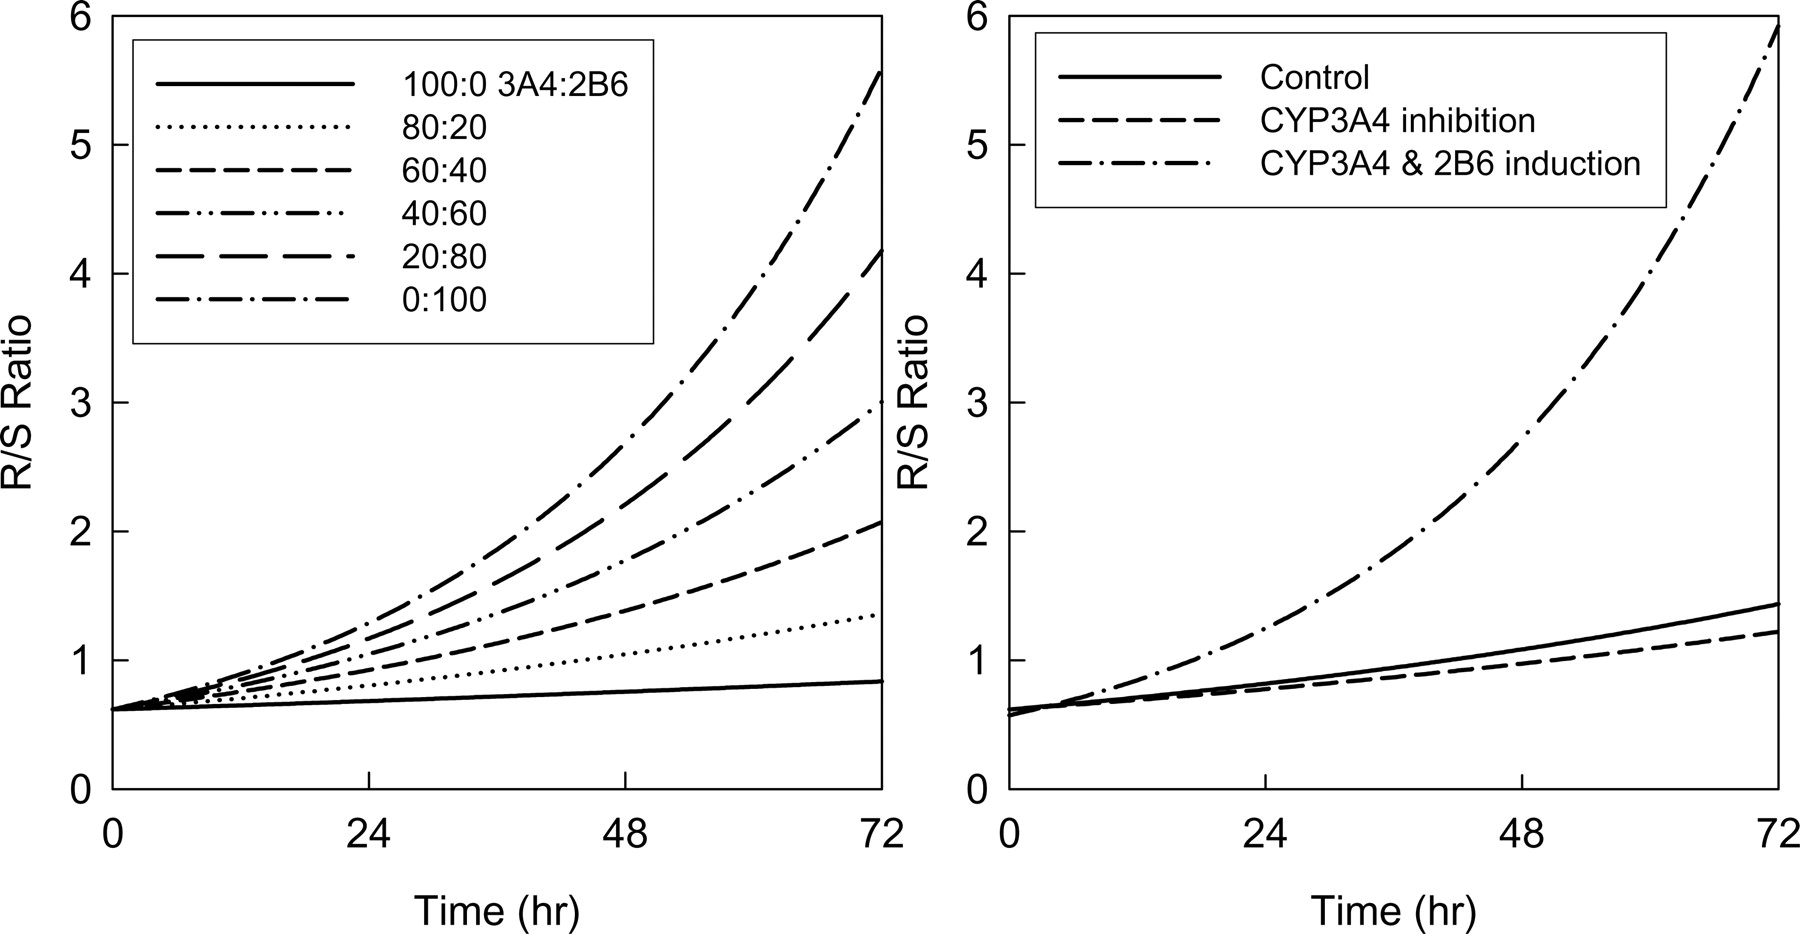
Human in vivo R/S-methadone plasma concentration ratio versus time, predicted as a function of hepatic CYP3A4 and CYP2B6 content. The model assumed metabolism by no other P450. The ratio was predicted using eq. 14. Left, the effect of varying the relative CYP3A4 and CYP2B6 hepatic contents. Right, predicted effects of CYP3A4 inhibition by troleandomycin (dotted line) and induction of both CYP3A4 and CYP2B6 by rifampin (dashed line), compared with constitutive activity (solid line). Constitutive hepatic concentrations of 100 pmol/mg CYP3A4 and 20 pmol/mg CYP2B6 were assumed for the model based on previous observations (Totah et al., 2004) The model used 62% inhibition of CYP3A4 by troleandomycin (Kharasch et al., 2004) and 3-fold induction of both CYP3A4 and CYP2B6 by rifampin (Faucette et al., 2004; Kharasch et al., 2004; Loboz et al., 2006).
A model for methadone N-demethylation by CYP2C19 was required to explain stereoselective metabolism, nonstereoselective enantiomeric interaction, and substrate inhibition, which occurred with lower concentrations of racemic methadone than with single enantiomers. The model best describing the data suggested that formation of homogenous ternary complexes (RER and SES) is less favorable than that of heterogenous (RES and SER) complexes. Substrate inhibition usually occurs when substrates have access to both the inhibitory and catalytic sites and when the substrate concentration exceeds the Ki (Lin et al., 2001). Substrate inhibition has been previously reported for CYP2C19 and meperidine and other drugs (Ramirez et al., 2004). This appears to be the first report of CYP2C19 substrate inhibition by methadone. Previously, methadone metabolism by CYP2C19 did not evaluate concentrations high enough to observe substrate inhibition and was analyzed by simple Michaelis-Menten kinetics (Gerber et al., 2004). Although perhaps mechanistically interesting, substrate inhibition of CYP2C19 by methadone is unlikely to occur at therapeutic concentrations and have any clinical relevance.
The complex kinetics observed with methadone N-dealkylation by CYP2B6 engendered a model more complex than that developed for CYP3A4 or CYP2C19. The model was required to account for stereoselective metabolism, stereoselective enantiomeric competitive inhibition, and negative cooperativity and featured two substrate binding sites. Although it was originally predicted, based on computational analysis and molecular modeling, that the CYP2B6 active site is relatively small and that allosteric kinetics resulting from the binding of several substrates were unlikely (Ekins et al., 1999), a more recent study using a large set of structurally variable substrates to evaluate the CYP2B6 active site suggested two possible binding substrate sites and the potential for allosteric kinetics (Wang and Halpert, 2002). Although CYP2B6-negative cooperativity is rare, it was observed with N-desmethyladinazolam (Venkatakrishnan et al., 1998). The present CYP2B6 kinetic model can also explain why the enantiomeric interaction with methadone is stereoselective. It predicts that CYP2B6 binds S-methadone more tightly and metabolizes it with a greater vmax than R-methadone (Table 1, columns 3–5) yet more efficiently (Clint(S)). It is noteworthy that an increase in curvature in the Eadie-Hofstee plots occurred as the concentration of the antipode inhibitor increased (Fig. 2, E and F). This is consistent with two substrate binding sites, whereby the contribution of the second (high Ks, low affinity) site to metabolism was unmasked as the antipode concentration increased.
Stereoselective methadone metabolism by CYP2B6 and stereoselective metabolic enantiomeric interactions in CYP2B6-catalyzed methadone N-demethylation may have clinical implications and explain several experimental observations. S-Methadone may contribute to the pharmacological effects of racemic methadone, not through μ-receptor activity, but by affecting the metabolism and pharmacokinetics of the active R-enantiomer. Assuming that methadone systemic clearance reflects methadone N-demethylation (De Vos et al., 1995), metabolism by CYP2B6 would be expected to increase the plasma R/S-methadone ratio, because CYP2B6 preferentially metabolizes the S-enantiomer and because S-methadone inhibits R-methadone metabolism. Conversely, metabolism by CYP2C19 would be expected to have the opposite effect, decreasing the R/S-plasma ratio. CYP3A4-catalyzed methadone N-demethylation is not stereoselective, predicting a plasma R/S ratio of unity (although differences in the volumes of distributions bring the R/S ratio close to 0.6).
Prediction of in vivo human plasma methadone R/S ratios using in vitro expressed cytochromes P450 shows that CYP3A4 inhibition would have minimal effect, whereas CYP2B6 induction would result in a time-dependent increase in the R/S ratio (Fig. 6). This prediction is consistent with the results of a clinical investigation (Kharasch et al., 2004), in which troleandomycin inhibition of CYP3A4 had minimal effect on the plasma methadone R/S ratio, whereas rifampin induction (presumably of CYP2B6) resulted in a time-dependent increase in the R/S ratio. A role for N-demethylation as a determinant of methadone clearance is supported by the significant correlation (r = 0.81, p < 0.001) between methadone clearance and the plasma EDDP/methadone area under the curve ratio (De Vos et al., 1995). These results suggest that CYP2B6 may be a major determinant of human methadone disposition in vivo. It would also be informative to predict EDDP formation in human liver microsomes based on CYP3A4 and CYP2B6 content and assess the predictive accuracy. Further studies are needed to evaluate the role in vivo of CYP2B6.
There are limitations to the P450 models and predictions in this investigation. Although they adequately explain experimental observations, the models are highly parameterized and thus require many data points for simultaneous parameter solution. To accommodate the number of data points available and reduce parameter uncertainty (Tran et at., 2005), total EDDP formation from racemic methadone was modeled using fixed νmax values for individual enantiomers in the absence of inhibitor, obtained with the Adair-Pauling equation for CYP2B6 and CYP3A4 and a dual site substrate inhibition equation for CYP2C19. In simulations of P450 modulation effects on plasma methadone R/S ratios, a time-dependent increase by rifampin was predicted, accurately reflecting clinical observations, although the absolute value of the increase was not accurately predicted. Nonetheless, the intended purpose was not absolute quantitative ratios but qualitative assessment. Absolute values of the predicted R/S ratios will depend on numerous factors, including but not limited to analytical, experimental, and computational imperfection; variability in expressed and human liver P450 activities, varying estimates of liver size, blood flow, and P450 contents per gram of liver; plasma and hepatocyte protein binding; nonspecific substrate binding in microsomal incubations; estimated hepatic drug concentrations; appropriateness of scaling factors; and estimates of P450 induction or inhibition (Houston and Kenworthy, 2000). There is considerable uncertainty in using in vitro data to predict in vivo clearances and variability among drugs in the accuracy of those predictions (Nestorov et al., 2002). Estimates of microsomal protein ranged from 21 to 40 mg/g liver (Lipscomb et al., 1998; Wilson et al., 2003; Hakooz et al., 2006). We used an intermediate value of 33 mg/g. Methadone R and S unbound fractions in plasma have been reported as 21 and 14% (Boulton et al., 2001), 18 and 14% (Gerber et al., 2001), 14 and 10% (Eap et al., 1990), and 14% for the racemate (Inturrisi et al., 1987). Rifampin induced CYP2B6 in vivo 3-fold (Loboz et al., 2006). Although different values for microsomal P450 content, methadone binding, and P450 induction would give different absolute R/S ratios, the conclusion would remain that the R/S ratio would be relatively unaffected by CYP3A4 inhibition and increased by CYP2B6 induction.
In summary, these results show that CYP2B6 is a predominant catalyst of stereoselective methadone metabolism and subject to stereoselective enantiomeric competitive inhibition in vitro and strongly suggest that CYP2B6 may be a major determinant of stereoselective methadone metabolism and disposition in vivo. Methadone metabolism by CYP2B6, relative hepatic contents of CYP2B6 and CYP3A4, CYP2B6 induction and inhibition, isoform-specific stereoselective metabolism, and the complex inhibitory metabolic interaction between methadone enantiomers may all contribute to the interindividual and intraindividual variability in human methadone disposition.
Appendix
According to Scheme 1, R-EDDP formation from R-methadone can be expressed as follows: 
The conservation equation for total enzyme is indicated below: 
Dividing the velocity equation (eq. 15) by total enzyme (eq. 16) results in equation (eq. 17), 
Assuming rapid equilibrium for binding of all species, the following dissociation constants can be defined for Scheme 1 in the main text. 
Using the definitions for the dissociation constants and defining νmax(R)=2kR, the velocity equation (eq. 17) can be substituted to obtain eq. 19,  and clearly when [S]=0
Thus, when product formation velocities are normalized to total enzyme in the incubation,  equations (eq. 19) became equivalent to eq. 1 in the main text. All other equations in the main text can be derived in a similar manner.
Footnotes
-
This work was supported by National Institutes of Health Grants R01DA14211 and K24DA00417 (E.D.K.). R.A.T. is supported in part by a University of Washington School of Pharmacy Drug Metabolism, Transporter and Pharmacogenomics Research Program (DMTPR) funded by gifts from Abbott, Allergan, Amgen, Bristol-Myers Squibb, Eli Lilly, Hoffman La Roche, Johnson & Johnson, Merck, and Pfizer. K.E.A. was supported by the Pharmacological Predoctoral Training Grants GM07750 and PO1 GM32165.
-
Article, publication date, and citation information can be found at http://jpet.aspetjournals.org.
-
doi:10.1124/jpet.106.117580.
-
ABBREVIATIONS: EDDP, 2-ethyl-1,5-dimethyl-3,3-diphenylpyrrolidine; d3-EDDP, [ethyl-2′,2′,2′-2H3]-3,3-diphenyl-2-ethyl-5-methyl-1-pyrroline hydrochloride; R-methadone, (R)-(6-dimethyamino-4,4-diphenyl-heptan-3-one) hydrochloride; S-methadone, (S)-(6-dimethyamino-4,4-diphenyl-heptan-3-one) hydrochloride; RS-methadone, (RS)-(6-dimethyamino-4,4-diphenyl-heptan-3-one) hydrochloride; P450, cytochrome P450.
- Received November 23, 2006.
- Accepted January 24, 2007.
- The American Society for Pharmacology and Experimental Therapeutics


