


Abstract
Many undesired side effects or therapeutic failures of drugs are the result of differences or changes in drug metabolism, primarily depending on the levels and activities of cytochrome P450 (P450) enzymes. To assess whether P450 expression profiles can reflect hepatic drug metabolism, we compared P450 mRNA levels in the liver or peripheral leukocytes with the corresponding hepatic P450 activities. A preliminary P450 genotyping for the most frequent polymorphisms in white populations (CYP2C9*2, CYP2C9*3, CYP2C19*2, CYP2C19*3, CYP2D6*3, CYP2D6*4, CYP2D6*6, and CYP3A5*3) was carried out before P450 phenotyping, excluding the donors with nonfunctional alleles of CYP2C9, CYP2C19, and CYP2D6 and those with a functional CYP3A5*1 allele from a correlation analysis. The hepatic mRNA levels of CYP1A2, CYP2B6, CYP2C9, CYP2C19, CYP2D6, and CYP3A4 displayed a strong association with P450 activities in the liver, whereas the expression of CYP1A2, CYP2C9, CYP2C19, and CYP3A4 in leukocytes was proven to reflect the hepatic activities of these P450 species. The leukocytes were found to be inappropriate cells for the assessment of hepatic CYP2B6 and CYP2D6 activities. Combining the results of P450 genotyping and phenotyping analyses, patients' drug-metabolizing capacities can be estimated by the P450 expression in the liver and in leukocytes with some limitations. Patients' genetic and nongenetic variations in P450 status can guide the appropriate selection of drugs and the optimal dose, minimizing the risk of harmful side effects and ensuring a successful outcome of drug therapy.
Introduction
The lack of therapeutic effect of drugs or the appearance of undesired side effects, resulting in adverse events for patients, is partly caused by differences or changes in drug metabolism. Of significant importance in interindividual differences is the genetic variability of drug-metabolizing enzymes, causing reduced or even no enzyme activity. As an effect, the drug-metabolizing capacity of a patient can be weaker (poor metabolizer) compared with other members (intermediate or extensive metabolizer) of the population (Ingelman-Sundberg, 2001). An individual with poor drug metabolism capacity can live a normal life until he/she is treated with a drug metabolized by an enzyme with reduced or no activity. Patients with poor drug-metabolizing capacities produce significantly higher blood levels of certain drugs, causing more severe and frequent side effects (Brockmöller et al., 2000; Wilke et al., 2005).
The principal organ of drug metabolism is the liver; however, every tissue has some ability to metabolize xenobiotics. Although the drug-metabolizing activities of the gut wall, kidneys, lungs, or even the brain can contribute to the overall biotransformation to some extent, a patient's drug-metabolizing capacity can be approximately estimated from the hepatic metabolism. Therapeutic failure or drug toxicity is strongly influenced by hepatic drug metabolism, primarily depending on the levels and activities of cytochrome P450 (P450). The enzymes belonging to the CYP1-3 families play a central role in the biotransformation of various drugs to more polar compounds, which are readily excreted (Lewis, 2004; Monostory and Pascussi, 2008). One of the most important reasons for interindividual variations in drug metabolism is the genetic polymorphism of P450 genes. Some P450 genes (CYP2C9, CYP2C19, CYP2D6, and CYP3A5) are highly polymorphic, resulting in enzyme variants with reduced or even no activity (Solus et al., 2004). The genetically determined variance in P450 enzyme activities is transiently modulated by environmental (nutrition and comedication) or internal factors (age, hormonal status, liver function, and diseases), leading to different drug metabolism phenotypes (Monostory and Pascussi, 2008). Individuals with defective P450 alleles display permanent poor drug metabolism, whereas those who have wild-type P450 genes may become transient poor metabolizers. This means that the P450 phenotype and drug-metabolizing capacity dynamically change in the course of external and internal influences, adapting to everyday chemical exposure. A transient decline in drug metabolism capacity may arise because of a decrease in physical and health conditions or the consumption of certain drugs or citruses. In contrast, an extensive metabolism can occur upon consumption of St. John's wort tea or during treatment with steroids or rifampicin (Monostory and Pascussi, 2008).
By recognizing individual differences in drug efficacy and toxicity, personalized drug therapy adjusted to a patient's drug-metabolizing capacity can help to avoid the potential side effects of drugs. Tailored medication as a part of modern medical practices requires reliable diagnostic tools for the identification of inactivating mutations or the lack of functional P450 enzymes. Pharmacogenetic services for the estimation of drug-metabolizing capacity have expanded worldwide (Brockmöller et al., 2000; Wilke et al., 2005); however, these test services determine nonfunctional P450 enzymes only by P450 genotyping and do not provide information about the drug-metabolizing capacity of patients who do not have P450 mutations. P450 phenotyping can add a novel element to the available diagnostics, and a combination of P450 genotyping and phenotyping enables a more accurate picture of a patient's drug metabolism. In contrast to the already existing assays, this multistep diagnostic system determines the patient's drug-metabolizing capacity and suggests a more rational drug therapy that is adjusted to the results. The complex diagnostic system provides an opportunity for predicting P450 enzyme deficiency or an extremely reduced/increased P450 expression that identifies the limitations of drug therapy. With an estimation of the patient's drug-metabolizing capacity, a modification of the drug therapy in a rational, individually adjusted way can lower the incidences of adverse drug reactions. The quality of a patient's life can eventually be improved if the diminished drug metabolism capacity is recognized in time and an individually adjusted therapy is applied.
The goal of the present work is to introduce a global approach by combining P450 genotyping and phenotyping tools to estimate patients' drug-metabolizing capacity. To approach this goal, 1) the first task is to screen the defective P450 alleles that result in a clinically significant reduction in P450 activities; and 2) then to estimate the current P450 expression in those subjects who have wild-type P450 genes. An additional aim is to decipher the correlation between the drug-metabolizing capacity of the liver and P450 expression in leukocytes (peripheral blood). If the P450 status of leukocytes can inform us about the drug-metabolizing capacity of the liver, then the determination of a patient's drug-metabolizing capacity will have predictive power regarding future medication. A prospective investigation of the P450 status allows a prediction of potential poor (or extensive) metabolizer phenotypes and facilitates an improvement of individual therapy, leading to the optimization of drug choice and/or dosage for a more effective therapy, avoiding serious adverse effects, and decreasing medical costs.
Materials and Methods
Liver and Blood Samples.
The drug-metabolizing capacity of human livers not selected for transplantation (n = 146) or liver tissues remaining after reduced-size transplantation (n = 18) was determined by P450 genotyping and phenotyping. In parallel, samples of peripheral blood were taken from all of the donors. The male/female ratio of the donors was 91/73, their age ranged between 3 and 74 years (43.4 ± 14.46 years), and the cause of death included intracranial bleeding (65.2%) and cerebral contusion (34.8%). The livers were retrieved from hemodynamically stable brain death donors with a normal liver function. The livers were perfused and stored in histidine-tryptophan-ketoglutarate (Fresenius AG, Bad Homburg vor der Höhe, Germany). The use of human tissues for scientific research was approved by the Hungarian Committee of Science and Research Ethics. All experimental activities were carried out under the regulation of Act CLIV of 1997 on Health and decree 23/2002 of the Minister of Health of Hungary.
The microsomes and total RNA were isolated from the liver samples. The liver tissues were homogenized in Tris-HCl buffer (0.1 M; pH 7.4) containing 1 mM EDTA and 154 mM KCl. The hepatic microsomal fraction was prepared by differential centrifugation (van der Hoeven and Coon, 1974). All of the procedures of preparation were performed at 0 to 4°C. The protein content of the hepatic microsomes was determined by the method of Lowry et al. (1951), with bovine serum albumin as the standard. Approximately 50 mg of liver tissues were homogenized in 1 ml of TRIzol reagent (Invitrogen, Carlsbad, CA), and the total RNA was extracted according to the manufacturer's instructions. The RNA was precipitated by using ethanol and stored at −80°C for further analyses.
Leukocytes were isolated from 0.5 ml of blood samples using red blood cell lysis buffer (Roche Diagnostics, Mannheim, Germany) and suspended in either 0.2 ml of phosphate-buffered saline for DNA extraction or 1 ml of TRIzol reagent for isolation of the total RNA. The genomic DNA was extracted by using the high pure PCR template preparation kit (Roche Diagnostics). Total RNA was isolated from leukocytes in a similar way to the hepatic RNA extraction. The purity and the concentration of the DNA and RNA samples were determined with a NanoDrop 1000 spectrophotometer (Thermo Fisher Scientific, Waltham, MA).
To determine the effect of the period from liver sampling to RNA extraction, and from blood taking to leukocyte isolation and RNA extraction, P450 gene expression was compared among the RNA preparations extracted immediately after the liver sampling and blood taking from three donors and after storage for 4, 8, and 24 h at 4°C. No effect of storage for 4 h on the P450 mRNA levels was observed; however, some degradation of the P450 mRNAs occurred in samples stored for 8 and 24 h. Thus, the time between liver tissue and blood delivery and storage until leukocyte isolation and RNA extraction was limited to 4 h.
Positive control samples with various P450 genotypes were kind gifts from Matthias Schwab and Ulrich Zanger (Dr. Margarete Fischer-Bosch-Institute of Clinical Pharmacology, Stuttgart, Germany) and Julia Kirchheiner (University of Ulm, Ulm, Germany).
P450 Enzyme Assays.
Published methods were followed to determine the P450-selective enzyme activities: phenacetin O-dealkylation for CYP1A2 (Butler et al., 1989), mephenytoin N-demethylation for CYP2B6 (Heyn et al., 1996), tolbutamide 4-hydroxylation for CYP2C9 (Miners and Birkett, 1996), mephenytoin 4′-hydroxylation for CYP2C19 (Srivastava et al., 1991), dextromethorphan O-demethylation for CYP2D6 (Kronbach et al., 1987), and nifedipine oxidation (Guengerich et al., 1986) and midazolam 1′- and 4-hydroxylation (Kronbach et al., 1989) for CYP3A4/5. The incubation mixture contained a NADPH-generating system (1 mM NADPH, 10 mM glucose 6-phosphate, 5 mM MgCl2, and 2 units/ml glucose 6-phosphate dehydrogenase), human liver microsomes, and various substrates selective for P450 isoforms (phenacetin for CYP1A2, tolbutamide for CYP2C9, mephenytoin for CYP2B6 and CYP2C19, dextromethorphan for CYP2D6, and nifedipine and midazolam for CYP3A4/5). The amount of microsomal protein used in the enzymatic reactions was 0.8 mg/ml, except for the phenacetin O-dealkylation (1 mg/ml). The microsomal P450 enzyme reactions were linear in the 10- to 30-min incubation period. The enzyme reactions were terminated by the addition of ice-cold methanol. High-performance liquid chromatography analyses were performed according to published methods (Guengerich et al., 1986; Kronbach et al., 1987, 1989; Butler et al., 1989; Srivastava et al., 1991; Heyn et al., 1996; Miners and Birkett, 1996). All measurements were performed in duplicate with <5% interday and intraday precision.
Quantitative Real-Time PCR.
RNA (3 μg) was reverse-transcribed into single-stranded cDNA by using the iScript cDNA synthesis kit (Bio-Rad Laboratories, Hercules CA), and then real-time PCR with human cDNA was performed by using FastStart Taq DNA polymerase (LightCycler 480 Probes Master; Roche Diagnostics) and UPL probes for CYP1A2, CYP2B6, CYP2C9, CYP2C19, CYP2D6, and CYP3A4 (Roche Diagnostics). The sequences of primers and probes used for the real-time PCR analyses are shown in Table 1. The quantity of target RNA relative to that of the housekeeping gene glyceraldehyde 3-phosphate dehydrogenase (GAPDH) was determined. The P450 mRNA levels were quantified by real-time PCR measurements in the liver tissues and leukocytes from all donors.
Sequences of PCR primers and probes for P450 phenotyping and genotyping
P450 Genotyping with TaqMan Probes.
Hydrolysis single-nucleotide polymorphism (SNP) analysis for CYP2C9*2, CYP2C9*3, CYP2C19*2, CYP2C19*3, CYP2D6*3, CYP2D6*4, CYP2D6*6, and CYP3A5*3 was performed by PCR with TaqMan probes (BioSearch Technologies, Novato, CA) using the CFX96 real-time PCR detection system (Bio-Rad Laboratories). Allelic discrimination was based on the design of two TaqMan probes, specific for the wild-type allele and the mutant allele labeled with different fluorescent tags (FAM, CalFlourGold540, CalRed610, or Quasar670; BioSearch Technologies). Primers and probes (Table 1) were designed based on the reference SNP sequences in the National Center for Biotechnology Information reference assembly. Real-time PCR was carried out with 80 ng of genomic DNA by using FastStart Taq DNA polymerase (LightCycler 480 Probes Master, Roche Diagnostics, or iQ Supermix, Bio-Rad Laboratories). The P450 genotypes were distinguished by post-PCR allelic discrimination plotting the relative fluorescence values for wild-type and mutant alleles. The allelic content of each sample was determined by a multicomponent algorithm, yielding three allelic clusters representing the P450 genotypic constituent: homozygous wild type, homozygous mutant type, and heterozygous genotype. To confirm the results of the P450 genotyping, a sequence analysis was also performed. One hundred nanograms of DNA were amplified by using the primers designed for the hydrolysis SNP analysis and the iQ Supermix. The PCR products were sequenced directly in an ABI PRISM 3100 Genetic Analyzer (Applied Biosystems, Foster City, CA) by the Sequencing Service of Biomi Ltd. (Gödöllő, Hungary).
Data Analysis.
Hepatic P450 enzyme activities were determined individually in each donor, and the frequency distributions of the P450 activities were recorded for 164 donors. Three categories for each P450 activity (low, medium, and high) were statistically distinguished by calculating the quartiles of the P450 activity distributions. The cutoff values between the categories were set to the first and the third quartiles of the donors. The quartiles were chosen over S.D. values because the P450 activity distributions were skewed. The low, medium, and high activity categories were used to describe the drug-metabolizer phenotypes, as poor, intermediate, and extensive metabolizers, respectively.
The gene expression of CYP1A2, CYP2B6, CYP2C9, CYP2C19, CYP2D6, and CYP3A4 was also determined in both the liver and peripheral leukocytes. The correlation between the hepatic P450 activities and the relative P450 mRNA levels in the liver or leukocytes was estimated. The donors with homozygous mutant or heterozygous genotypes were excluded from the correlation analysis for all of the P450s, except CYP3A4. For the evaluation of the CYP3A4 activity-mRNA correlation, the donors carrying the CYP3A5*1 allele were excluded from the analysis. The correlation among the P450 activities and P450 gene expression levels was quantified, and the correlation coefficients (rS) and 95% confidence intervals were calculated by using the Spearman approach (InStat version 3.05; GraphPad Software, Inc., San Diego, CA). A strong correlation between gene expression and hepatic P450 activities was considered if the probability value (P) was under 0.0001.
Results
Variations in P450 Enzyme Activities.
Drug metabolism in the liver can be approximately estimated by the activities of the most relevant drug-metabolizing P450 enzymes, thus we determined the catalytic activities of various P450s in hepatic microsomal fractions of 164 Hungarian (white) cadaveric donors. P450-selective substrates that were metabolized by a single P450 isoenzyme to produce a given metabolite were used to measure P450 activities. Figure 1 shows the frequency distribution of CYP1A2, CYP2B6, CYP2C9, CYP2C19, CYP2D6, and CYP3A activities in the Hungarian liver donors. The hepatic P450 activities of different donors showed a wide variation, as was also reported by several authors (Transon et al., 1996; Blanco et al., 2000; Shu et al., 2001). The interindividual variations of the P450 activities toward selective marker substrates ranged from 80- to 750-fold variations for CYP2B6 and CYP3A4, respectively. In several cases the activities ranged from nondetectable to rather high values for CYP1A2, CYP2C9, CYP2C19, and CYP2D6 (Table 2). The P450 activity values did not show a Gaussian distribution, rather they exhibited a skewed distribution. As a result, the median ± QD values were calculated. The first and third quartiles were considered to be the cutoff values between the categories of low, medium, and high activities, characterizing poor, intermediate, and extensive metabolizer phenotypes, respectively.

Frequency distribution of CYP1A2, CYP2B6, CYP2C9, CYP2C19, CYP2D6, and CYP3A activities in Hungarian liver donors (n = 164).
Characterization of human liver tissues (n = 164) for selective substrates of P450 enzymes
The values are expressed as pmol product/mg microsomal protein × min.
P450 Expression in Liver.
Assays of P450 enzyme activities require a large amount of liver tissue. This can be considered as a significant drawback when testing the drug-metabolizing capacity from liver needle biopsies, where the available tissue is limited. Real-time PCR techniques can measure P450 expression in small liver samples. These techniques may provide a useful method for an assessment of the liver's drug-metabolizing capacity, if the hepatic P450 mRNA levels reflect the hepatic P450 activities. The total RNA was isolated, and the expression levels of CYP1A2, CYP2B6, CYP2C9, CYP2C19, CYP2D6, and CYP3A4 genes were determined in the same liver samples in which the P450 activities were measured. The primers for each P450 mRNA assay were designed in two consecutive exons separated by an intron on the corresponding genomic DNA; thus the primer pairs amplified the cDNA generated from the P450 mRNA and did not yield products on any possible contamination with genomic DNA. All of the P450 mRNA species investigated were detectable in liver tissues, but at varying levels (Table 3). Variations in the hepatic P450 mRNAs (ranging from 20- to 2000-fold) were more or less similar to the variations in P450 activities. The CYP3A4 mRNA displayed the highest interindividual variation with the three-magnitude difference between the highest and lowest levels of hepatic expression; whereas the CYP2D6 expression exhibited the lowest variation (20-fold) between donors.
P450 mRNA levels relative to GADPH mRNA in liver tissues and leukocytes of the donors
The values are the mRNA ratio × 10−3.
Correlation between P450 Enzyme Activities and P450 Expression in Liver Tissues.
A relationship between the hepatic P450 mRNA levels and enzyme activities has been reported by other investigators (Sumida et al., 1999; Rodríguez-Antona et al., 2001). A correlation between the P450-selective activities and P450 gene expression, both determined in liver samples of Hungarian donors (n = 117–164), was estimated. Although the expression of various P450s would theoretically reflect the drug-metabolizing capacity of the liver, genetic polymorphisms of P450s can give rise to perpetually reduced or even extensive metabolism. Several SNPs frequently occurring in the white population were determined in donors in parallel with P450 phenotyping by P450 activities and mRNA levels.
The hepatic CYP1A2 and CYP2B6 mRNA levels correlated well with the activities of phenacetin O-dealkylation and mephenytoin N-demethylation, respectively (Fig. 2; Table 4). A somewhat weaker correlation was found between the activities and mRNA levels of CYP2C9, CYP2C19, CYP2D6, and CYP3A4, if all donors were included in the correlation analysis irrespective of their P450 genotype (results of the analysis are not shown). The most common polymorphisms of the CYP2C9 gene in white populations, CYP2C9*2 (430C>T) and CYP2C9*3 (1075A>C) alleles, produce enzymes with reduced function. The prevalence of the allelic variants for CYP2C9 was found to be 7.9% for CYP2C9*2 and 7.0% for CYP2C9*3. The donors with a mutated CYP2C9 gene were excluded from the correlation analysis, and homozygous wild types were analyzed. A strong association between the hepatic CYP2C9 mRNA levels and tolbutamide 4-hydroxylation activity (rS = 0.9255) was displayed in donors with the CYP2C9*1/*1 genotype (Fig. 2; Table 4). Mutations in the CYP2C19 gene, resulting in nonfunctional CYP2C19 alleles, CYP2C19*2 (681G>A) and CYP2C19*3 (636G>A), were also determined in liver donors. The CYP2C19*2 allelic variant was detected with a frequency of 18.3% in the liver donors, whereas the CYP2C19*3 allele was not observed at all. Excluding the donors carrying the CYP2C19*2 allele from the correlation analysis, the hepatic mephenytoin 4-hydroxylation activity of the donors with the CYP2C19*1/*1 genotype significantly correlated with the CYP2C19 mRNA levels in the liver (rS = 0.8808). A deficiency of the CYP2D6 gene, resulting in CYP2D6*3 (2549delA) and CYP2D6*4 (1846G>A) alleles, is associated with the lack of enzyme activity, whereas the CYP2D6*6 mutation (1795delT) leads to a lack of enzyme protein and consequently to a lack of CYP2D6 activity. The prevalence of the CYP2D6*4 allelic variants was relatively high (17.4%), whereas the occurrence of both CYP2D6*3 and CYP2D6*6 was found to be 0.89%. A correlation analysis was carried out with the donors having exclusively the wild-type CYP2D6 gene, and a strong association was found between the hepatic CYP2D6 mRNA levels and dextromethorphan O-demethylase activities (rS = 0.9130).

Correlation of relative P450 gene expression and corresponding P450 activities in the liver. If Spearman's correlation coefficient (rS) was higher than 0.7, P450 expression levels and the corresponding hepatic P450 activities were defined as closely associated.
Relationship between P450 enzyme activities and mRNA levels in liver and leukocytes
Spearman's correlation coefficients (rS), 95% confidence intervals (95% CI), and probability values (P) were calculated.
CYP3A4 forms the bulk of the hepatic CYP3A protein and activity (approximately 95% of the CYP3A pool); however, the other members, primarily CYP3A5, can also contribute to the metabolism of CYP3A substrates in an adult liver. The CYP3A5*3 mutation (6986A>G in intron 3) results in a splicing defect, leading to a lack of the CYP3A5 enzyme. The estimated CYP3A5*3 allele frequency is more than 90% in the white population. Those individuals who have a functional CYP3A5 enzyme (with CYP3A5*1/*1 and CYP3A5*1/*3 genotypes) metabolize some CYP3A substrates (e.g., tacrolimus, cyclosporine A, nifedipine, and midazolam) more rapidly than CYP3A5 nonexpressors. Some 89.5% of the Hungarian donors did not express functional CYP3A5, carrying the CYP3A5*3/*3 genotype. We did not find the homozygous wild-type genotype (CYP3A5*1/*1) among the donors investigated, but the functional CYP3A5*1 allele was detected in donors with the heterozygous genotype. The frequency of wild-type (CYP3A5*1) allele was found to be 5.5% in the liver donors. Excluding the donors with the CYP3A5*1/*3 genotype from the correlation analysis, a strong correlation was displayed between hepatic CYP3A4 expression and all three CYP3A activities (nifedipine oxidation and midazolam 1′- and 4-hydroxylation) (Fig. 2; Table 4).
P450 Expression in Leukocytes.
Although liver biopsies can be available, it is risky and impractical to obtain specimens from the liver in patients. The major advantage would be in easily accessible biological samples, e.g., peripheral blood, providing information on drug-metabolizing capacity. Mature human erythrocytes, the main cellular components of blood, are anucleate cells; thus they are not capable of active RNA synthesis. However, Kabanova et al. (2009) provided strong evidence that red blood cells have substantial RNA content. This fact supports the assumption of nucleus-independent protein synthesis and an obvious lack of the transcriptional regulation of gene expression in mature erythrocytes. Consequently, the mRNA levels of various genes indicate the current regulatory effects of environmental and internal factors before the moment of nucleus discarding and do not display a prompt transcriptional response to transient modulation during the 120-day lifespan in circulation. Leukocytes are nucleated cells displaying active RNA synthesis; thus, they were chosen as the target cells of the P450 status assays. Leukocytes were isolated from peripheral blood samples, and the expression levels of P450 genes in leukocytes were determined in the same donors whose hepatic P450 activities and P450 mRNA levels were measured. The P450 expression profiles of the leukocytes showed some similarities to the liver; however, the expression levels displayed significant differences. All of the P450 mRNAs that were detected in liver tissues were also expressed in leukocytes, in contrast to those observed in other studies. Koch et al. (2002) could not detect mRNAs of the CYP3A subfamily, whereas Furukawa et al. (2004) could not display the expression of CYP2C9, CYP2C19, CYP2D6, and CYP3A4 in peripheral blood cells. Artifactual causes due to inappropriate sample collection and storage, inefficient RNA isolation procedure, or inadequate primer/probe design might have led to their negative results. Koch et al. (2002) isolated the total RNA from lymphocytes by using the RNeasy kit (QIAGEN, Hilden, Germany), whereas Furukawa et al. (2004) used the QIAGEN miniprep kit for RNA extraction from leukocytes. Both kits offer an easy isolation procedure and produce high-purity RNA samples, and they are efficient in the isolation of transcripts expressed in relatively large amounts. According to our experience, the isolation of P450 mRNAs from leukocytes using these QIAGEN kits seemed to be inefficient, whereas TRIzol reagent (Invitrogen) or TRI reagent (Molecular Research Center, Cincinnati, OH) was found to be appropriate for the extraction of the P450 mRNAs present in relatively small amounts.
In our study, the relative expression of various P450s was generally 102- to 104-fold higher in liver tissues than in leukocytes, except for CYP2B6 (Table 3). The expression of the CYP2B6 gene in leukocytes was just 20-fold lower than in liver tissues. High interindividual variations of P450 expression were also detected in leukocytes, similar to the liver tissues. The largest variations (104- to 105-fold) between individuals were found in the expression of CYP2B6, CYP2D6, and CYP3A4 in leukocytes, whereas CYP1A2 and CYP2C9 mRNA levels displayed only 285- and 445-fold variations, respectively.
Correlation between P450 Enzyme Activities in the Liver and P450 Expression in Leukocytes.
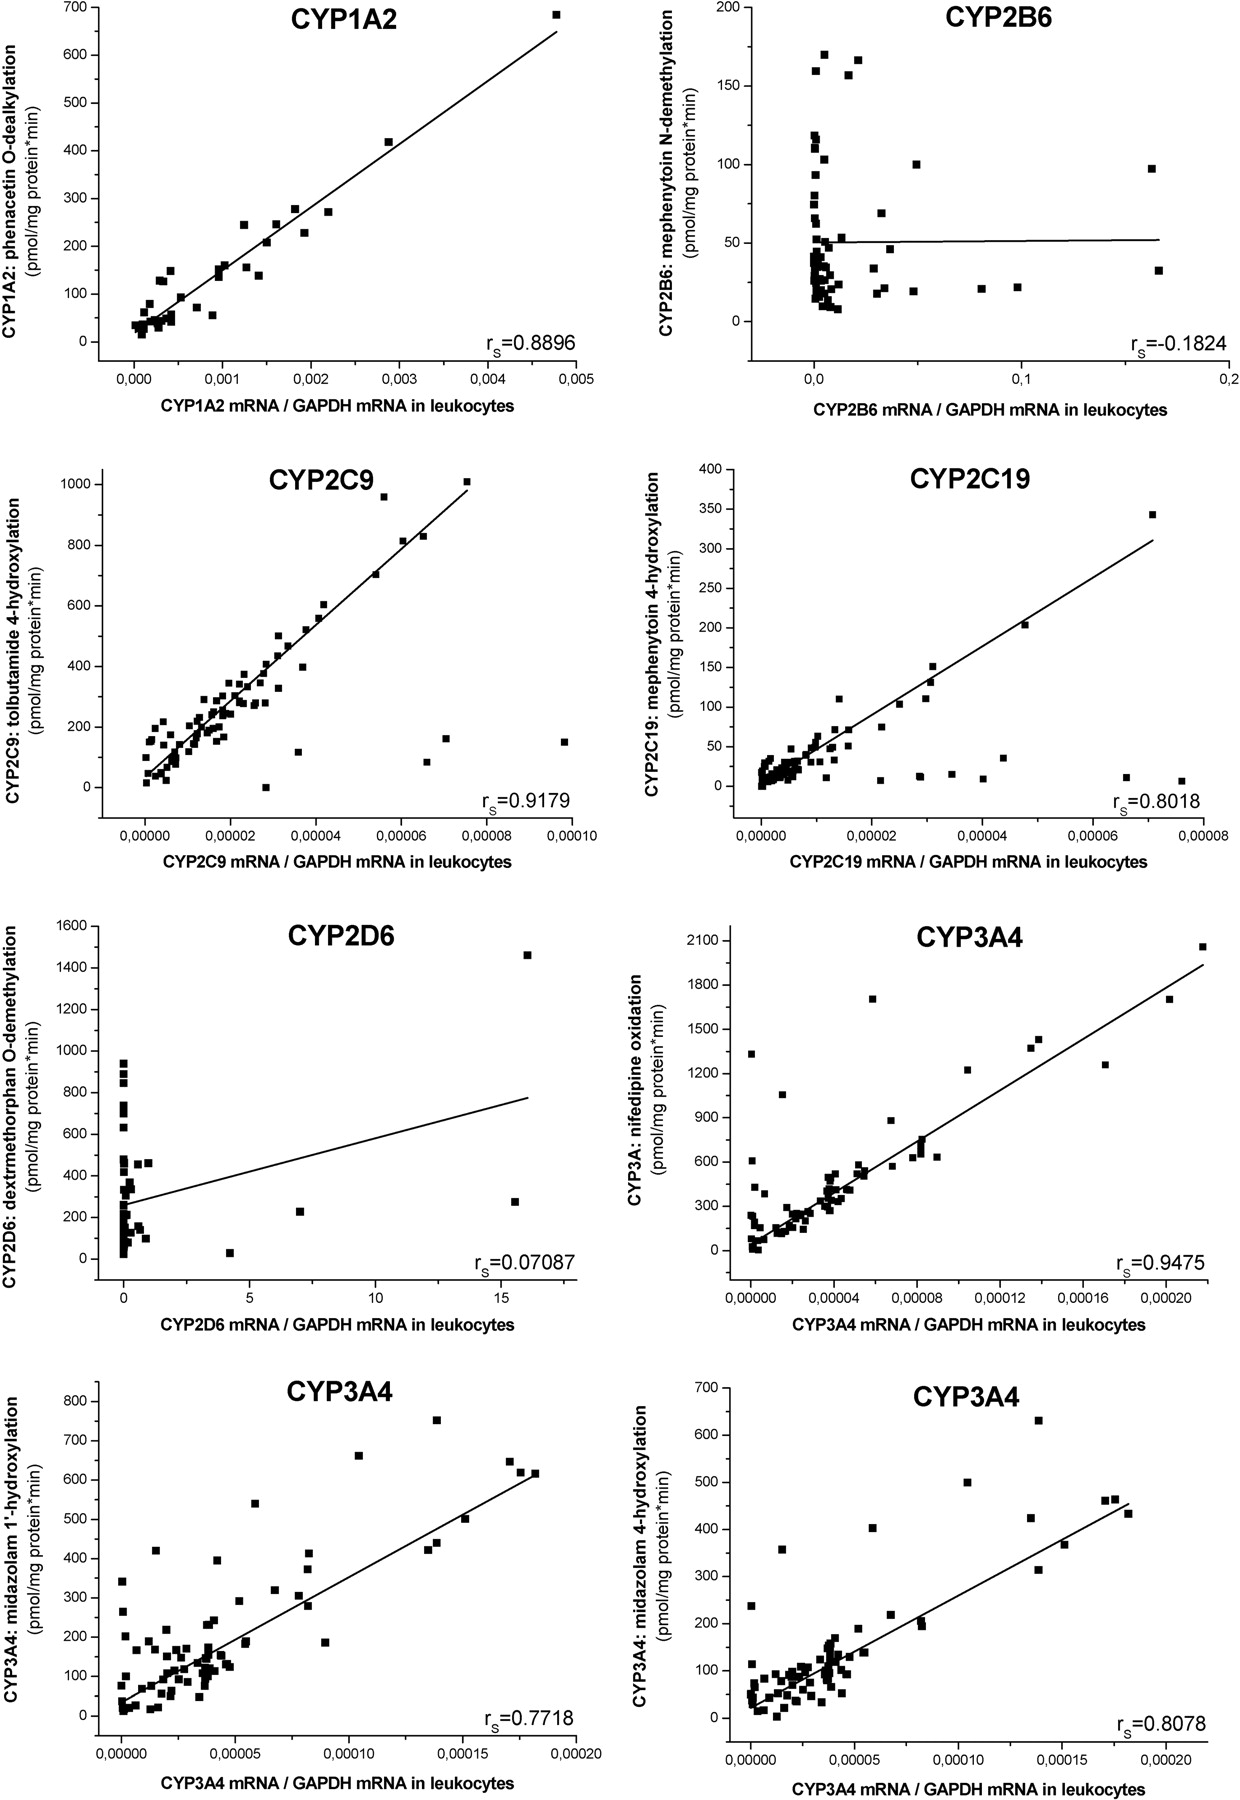
Taking blood from patients and isolating leukocytes is a simple way to obtain biological material that may be assumed to provide sufficient information on hepatic drug-metabolizing capacity. Our aim was to study the relationship between P450 enzyme activities in the liver and the expression of P450 genes in leukocytes collected simultaneously. If Spearman's correlation coefficient was higher than 0.7, we defined the P450 expression levels in leukocytes and the corresponding hepatic P450 activities as closely associated.
The CYP1A2 mRNA levels in leukocytes significantly correlated with the activity of phenacetin O-dealkylation in the liver (Fig. 3; Table 4). Thus we can conclude that the CYP1A2 expression in leukocytes reflects hepatic CYP1A2 activity. The donors carrying mutated CYP2C9 alleles (CYP2C9*2 or CYP2C9*3) were excluded from correlation analysis. The strong association between CYP2C9 mRNA levels in leukocytes and tolbutamide 4-hydroxylation activity in liver was also displayed in donors with the CYP2C9*1/*1 genotype. The expression levels of CYP2C19 in leukocytes were closely associated with mephenytoin 4-hydroxylation in the liver of the donors carrying the CYP2C19*1/*1 genotype. In conclusion, the leukocytes isolated from subjects carrying wild-type CYP2C9 or CYP2C19 reflect hepatic CYP2C9 and CYP2C19 activities. Furthermore, all three CYP3A activities in hepatic microsomes displayed a close correlation with CYP3A4 mRNA levels in leukocytes, if we excluded the donors with CYP3A5*1 alleles from the correlation analysis. On the other hand, no association could be observed for the expression of CYP2B6 or CYP2D6 in leukocytes and hepatic enzyme activities, mephenytoin N-demethylation, and dextromethorphan O-demethylation, respectively (rS = −0.1824, P = 0.1525 for CYP2B6 and rS = 0.07087, P = 0.5905 for CYP2D6).

Correlation of relative P450 gene expression in leukocytes and corresponding P450 activities in the liver. If Spearman's correlation coefficient (rS) was higher than 0.7, P450 expression levels in leukocytes and the corresponding hepatic P450 activities were defined as closely associated.
Cutoff Values for Distinguishing Poor, Intermediate, and Extensive Metabolizers.
The drug-metabolizing capacity of the liver tissues was qualified according to the frequency distributions of hepatic CYP1A2, CYP2B6, CYP2C9, CYP2C19, CYP2D6, and CYP3A4 activities in 164 Hungarian donors. The first and third quartiles determined the cutoff values between the categories of low, medium, and high P450 activities, characterizing poor, intermediate, and extensive metabolizer phenotypes, respectively (Table 2). The expression of these P450s in the liver exhibited a strong correlation with hepatic P450 activities; therefore, an estimation of a patient's drug-metabolizing capacity could be carried out on the basis of the mRNA levels in a liver biopsy sample. The optimal cutoff values for mRNA levels of CYP1A2, CYP2B6, CYP2C9, CYP2C19, CYP2D6, and CYP3A4 in the liver were set on the basis of the cutoff values for hepatic P450 activities, allowing a distinction between poor, intermediate, and extensive metabolizers (Table 5). The mRNA levels of CYP2B6 and CYP2D6 in the leukocytes did not correlate with the respective P450 activities in the liver, and consequently the leukocytes could not serve as appropriate cells for the assessment of hepatic CYP2B6 and CYP2D6 activities. However, the expression of CYP1A2, CYP2C9, CYP2C19, and CYP3A4 in leukocytes was proven to reflect the respective P450 activities in the liver, thus the hepatic activities of these P450 enzymes were suggested to be qualified by the leukocyte mRNA levels of these P450 species. The cutoff values for the mRNA levels of CYP1A2, CYP2C9, CYP2C19, and CYP3A4 in leukocytes were also established on the basis of the cutoff values for the hepatic P450 activities, allowing a distinction between poor, intermediate, and extensive metabolizers (Table 5).
Cutoff values for P450 mRNA levels relative to GADPH mRNA in liver tissues and leukocytes distinguishing poor (PM), intermediate (IM), and extensive (EM) metabolizers
Discussion
The personalized medication of modern therapy requires reliable diagnostic tools to estimate a patient's drug-metabolizing capacity. Although the assessment of overall drug metabolism is difficult to establish, much information can be obtained by using some simplification: 1) the enzymes involved in the biotransformation of drugs are located primarily in the liver; 2) the majority of drugs are metabolized by P450 enzymes; and 3) approximately 90% of drugs in clinical practice undergoing oxidative biotransformation involve at least a partial metabolism by one or more enzymes belonging to the CYP1-3 family (e.g., CYP1A2, CYP2B6, CYP2C9, CYP2C19, CYP2D6, and CYP3A) (Chen et al., 2011). Thus, drug-metabolizing capacity can be approximately assessed through an integrative analysis of the current hepatic expression of P450 enzymes and the genomic identification of defective P450 alleles. The qualification of the patient's drug-metabolizing status together with personalized medication can contribute to the improvement of drug therapy, resulting in increasing drug efficacy and a decreasing risk of adverse drug events. Liver biopsies are generally not available from patients; however, information on drug-metabolizing capacity obtained from leukocytes would be of clinical interest if the P450 mRNA levels in leukocytes reflect the hepatic P450 activities. Nevertheless, a series of questions arises: 1) does the expression of drug-metabolizing P450 genes in leukocytes reflect hepatic P450 activities; 2) is the regulation of P450 expression in leukocytes similar to that of the liver; and 3) can we obtain information on hepatic drug-metabolizing capacity from leukocytes? To answer these questions, the present study was designed to investigate P450 mRNA levels in leukocytes collected simultaneously with liver tissues and study the correlation between P450 expression and hepatic P450 activities.
The basic methods for estimating drug-metabolizing capacity are a determination of the catalytic activities of individual P450s by P450-selective activity probes (Yuan et al., 2002). Although these techniques are reliable in hepatic microsomes, the catalytic analyses require a relatively large amount of liver tissues, which is a serious drawback for human studies. P450 enzyme assays require relatively large amounts of microsomal proteins (0.2–0.25 mg), which in practice cannot be obtained from leukocytes, thus the correlation between liver and blood activities cannot be analyzed. The levels of mRNAs as the prerequisite for enzyme proteins and enzyme activities can be determined in small amounts of biological material. The P450 mRNA content of the liver or leukocytes may be assumed to correlate with hepatic P450 activities. If the correlation is high, the activity levels can be estimated by measuring the P450 mRNA content. We determined the hepatic activities of the six most relevant drug-metabolizing P450s (CYP1A2, CYP2B6, CYP2C9, CYP2C19, CYP2D6, and CYP3A4) and the mRNA levels in the liver and leukocytes of 164 cadaveric donors.
The relationships between the hepatic mRNA levels and P450 activities were established to find evidence for P450 gene expression that could provide accurate information about P450 activities. A strong correlation (rs > 0.87) was displayed between CYP1A2 mRNA and phenacetin O-dealkylation, suggesting that the hepatic expression of the CYP1A2 gene reflects the CYP1A2 activities in the liver. A similar conclusion was drawn from the results of Rodríguez-Antona et al. (2001) and George et al. (1995), obtaining a potential association between hepatic CYP1A2 mRNA levels and 7-methoxyresorufin O-demethylation activity or CYP1A2 protein content. We also found a close relationship between the hepatic mRNA levels and the mephenytoin N-demethylation of CYP2B6 (rs = 0.89). However, Rodríguez-Antona et al. (2001) reported a weaker correlation between the hepatic CYP2B6 mRNA levels and the benzoxyresorufin O-debenzylation activities of 12 human liver samples (r = 0.52). The fact that the benzoxyresorufin O-debenzylation is catalyzed by both CYP2B6 and CYP3A4 (Niwa et al., 2003) could account for the lower correlation coefficient found in CYP2B6 by Rodríguez-Antona et al. (2001).
CYP2C9, CYP2C19, CYP2D6, and CYP3A4 showed a somewhat weaker correlation if the hepatic mRNA levels and activities were compared for all of the donors. Genetic polymorphisms, producing less active P450 enzymes or even null activities, are responsible for the fact that some liver tissues displayed relatively high mRNA levels but low activities of CYP2C9, CYP2C19, or CYP2D6. Therefore, a preliminary P450 genotyping study, detecting the most frequent P450 polymorphisms in white populations, was carried out before the estimation of the relationship between hepatic P450 mRNA levels and activities. The donors carrying mutant P450 alleles (heterozygous or homozygous for CYP2C9*2, CYP2C9*3, CYP2C19*2, CYP2C19*3, CYP2D6*3, CYP2D6*4, and CYP2D6*6) were excluded from the correlation analyses. The high correlation coefficients (rs >0.88) indicated that the hepatic expression of CYP2C9, CYP2C19, and CYP2D6 genes is appropriate for an estimation of P450 activities. George et al. (1995) also reported a significant, but not close, correlation between CYP2C9 mRNA and enzyme protein, which was caused by the poor selectivity of the CYP2C antibody, recognizing not only CYP2C9 but several other CYP2Cs. Rodríguez-Antona et al. (2001) described the lack of correlation between the CYP2C9 mRNA levels and diclofenac 4′-hydroxylation; however, they did not take allelic variants producing nonfunctional enzymes into account. They found a lower correlation between the hepatic CYP2D6 mRNA levels and dextromethorphan O-demethylation than we observed, most likely because of neglecting the CYP2D6 polymorphic alleles.
For CYP3A, the liver tissues of some donors showed relatively high activities but low CYP3A4 expression. The weak correlation was assumed to be caused by CYP3A5 polymorphism, because the functional CYP3A5 enzyme as the product of CYP3A5*1 allele also catalyzes the metabolism of the CYP3A substrates to some extent. The relatively rare CYP3A5*1 allele (5–10% of the white population) and eventually the functional CYP3A5 enzyme can contribute to the overall metabolism of CYP3A substrates, such as nifedipine, midazolam, cyclosporine, tacrolimus, erythromycin, carbamazepine, and lidocaine (Patki et al., 2003; Huang et al., 2004; Dai et al., 2006). Thus, we excluded the donors with the CYP3A5*1 allele from the correlation analysis, which resulted in a much stronger correlation between the hepatic CYP3A4 mRNAs and CYP3A activities (rs >0.8). In previous studies by Sumida et al. (1999) and Rodríguez-Antona et al. (2001), a relatively high correlation between the CYP3A4 mRNA amounts and testosterone 6β-hydroxylation was observed. Hepatic CYP3A4 expression also seemed to be related to the normalized plasma concentrations (plasma level/dose × weight) of the CYP3A substrates, cyclosporine or tacrolimus, in liver transplants (Thörn et al., 2004).
Hepatic P450 activities are considered to best characterize a patient's drug metabolism, although P450 mRNA levels in leukocytes may provide a tool for estimating the drug-metabolizing capacity of the liver. Information about intraindividual correlations between hepatic P450 activities and blood mRNA levels is virtually nonexistent. Although several efforts have been undertaken to establish P450 mRNA levels in liver tissues and blood (Finnström et al., 2001; Koch et al., 2002; Nowakowski-Gashaw et al., 2002; Furukawa et al., 2004; Lee et al., 2010), a comprehensive analysis of the relationship between hepatic P450 activities and P450 mRNA levels in leukocytes has not been reported. Finnström et al. (2001) demonstrated no correlation of CYP1A2 and CYP3A4 expression in blood with mRNA levels of CYP1A2 and CYP3A4 in the liver, which was caused by the RNA extraction from whole-blood samples. Leukocytes can be assumed, but red blood cells cannot be expected, to reflect hepatic P450 expression, because peripheral red blood cells are in different maturation and turnover status, displaying different transcriptional responses to environmental and internal factors. No association was observed between the CYP1A2 mRNA levels in the liver and leukocytes by Furukawa et al. (2004); furthermore, CYP2C9, CYP2C19, or CYP3A4 mRNA was undetectable in the leukocytes. The yield rate of P450 mRNA from the leukocytes using the QIAGEN miniprep kit or a less sensitive analytical method could be the limitations for the detection of P450 expression in leukocytes. Lee et al. (2010) reported a poor correlation of CYP3A4 mRNA levels between the liver and leukocytes, although the limited number of samples (n = 5) cannot provide strong evidence for a correlation. We demonstrated that the mRNA levels of CYP1A2, CYP2C9, CYP2C19, and CYP3A4 in leukocytes correlated strongly with P450 activities in the liver, allowing a good estimation of the hepatic drug-metabolizing activities of these cytochromes. Preliminary P450 genotyping for frequent mutations in P450 genes was necessary to discard the subjects carrying polymorphic P450 alleles, which can be transcribed, but are not associated with enzyme activities. The leukocyte P450 expression of the donors with homozygous wild-type genotypes for CYP2C9 and CYP2C19, and with homozygous mutant genotypes for CYP3A5, strongly reflected the hepatic activities of CYP2C9, CYP2C19, and CYP3A. It should be noted that the mRNA levels of CYP2B6 and CYP2D6 in leukocytes did not display any relationship to hepatic P450 activities. Although polymorphic CYP2D6 alleles can provide information on CYP2D6 poor metabolism, the current CYP2D6 activities in the liver cannot be estimated from the CYP2D6 mRNA levels in leukocytes.
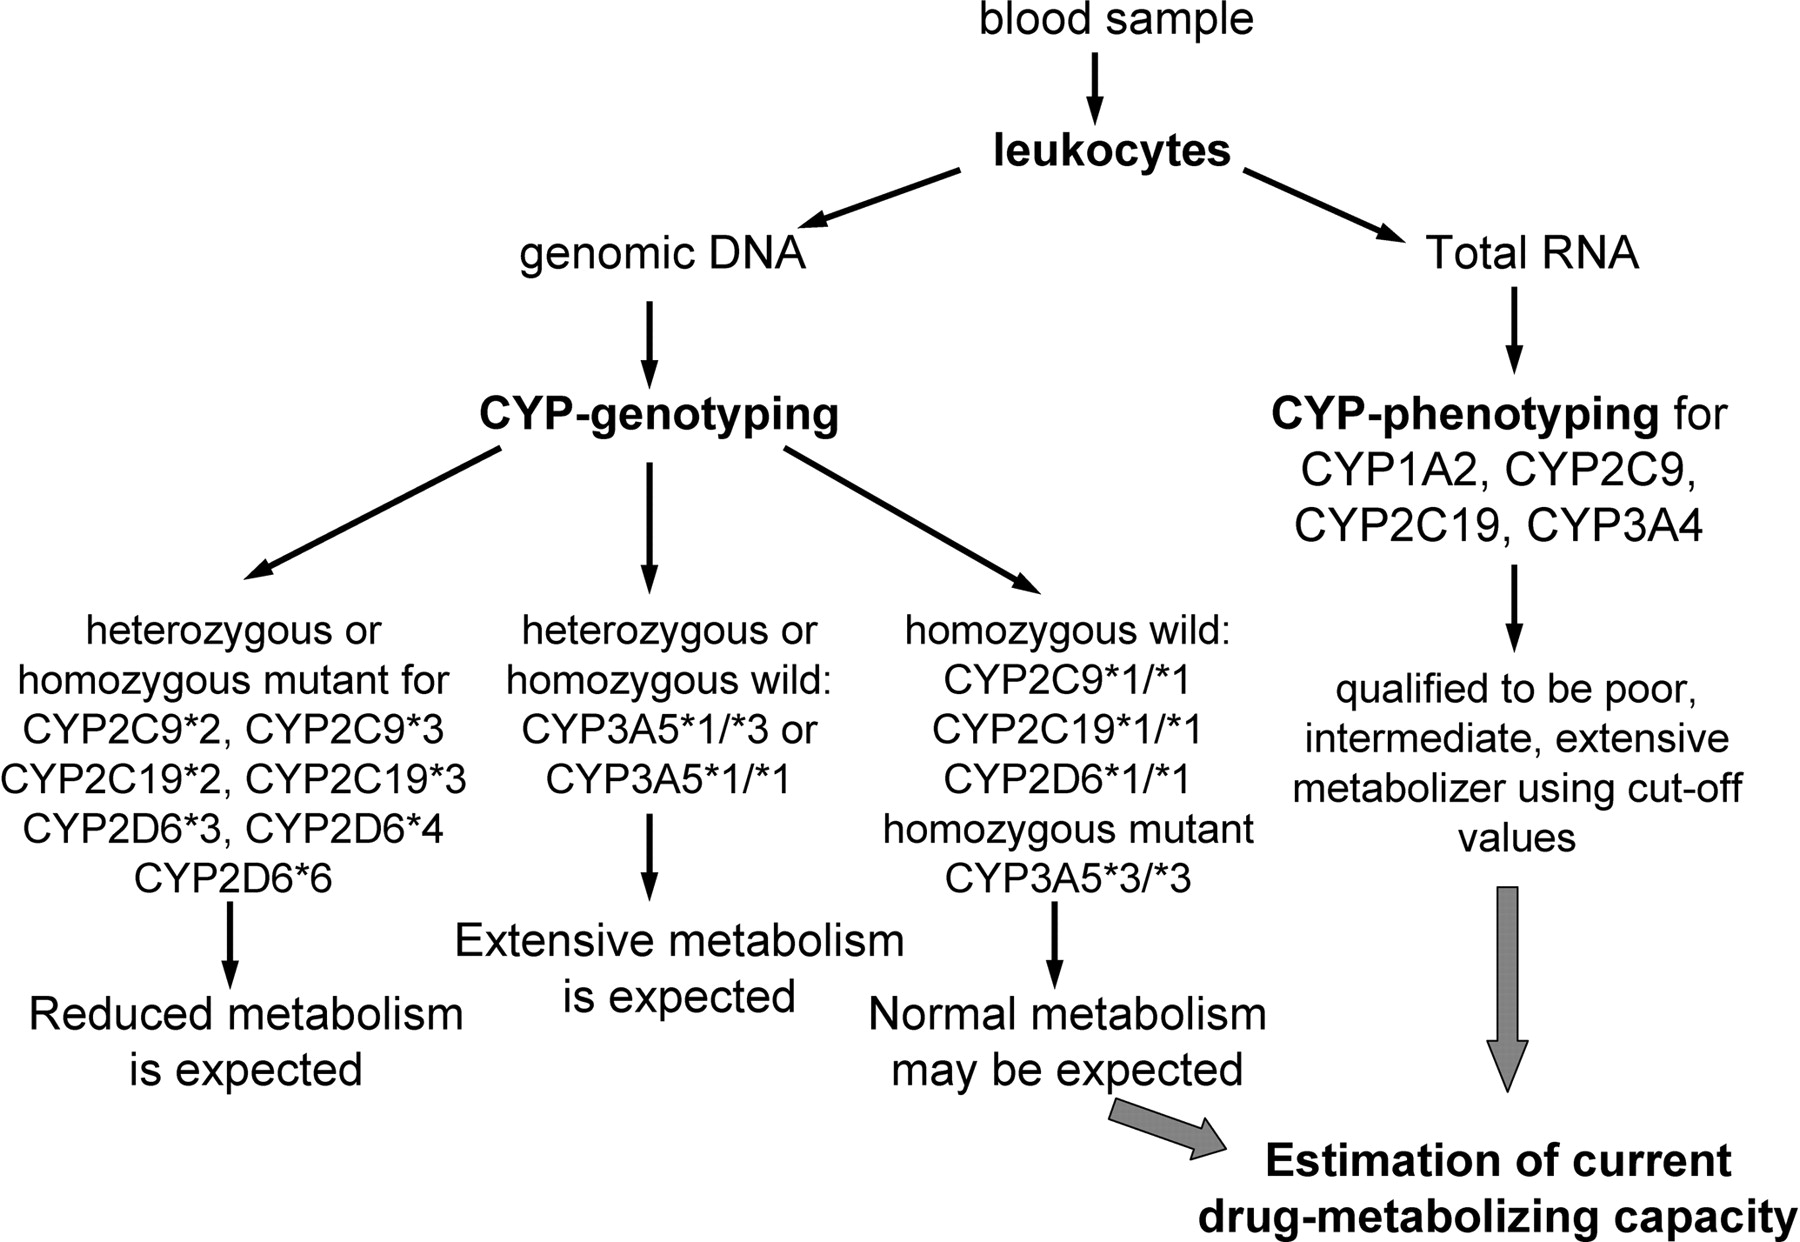
The present work indicates that hepatic P450 activities can be estimated by combining P450 genotyping and phenotyping analysis of liver biopsy samples or leukocytes. It is suggested that P450 genotyping analysis for frequent mutations in P450 genes should be carried out first. P450 genotyping determines the permanent poor metabolism, because defective P450 alleles produce enzymes with reduced activity or even nonfunctional enzymes. P450 phenotyping analysis of liver samples for CYP1A2, CYP2B6, CYP2C9, CYP2C19, CYP2D6, and CYP3A4 provides information about the current hepatic P450 activities in those subjects who do not carry mutations in CYP2C9, CYP2C19, and CYP2D6 genes and have the CYP3A5*3/*3 genotype. Peripheral blood is a more easily accessible biological sample; therefore, a P450 phenotyping analysis of leukocytes is preferred to that of liver tissues. P450 phenotyping for CYP1A2, CYP2C9, CYP2C19, and CYP3A4 in leukocytes provides information on hepatic P450 activities in those subjects who carry homozygous wild-type genotypes of CYP2C9 and CYP2C19 or a homozygous mutant genotype of CYP3A5 (Fig. 4). In conclusion, a patient's drug-metabolizing capacity can be qualified by P450 genotyping and phenotyping in liver samples and in leukocytes with some limitations. The profile of a patient's genetic and nongenetic variations in drug metabolism can guide the selection of drugs and the optimal dose that can minimize harmful side effects and ensure a more successful outcome. Tailored medication eventually will contribute to the improvement of the quality of patients' lives.

Estimation procedure for a patient's drug-metabolizing capacity in leukocytes isolated from peripheral blood.
Authorship Contributions
Participated in research design: Kóbori and Monostory.
Conducted experiments: Temesvári, Kóbori, Paulik, Sárváry, and Monostory.
Contributed new reagents or analytic tools: Temesvári, Paulik, and Monostory.
Performed data analysis: Belic and Monostory.
Wrote or contributed to the writing of the manuscript: Monostory.
Acknowledgments
We thank Maria Grenyi for skillful assistance and Matthias Schwab and Ulrich Zanger (Dr Margarete Fischer-Bosch-Institute of Clinical Pharmacology, Stuttgart, Germany) and Julia Kirchheiner (University of Ulm, Ulm, Germany) for positive control samples of various P450 genotypes.
Footnotes
This study was supported by the National Development Agency [Grant GOP-1.1.1-09/1-2009-0001], Slovenian-Hungarian Intergovernmental S&T Cooperation Programme [TÉT_10-1-2011-0616], and the Medical Research Council of Hungary [Grant ETT 099-03/2009].
Article, publication date, and citation information can be found at http://jpet.aspetjournals.org.
-
ABBREVIATIONS:
- P450
- cytochrome P450
- GAPDH
- glyceraldehyde 3-phosphate dehydrogenase
- SNP
- single-nucleotide polymorphism
- PCR
- polymerase chain reaction
- CI
- confidence interval
- QD
- quartile deviation.
- Received November 16, 2011.
- Accepted January 18, 2012.
- Copyright © 2012 by The American Society for Pharmacology and Experimental Therapeutics


