


Abstract
The Bcl-2 inhibitor S 55746 ((S)-N-(4-hydroxyphenyl)-3-(6-(3-(morpholinomethyl)-1,2,3,4-tetrahydroisoquinoline-2-carbonyl)benzo[d][1,3]dioxol-5-yl)-N-phenyl-5,6,7,8-tetrahydroindolizine-1-carboxamide) is able to restore apoptosis functions impaired by tumorigenesis in mice. Data from pharmacokinetic (PK), biomarker, and tumor growth studies in a xenograft mouse model were considered for population modeling. The aim of the modeling exercise was to link the kinetics of the drug to the biomarker and tumor-size time profiles to better understand its dose-effect relationship. The PK, caspase kinetics, and tumor dynamics were successfully characterized by the proposed pharmacokinetic-pharmacodynamic model. The nonlinear plasma PK was best described by a two-compartment disposition model with both saturable absorption and elimination. Caspase was activated above the effective drug-concentration threshold (CTHRE), at which near-maximal activity was reached. Increasing the dose did not increase the activation but better sustained it. Tumor growth followed a biphasic pattern, with caspase having an all-or-none inhibiting effect, consistent with the bistability property of the caspase pathway. For tumor eradication, the CTHRE in plasma was 2876 ng ml−1, and the relative caspase activity threshold (CaspTHRE) was 46.5. There was a strong relationship between the time spent above these thresholds and tumor growth inhibition. Tumor growth was inhibited by 50% when CaspTHRE was exceeded 13.8% of the time and when CTHRE was exceeded 8.1% of the time per dosing. This semimechanistic approach, based on experimental mice data and in vitro parameters, provides an interesting tool to quantify or simulate antitumor effects and, eventually, to plan phase 1 studies.
Introduction
Apoptosis is a mechanism of programmed cell death that may occur in pluricellular organisms. Several proteins are involved in the process, but two main pathways have been highlighted: the intrinsic or mitochondrial pathway (Parsons and Green, 2010) and the extrinsic or death receptor pathway. Both pathways lead to apoptosis by the same final process: caspase activation. Caspases (cysteine-dependent aspartate-specific proteases) are proteins that are highly conserved among species (Lamkanfi et al., 2002) and play a central role in the transduction of apoptotic signals. They are first synthesized as inactive procaspases. The initiator caspases respond to stimuli that cause their clustering. Such clustering allows them to activate automatically and permits them to trigger the effector caspases, which degrade various intracellular proteins to activate the cell death program (Nicholson and Thornberry, 1997; Thornberry and Lazebnik, 1998).
The Bcl-2 family proteins are a major part of the mitochondrial apoptotic pathway (Bagci et al., 2006). In many cancers, Bcl-2 antiapoptotic protein overexpression (Cosulich et al., 1997; Ottilie et al., 1997) impairs the ability of the cell to undergo normal apoptosis (Reed, 1999). This results in a failing cell, which is able to replicate and pass on defective functioning to its progeny, increasing the probability of the cell becoming cancerous. In this case, apoptosis does not arise because caspase activity is limited or inhibited. The development of anticancer treatments targeting this pharmacological pathway is a promising therapeutic strategy (Azmi et al., 2011; Nemati et al., 2014). However, due to the complexity of apoptosis regulation, understanding the dose-effect relationship of a drug candidate and extrapolating observations made in xenograft animal models to humans are challenging.
The modeling and simulation approach, based on a pharmacokinetic-pharmacodynamic (PK-PD) model, is a way to understand the dose-concentration-effect relationships early on and is increasingly used at all stages of drug development (Miller et al., 2005). In preclinical studies, mechanistic PK-PD models can be a scientific basis to predict in vivo compound effects from in vitro data, to explore and confirm the drug mechanism of action, and to understand inter- and intraindividual variability of the pharmacological response, thereby improving the drug candidate selection. This last point is especially relevant for anticancer drugs because their rate of approval after entry in phase I is approximately 5%, among the lowest of all therapeutic areas (Kola and Landis, 2004).
Few tumor growth inhibition models including biomarker kinetics have been published (Bueno et al., 2008; Yamazaki et al., 2012). To the best of our knowledge, the in vivo characterization of a drug acting on this pathway with caspase kinetics based on a PK-PD approach has not yet been described. A new Bcl-2 inhibitor compound, developed by Servier Laboratories (Suresnes, France), has been designed to restore apoptosis functions (Casara et al., 2018). The S 55746 ((S)-N-(4-hydroxyphenyl)-3-(6-(3-(morpholinomethyl)-1,2,3,4-tetrahydroisoquinoline-2-carbonyl)benzo[d][1,3]dioxol-5-yl)-N-phenyl-5,6,7,8-tetrahydroindolizine-1-carboxamide) drug targets the caspase system and restores effector caspase function, thereby inhibiting the antiapoptotic effect that results in tumorigenesis. Therefore, effector caspase activity can be used as a biomarker to monitor drug effects. Using data from in vitro experiments and in vivo studies in a xenograft mouse model treated with S 55746, the aim of this work was to propose a semimechanistic PK-PD model to characterize the relationships between dose, plasma concentration, caspase activity, and tumor size and to possibly exploit the model to anticipate clinical results.
Materials and Methods
Chemicals and Animals
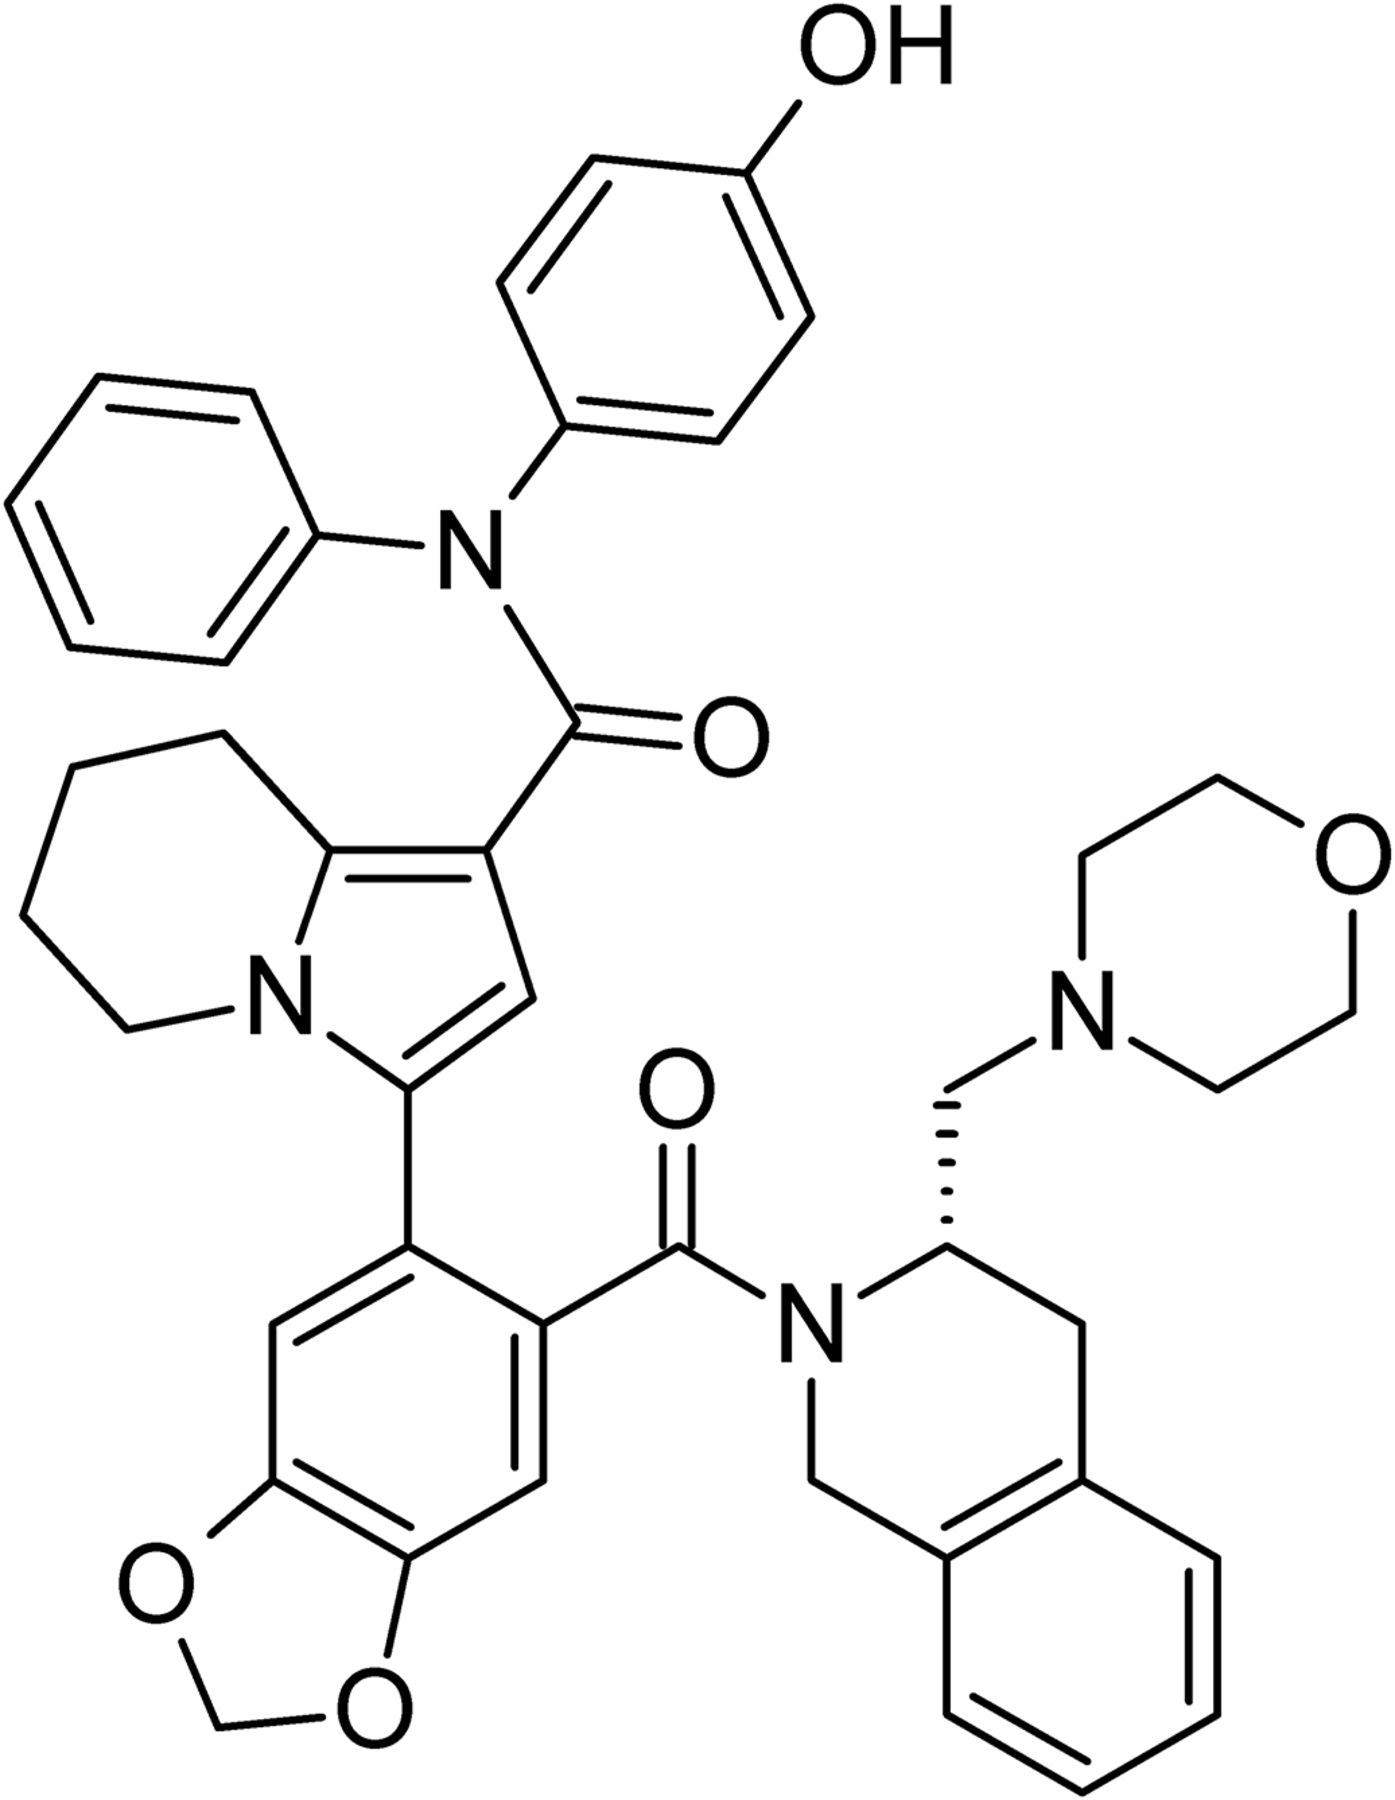
The S 55746 compound (Fig. 1) was provided by Servier Laboratories. Severe combined immunodeficient female mice were obtained from Charles River Laboratories (Wilmington, MA). All animal experiments were conducted in accordance with the current good practices and ethical principles.

Chemical structure of S 55746.
Study Description
S 55746 Plasma Concentration Analysis.
Two single-dose pharmacokinetic (PK) studies (after either intravenous or per os administration) were available to estimate PK parameters. Mice received a single oral administration of 3-, 10-, 12.5-, 25-, 30-, 50-, and 100-mg/kg doses by gavage for study 1 and were treated with an intravenous bolus of 1-, 3-, 10-, and 25-mg/kg doses for study 2. Blood samples were collected between 0.083 and 30 hours after the dose in two to five mice per time point. Study 3 was a repeated-administration study in which S 55746 was given by oral route at a dose of 100 mg/kg following three different regimens: five times per week, three times per week, or two times per week for 3 weeks. For each schedule, 12 animals were treated. Blood samples (n = 3 per time point) were collected at different time points on day 1 and day 11. In total, 268 blood samples were gathered from the three studies (details of the sampling design are presented in Supplemental Table 1). The drug concentrations in plasma were determined using liquid chromatography coupled with mass spectrometry in tandem. For this bioanalytical method, samples were thawed at room temperature, vortex mixed, and centrifuged. Aliquots of samples were added to the Ostro sample preparation plate (Waters; Milford, MA) with the internal standard to remove proteins and phospholipids. Plates were mixed at room temperature. After elution in a 96-well plate, 100 µl of the eluate was mixed and injected directly into the liquid chromatography coupled with tandem mass spectrometry system. Analytes were separated using a pentafluorophenyl column (100 × 2.1 mm, 2.6 µm). Multiple-reaction monitoring was selected for detection at m/z 711.4 > 624.4. Intra- and interday precisions were below 6%, whereas the absolute value of deviation was below 10% and the lower limit of quantification was 0.1 ng ml−1.
Receptor Occupancy and Caspase Activity Determination.
The PK-PD relationships involving caspase activity were investigated in two different studies with severe combined immunodeficient mice implanted subcutaneously with 10 million RS4;11 cells. In each study, after the tumor reached a mean volume of 200–300 mm3, mice were divided into different groups and received a single oral dose of vehicle or 12.5, 25, or 50 mg/kg of S 55746 for the first study and 3.125, 6.25, 12.5, or 25 mg/kg of S 55746 for the second study. Animals were sacrificed at 0.5, 2, 6, 16, and 30 hours after administration and tumors were removed for caspase activity determination. Each dose group was composed of 15 mice, and three samples were collected at each time point. Caspase activity was determined using a sandwich immunoassay method [MSD MULTI-SPOT Apoptosis Panel (Meso Scale Discovery)]. The instrument measures the intensity of emitted light to provide a quantitative measure of cleaved caspase, which reflects caspase activation.
Tumor Growth Studies.
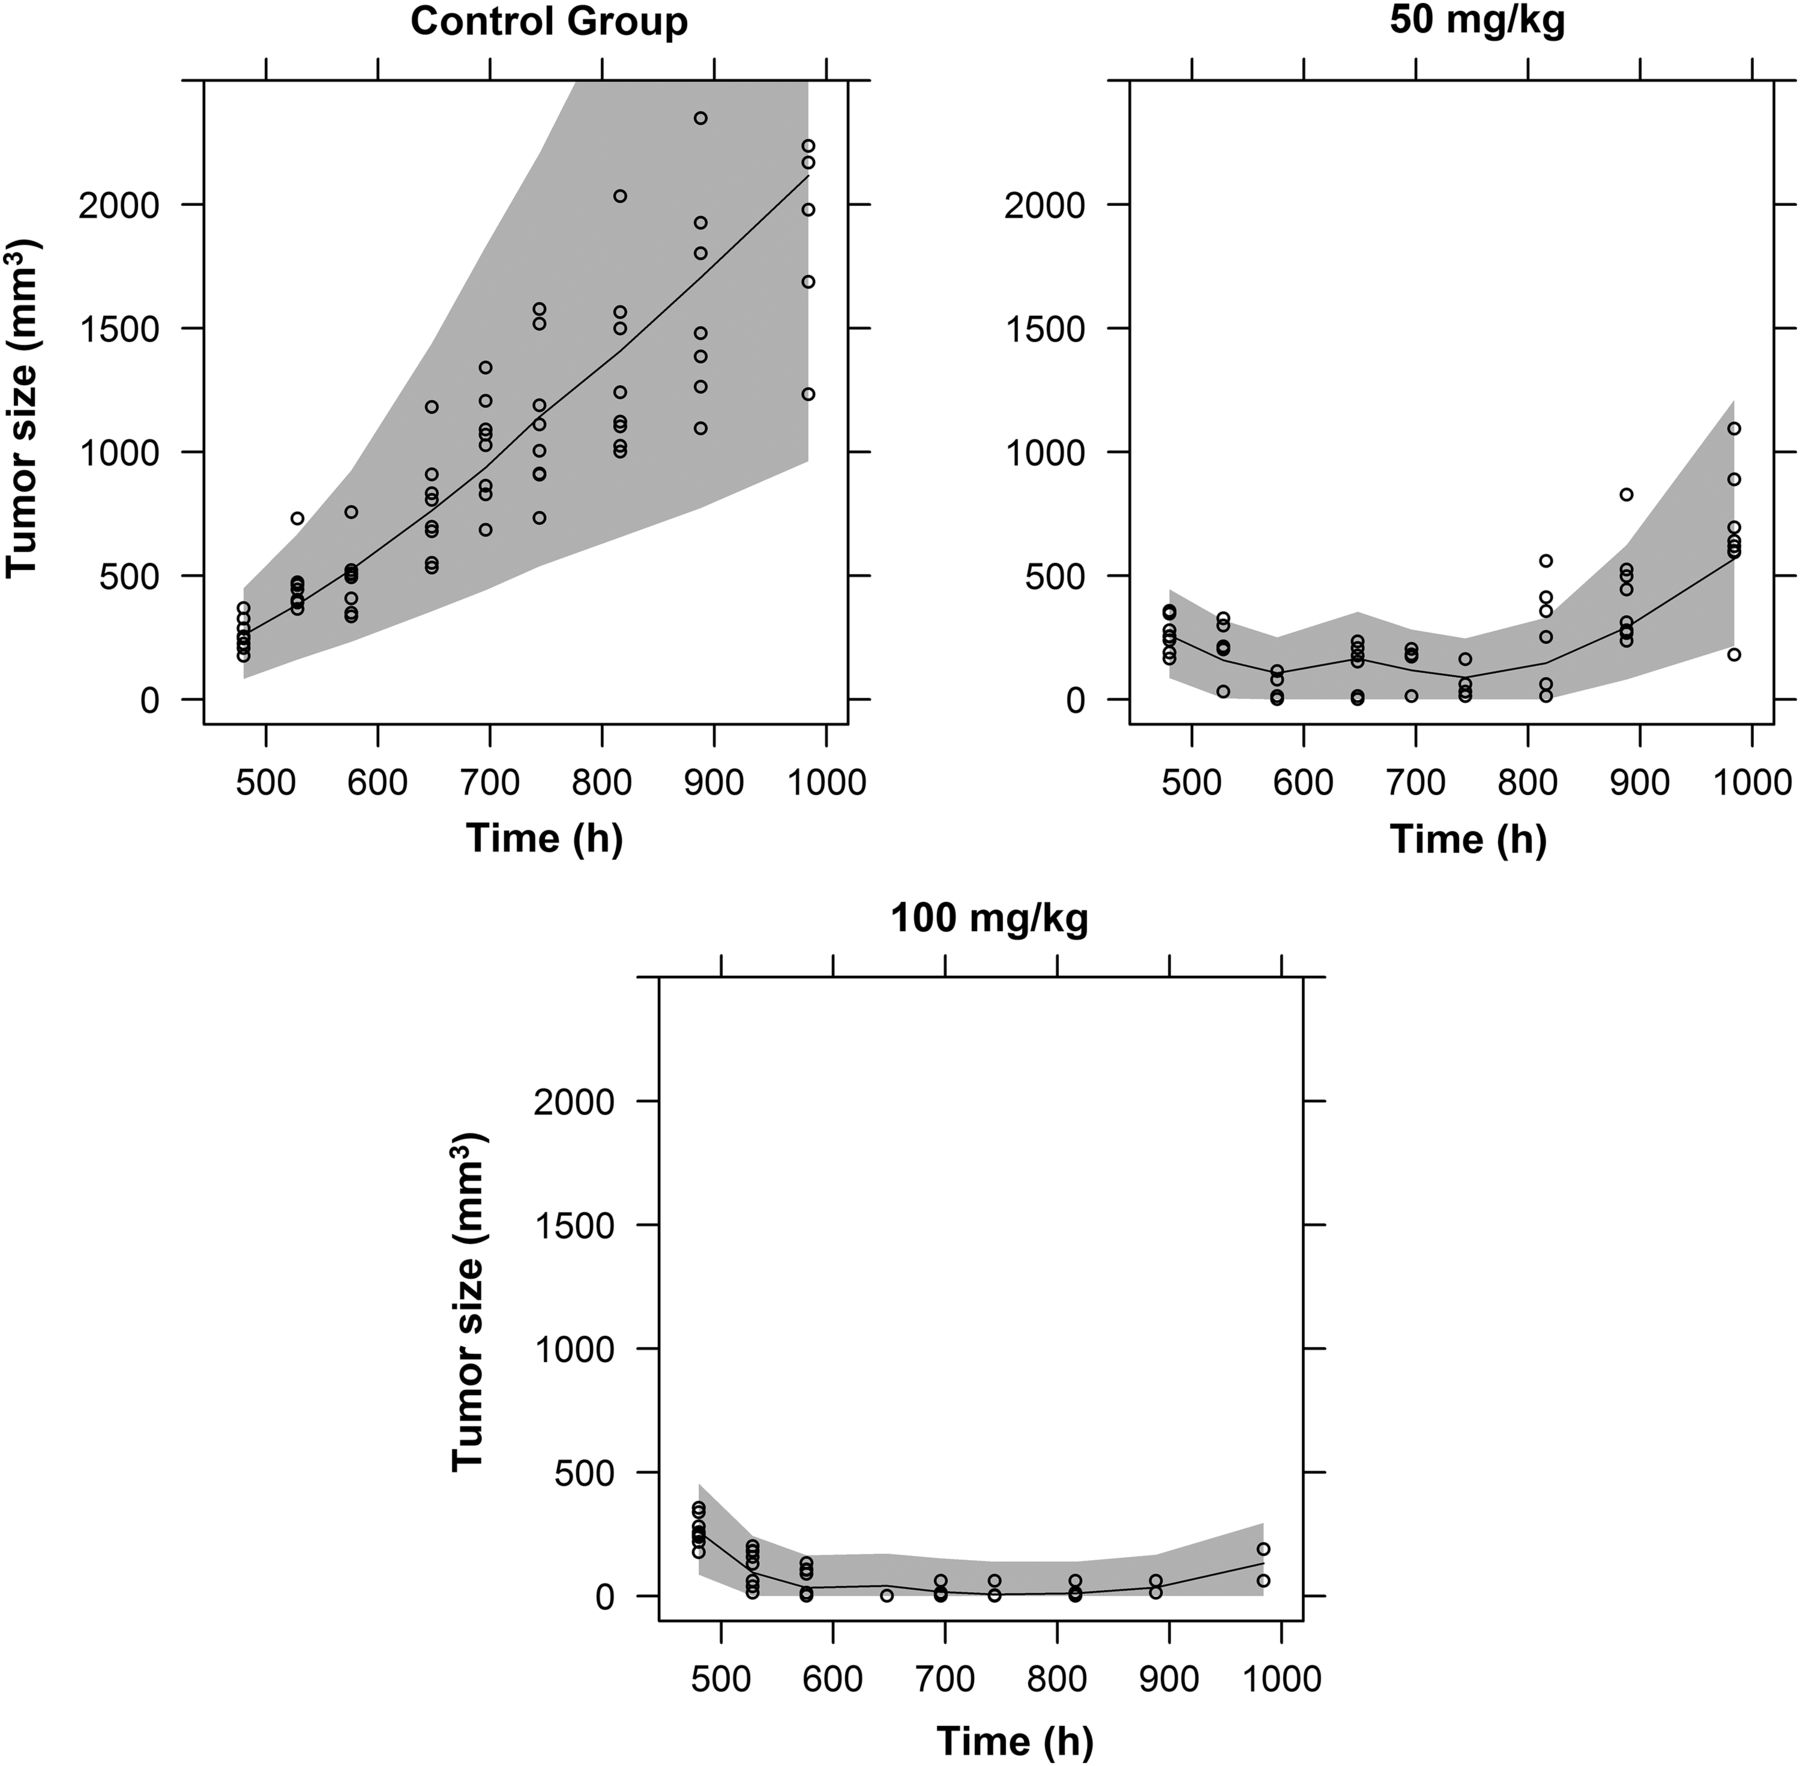
Tumor growth data were gathered from two independent studies (study A and study B). In both, 10 million RS4;11 cells were subcutaneously implanted into the right flank of each mouse. In study A, treatment was initiated when xenografted tumors reached a mean tumor volume of 90–130 mm3. Mice were treated orally once a day for 7 days with vehicle, 12.5, 25, 50, or 100 mg/kg of S 55746 and tumor sizes were monitored until 55 days after the last administration or sacrifice. In study B, treatment was administered when tumors reached a mean tumor volume of 100–400 mm3. Then S 55746 was given orally once a day for 5 days per week for 2 weeks with vehicle, 50, or 100 mg/kg of S 55746. Tumors were measured until 21 days after the last administration or sacrifice. In each study, eight mice were assigned to each dose group and tumor sizes were measured every 2–4 days after the first administration. Mice were sacrificed if the tumor volume exceeded 2000 mm3. Dimensions of the tumors were determined with a caliper. Tumor sizes expressed in cubic millimeters were calculated as follows, assuming an ellipsoid shape: (1)A flowchart describing the designs of the different parts is presented in Supplemental Fig. 1.
Data Analysis
Data were analyzed by a sequential approach. First, the PK model was established. Second, caspase activity data were analyzed to estimate pharmacodynamic (PD) parameters, fixing PK parameters to previously obtained estimates. In a third step, the unperturbed tumor growth model (in the absence of treatment) was developed and tumor growth inhibition under treatment was considered, fixing the dose–concentration–caspase activity relationship. A nonlinear mixed-effect modeling approach (Sheiner and Grasela, 1991) was used to analyze the data, taking into account the interindividual variability when many samples were available for each individual. The proposed model including plasma PK, caspase activity, and tumor growth models is shown in Fig. 2.

Integrated PK-PD model linking S 55746 plasma concentrations, receptor occupancy, caspase kinetics, and tumor growth inhibition. In this model, VMA is the maximum rate of absorption, kMA is the drug concentration corresponding to 50% of the maximum rate of absorption, k26 and k62 are the first-order distribution rate constants, kel is the first-order enzyme degradation rate constant, kM is the drug concentration corresponding to 50% of the maximum rate of elimination, VM is the maximum rate of elimination, Ceff is the effective concentration (from the effect compartment), fu is the unbound fraction, Kd is the dissociation constant from Bcl-2, δ is the free drug concentration threshold in plasma, I50 is the value of Bcl-2 at which caspase production is reduced by 50%, γ is the sigmoidicity coefficient, kin is the production rate of relative caspase activity, kout is the first-order degradation rate of caspase, k2 is the caspase rate constant for tumor growth inhibition, λ0 is the exponential growth rate, λ1 is the linear growth rate, and TG0 is the initial tumor size.
Pharmacokinetic Analysis.
The PK of the compound in plasma were described with compartmental models and nonlinear mixed-effect models. All PK studies were analyzed simultaneously. Time- and dose-dependent effects were considered since multiple dosing regimens and repeated-administration data were available. Preliminary in-house data suggested (after noncompartmental analysis) that nonlinear PK could be in part due to saturation of hepatic clearance at high doses. To take into account this nonlinearity, saturable processes for absorption and elimination were considered.
The saturable absorption rate can be described as follows (Couet et al., 1991): (2)where VMA is the maximum rate of absorption, KMA is the drug amount corresponding to 50% of the maximum rate of absorption, and A1 is the drug amount in the absorption site.
For the elimination process, saturation of the clearance can be expressed using the Michaelis-Menten equation as follows: (3)where Cl is the clearance from the central compartment, Vm is the maximum rate of elimination, Km is the drug concentration in plasma corresponding to 50% of the maximum rate of elimination, and Cp is the drug concentration in plasma.
After repeated oral administration, in-house data suggested a decrease in the exposure over time. Therefore, time-dependent nonlinearity was considered by assuming stimulation of the metabolism (Hassan et al., 1999) as follows: (4)With Vm = Vm0 ⋅ Enz and Enz(t=0) = 1, where Enz is the relative amount of the hypothetical enzyme responsible for the metabolism of S 55746, kprod is the zero-order production rate of the enzyme, kel is the first-order enzyme degradation rate constant, Emax is the maximum capacity for enzyme production stimulation, E50 is the drug concentration corresponding to 50% stimulation of enzyme production, and
  is the maximum rate of elimination of S 55746 for an enzyme relative amount equal to one. As dEnz/dt is equal to zero when no drug is given, it follows that kprod = kel.
Values that were below the limit of quantification were taken into account according to the so-called M3 method, which considers the likelihood of censored data, to keep as much information as possible (Beal, 2001; Ahn et al., 2008). Residual variability was characterized by a combined error model (i.e., with an additive and a multiplicative component), and interanimal variability was modeled by assuming independent log-normal distributions.
Biomarker and Receptor Occupancy Models.
The proapoptotic effect of S 55746 was defined by enhanced activation of caspase. The pharmacological target (Bcl-2) inhibits caspase when it is overexpressed in tumor cells, and S 55746 reverses this by binding to the pharmacological target and hindering its activity. The individual PK parameters method (Lacroix et al., 2012) was used to determine PD parameters since both caspase activity and plasma concentrations were measured in the same animals. In this method, individual PK parameters are fixed to their empirical Bayes estimates and used as input for PD parameter estimation. Since caspase activity in tumors was measured at the time of euthanasia, only one measure per animal was available, and interanimal variability could not be distinguished from residual variability.
The maximum plasma concentration was observed earlier than the apparent maximum caspase activity, suggesting a time delay between plasma concentration and caspase response (hysteresis); therefore, a nonlinear effect compartment was used (Sheiner et al., 1979) under an interface model (Meille et al., 2008): (5)where H is the Heaviside function, defined as:
 (6)and the relative activity of the pharmacological target, Bcl-2, was modeled as:
 (7)where Ceff is the effective concentration (from the effect compartment), Cp is the drug concentration in plasma, Kd is the dissociation constant derived from in vitro experiments, fu is the unbound fraction derived from in vitro experiments, δ is the threshold for the effective unbound drug concentration in plasma, kefo is the first-order elimination constant from the effect compartment, kefi is the first-order transfer rate into the effect compartment, and RT is the maximum fraction of receptor occupied (assumed equal to 1).
The effector caspase activity was modeled by an indirect effect model (Dayneka et al., 1993; Jusko and Ko, 1994) where the response (relative caspase activity) production rate is inhibited by Bcl-2: (8)where initial condition Casp0 = 1, kin is the zero-order production rate of Casp, kout is the first-order degradation rate constant, I50 is the value of Bcl-2 at which caspase production is reduced by 50%,, γ is the sigmoidicity coefficient, and Casp represents caspase activity as a fold increase from baseline:
 (9)At baseline, assuming steady-state caspase activity, Bcl-2 = 1 and dCasp/dt = 0. Hence, according to eq. 8, kin and kout are related:
 (10)so that kin does not need to be estimated.
Residual variability was characterized by an exponential error model (i.e., a model with a constant coefficient of variation, to be estimated).
Tumor Growth Model and Tumor Growth Inhibition.
Unperturbed tumor growth.
In the absence of treatment, a biphasic model allowing the switch from exponential to linear growth was used (Koch et al., 2009). We assume that, due to the initial abundance of oxygen and nourishment, the tumor grows exponentially in the first phase. Then the process is self-limiting due to the increasing tumor size, which in turn limits the supply of nourishment and oxygen and, consequently, slows down tumor growth (Simeoni et al., 2004; Herman et al., 2011), as follows: (11)where initial condition, TG(t = 0) = TG0, TG (cubic millimeters) is defined as the tumor volume, λ0 is the exponential growth rate, λ1 is the linear growth rate, TG0 (cubic millimeters) is the initial tumor size, and t is time. Time 0 was defined as the time of cell inoculation.
Perturbed tumor growth.
The tumor growth model was linked to the PK and caspase models presented earlier. Several models linking caspase activity to tumor growth were tested, including proportional, power, exponential, and sigmoidal. The most adequate model considered an all-or-none effect of caspase activity on tumor growth. Apoptosis, triggered by caspase activity above a given threshold, was assumed to act by killing tumor cells as follows: (12)
(12) (13)where Casp represents caspase activity as a fold increase from baseline, k2 is the caspase rate constant for tumor growth inhibition, H is the Heaviside step function, and CaspTHRE is the threshold value of Casp above which apoptosis is triggered.
The drug concentration in plasma required to reach CaspTHRE (defined here as CTHRE) was calculated as follows (see Appendix 1 for derivation): (14)Residual variability was characterized by a combined error model, and interanimal variability was modeled by assuming a log-normal distribution for the λ1 parameter.
Software and Model Evaluation.
All analyses were performed with NONMEM 7.3 (Beal et al., 2009) using the first-order conditional estimation with interaction algorithm (Wang, 2007) and PsN suite (Lindbom et al., 2004; Lindbom et al., 2005). Model diagnostics were performed using the Xpose4 package (Jonsson and Karlsson, 1999) in R software (version 3.0.2) (R Development Core Team, 2010). Model selection was based on several criteria, such as the objective function value, plausibility of estimates, standard errors, exploratory analysis of the goodness-of-fit plots, and residual distribution (Hooker et al., 2007). The likelihood ratio test is based on the difference in the objective function between two nested models, which are compared with a χ2 distribution. With one degree of freedom, a difference of 3.84 was significant at the 5% level. Agreement between the simulated and observed values was judged by visual inspection [visual predictive check (VPC) based on 500 simulated replications of the whole study] (www.page-meeting.org/?abstract=738; www.page-meeting.org/?abstract=1434).
Exploration of Model Properties.
Simulations of the caspase model after single administrations at different doses were performed to evaluate the impact of the dose on the caspase profile and to better understand the caspase kinetic characteristics. Then, simulations were used to explore the link between caspase and tumor growth and to find a relationship between PK or PD indexes and efficacy, where tumor growth inhibition (TGI) was defined as follows:
 (15)
(15)Results
A schematic representation of the dose–concentration–biomarker–tumor growth model is presented in Fig. 2. The characteristics of each component of the model are discussed here.
S 55746 Pharmacokinetics.
PK parameter estimates for the S 55746 are presented in Table 1. The nonlinear PK in plasma were best described by a two-compartment disposition model with a saturable absorption rate and elimination rate (as supported by preliminary studies) using Michaelis-Menten equations. The fit of the model with nonlinear absorption and elimination rates was significantly better than that with their linear counterparts (P < 0.001). Furthermore, sigmoidal and linear models were tested using the bioavailability parameter (F) to characterize nonlinear absorption, but the models had convergence difficulties (overparameterization) and were not better. Modeling the time-dependent nonlinearity demonstrated that as the concentration of the compound increased in the organism, it stimulated the production of the hypothetical enzyme responsible for the degradation of the compound. The fit of the time-dependent model was better than that of the time-independent model (P < 0.01). Overall, PK model parameters were estimated with an acceptable precision (Table 1), except for the time-dependent nonlinearity parameters, which was probably due to the design of the studies.
Pharmacokinetic parameter estimates of S 55746 in all studies after single and repeated administration
Interindividual variability was estimated for the F, Vc, and Km parameters. Empirical Bayesian estimates had a near-symmetric distribution, and interindividual variability estimates were large but consistent with the heterogeneity of the data. The agreement between the simulations and observations was attested by the VPC presented in Fig. 3.

Prediction of S 55746 concentrations in plasma after single and repeated administrations. Circles represent observations from the data set, the median predicted profile is represented by the black lines, and gray areas represent the 90% prediction intervals.
PK-PD Model for Caspase Activity.
Parameter estimates for the PK-PD model for caspase activity are presented in Table 2. The levels of caspase activity were measured in tumors after a single oral administration of S 55746 in RS4;11 tumor-bearing mice. Effective concentrations (concentration in the effect compartment) were driven by the unbound concentrations in plasma, through an interface model, defining a threshold effective concentration. The kefi was set to 1 to ensure the identifiability of parameters. Hence, the elimination from the receptor compartment was not saturable, and a simple effect compartment with a threshold effective concentration was sufficient to explain the nonlinearity between PK and caspase activity. The estimation of a threshold value for the effect compartment significantly improved the model (P < 0.001). An unbound drug concentration in plasma greater than 40.4 ng ml−1 was necessary to induce a pharmacological response on caspase activity.
Pharmacodynamic parameter estimates of S 55746 for caspase activity in RS4;11 xenograft mouse models after once-daily oral administration
Inhibition of Bcl-2 activity was described by a receptor occupancy model driven by the concentration in the effect compartment. Caspase kinetics were well described by an indirect effect model where production is inhibited by the target. This was expected based on the mechanism of action of S 55746. An inhibition of 53% of Bcl-2 by S 55746 (I50 = 0.53) resulted in 50% reversion of caspase inhibition. At a dose level of 12.5 mg/kg, moderate caspase activity could be detected, whereas at 25- and 50-mg/kg doses, caspase activity seemed to reach a ceiling effect. Higher S 55746 concentrations resulted in sustained inhibition of Bcl-2 and, thus, a lasting effect on caspase activity (Supplemental Fig. 2). All parameters were estimated with acceptable precision (Table 2), and the agreement between the model and observations is presented in Fig. 4.

Caspase activity profile after a single administration of vehicle, 12.5, 25, and 50 mg/kg of S 55746. Circles represent observations from the data set, the median profile is represented by the middle lines, and gray areas represent the 95% prediction intervals.
PK-PD Model for Tumor Growth Inhibition.
Tumor growth in the control group was better described in the two tumor growth studies with a biphasic Koch model (Koch et al., 2009) than with an exponential growth model (P < 0.05). The unperturbed tumor growth parameters from both studies were estimated separately because of the heterogeneity of tumor growth between studies. For study A, the exponential growth rate was estimated at 0.00918 hour−1 and the linear growth rate at 3.43 mm3 h−1, whereas for study B, the exponential growth rate was estimated at 0.00807 hour−1 and the linear growth rate at 5.29 mm3 h−1, reflecting the interexperiment variability. Individual parameters (the so-called empirical Bayesian estimates) of the linear growth rate (λ1 parameter) had a near-symmetric distribution, and their interanimal variability was estimated to be 38.9%.
Parameter estimates for the PK-PD model for tumor growth inhibition are presented in Table 3. The comparison between the observed tumor volumes and model predictions is presented in Fig. 5 for study B (VPC of study A is presented in Supplemental Fig. 3). Good graphical agreement was observed in both studies. Data-driven model development suggested that a step function should link caspase activity to tumor cell toxicity, representing the triggering of apoptosis. The CaspTHRE was estimated as 46.5, whereas the maximum value that Casp could reach was 46.57. This was also related to the bistability property of the caspase-induced apoptosis system (Eissing et al., 2004; Legewie et al., 2006). Below CaspTHRE, caspase is not active and, thus, apoptosis is not triggered, whereas above CaspTHRE, caspase is active and apoptosis occurs at a maximal rate. The corresponding CTHRE was calculated to be 2876 ng/ml (total concentration) or 43.1 ng/ml (free concentration), and the corresponding Bcl-2 relative activity was 0.168. Caspase activity is nearly maximal above CTHRE and CaspTHRE; therefore, the link between exposure to treatment or biomarker level and tumor dynamics can be expressed as a relationship between the time that drug concentration (or Casp) remained above CTHRE (or CaspTHRE) and efficacy, measured as fractional tumor growth inhibition. The percentage of time above CTHRE or CaspTHRE over 5 days had a strong sigmoidal relationship with the fractional tumor growth inhibition at the end of day 5, as shown in Fig. 6. The 5-day period was an interval that was similar in both studies. Tumor growth was inhibited by 50% when CaspTHRE was exceeded 13.8% of the time and CTHRE was exceeded 8.1% of the time.
Summary of pharmacodynamic parameter estimates for tumor growth inhibition by S 55746
Other parameters are defined in the text.

VPC of the validation exercise for study B. Circles represent observations from the data set, the median predicted profile is represented by the middle lines, and gray areas represent the 95% prediction intervals.

Relationship between the percentage tumor growth inhibition and percentage of time above CaspTHRE (A) and percentage of time above CTHRE (B). Circles represent observations from the data set, and the median predicted profile is represented by the middle lines.
Discussion
A novel semimechanistic PK-PD model was built to describe the effects of an anticancer proapoptotic agent, linking the dose-to-plasma concentration, biomarker activity, and tumor size in mice. The agent, S 55746, increases caspase activity by removing the initial inhibition by Bcl-2. Hence, apoptosis is reactivated and tumor cells are killed. In empirical models, the kinetics of the drug effect on xenograft tumors were described by incorporating a transit compartment between the PK and tumor cells to mimic signal transduction and model the time delay (Rocchetti et al., 2005; Bueno et al., 2008). In this work, the transit compartments were replaced by a semimechanistic model accounting for drug penetration into the biophase, receptor occupancy, and biomarker kinetics. This model revealed several interesting biologic and pharmacological features.
S 55746 Pharmacokinetic Model.
The S 55746 kinetics were described by a two-compartment disposition model with both saturable absorption and elimination processes. The saturable rate of absorption results in an increased Tmax as the dose increases. By contrast, the fraction of dose reaching the central compartment is independent of the dose. In the Biopharmaceutics Classification System, S 55746 is characterized as a class 2 compound (Amidon et al., 1995; Broccatelli et al., 2012; Benet, 2013), meaning the compound has a low solubility, potentially leading to a nonlinear absorption process. Additional PK studies with more time points in the absorption phase would help to better characterize the absorption process even though the current model did not show misspecification.
The PK analysis also revealed that S 55746 undergoes an increase in its clearance over time, which may be explained by autoinduction. Drug concentrations in plasma drive the pool of a hypothetical enzyme, which then affects the metabolic clearance. Autoinduction resulted in a marked rise (more than 4-fold) of S 55746 clearance after multiple administrations. The half-life of enzyme activation was 88 hours. These characteristics are species dependent and will have to be specifically studied in humans.
Caspase Activity Model.
Guided by the S 55746 mechanism of action, the delay between the time-to-maximal drug concentration in plasma and time-to-maximal caspase activity was modeled using an effect compartment which represents the transfer to site of action, a receptor occupancy model for binding to Bcl-2, and an indirect model for the caspase turnover. Simpler structural models, such as an effect compartment or an indirect model, resulted in worsened description of caspase activity observations. The rate constant characterizing the distribution from the plasma to the effect site (kefo = 0.2 hour−1) corresponds to a 3.5-hour half-life of the concentration in the effect compartment. Hence, under continuous infusion, equilibrium would be reached in the effect compartment in about 17.5 hours, partly due to penetration into tumor cells. The δ parameter represents the free drug concentration in plasma above which S 55746 is active. This threshold can be explained by an all-or-nothing signal in the transduction cascade or saturable binding of S 55746 to a macromolecule with a high affinity but low capacity, or by the saturation of an efflux transporter at the effect site. Since the total number of receptors (RT) was fixed to 1 for identifiability purposes, the receptor occupancy was interpreted as a relative activity of the pharmacological target. A kon/koff dynamic binding model (Ariens, 1954) was tested, but the association and dissociation rates were very high, suggesting that the binding of S 55746 with the pharmacological target was quasi-instantaneous. Subsequently, an indirect effect model described the effector caspase turnover, whose production is inhibited by the target activity. This part of the model reveals three properties. First, the rate constant governing the kinetics of the caspase amount (kout) corresponds to a half-life of 0.56 hours. This rate constant is higher than the other rate constants (kefo, clearance parameters) in the system. Hence, the rate-limiting step in the action of S 55746 would not be due to the rate of variation of effector caspase activity, but to its distribution from plasma to the effect site. Second, the sigmoidicity coefficient is estimated to be large (γ = 5.88), resulting in an all-or-none variation of caspase activity with respect to Bcl-2 relative activity, around the threshold I50 value of 0.53. Third, beyond this threshold, caspase activity reaches a ceiling effect, which is equal to kin/kout, i.e., 46.5. Hence, higher doses do not result in higher activity but rather in a more sustained effect (Supplemental Fig. 2). Hence, both the dose and the interval between administrations are important for optimizing S 55746 activity.
Tumor Growth Inhibition Model.
Tumor growth was well described by the biphasic growth model proposed by Koch et al. (2009) since our data followed two phases: an initial exponential growth phase followed by linear growth. Exponential and Gompertz models (Norton, 1988) were also tested but were not appropriate because the exponential model was unable to capture the two growth phases, whereas the Gompertz model did not improve the fit since tumor growth did not reach a plateau. Other mathematical models describing biphasic tumor growth were proposed (Simeoni et al., 2004), but in our case, the Koch model was more appropriate and avoided numerical difficulties (Koch et al., 2009).
The model assumes that tumor growth inhibition is mediated solely by the increase in the caspase level. The caspase effect on tumor growth was described as “all or none,” meaning that, depending on caspase activity, apoptosis is initiated or not. Other types of models were tested but could not capture the observed PD nonlinearity for the link between caspase activity and tumor cell death. Although unperturbed tumor growth parameters were study-dependent, the caspase activity threshold that triggers apoptosis was considered the same in both studies, i.e., it was assumed to be a characteristic of the tumor strain, independent of its growth rate. The correlation between the growth rate and caspase-induced death rate was taken into account by letting the parameter k2 (assimilated to an index of caspase efficacy) differ between studies A and B.
A major question in drug development is how to extrapolate preclinical findings to humans. In the context of our model, this question can be rephrased as how the CTHRE triggering apoptosis could be translated to humans. First, the magnitude of tumor growth inhibition was evaluated by comparison with tumor size in the control group at the same time, not to the tumor size at time zero. In this way, it could be shown that tumor growth inhibition is independent of the growth function (Appendix 2). Hence, putative differences in tumor growth dynamics between species would not have an impact on the estimation of the drug effect. Second, as shown by the formula, CTHRE depends on 1) unitless tumor-specific parameters (I50, γ, CaspTHRE), 2) species-specific parameters (Kd, fu), 3) mixed parameters (δ), and 4) ratios of rate constants that are species-independent because each constant is expected to increase by the same factor according to allometric rules (Boxenbaum, 1982; West et al., 1997). The species-specific parameters, such as Kd and fu, may be measured in vitro. The value of δ in humans cannot be forecasted but may be fixed to its mouse value because it is not expected to vary widely across species. Hence, the human value of CTHRE may be calculated. The effective dose in humans would be CTHRE⋅CL/F, where the human values of CL and F could be estimated by, e.g., a physiologically based pharmacokinetic approach (Espié et al., 2009; Peters et al., 2009; Jones and Rowland-Yeo, 2013).
Furthermore, we showed that the times above CTHRE and CaspTHRE correlated with efficacy. To achieve 50% tumor growth inhibition, CaspTHRE had to be exceeded 13.8% of the time and CTHRE had to be exceeded 8.1% of the time per dosing interval. Such a relationship is similar to that observed with some antimicrobial agents, such as β-lactams, where the time the antimicrobial concentration remains above the minimum inhibitory concentration correlates with the therapeutic efficacy, and the target percentage of time above the minimum inhibitory concentration per dosing interval remains constant across species (Craig, 1998; Andes et al., 2003). Hence, in addition to estimating the effective dose, the dosing schedule to be evaluated in humans could be refined by simulating different schedules with a physiologically based pharmacokinetic model and calculating the percentage of time above CTHRE per dosing interval.
In conclusion, a semimechanistic approach based on experimental mice data and in vitro parameters provided an interesting tool to quantify the expected antitumor effects. The model identified the following sources of nonlinearity in the relationship between the S 55746 dosing rate and tumor shrinkage: the dose-dependent rate of absorption and elimination, time-dependent clearance, threshold for the effective drug concentration, receptor occupancy, and threshold for the relative caspase activity inducing apoptosis. In addition, this model could be applied to other drugs with similar mechanisms of action and facilitate their development by helping to detect and evaluate their efficacy during preclinical studies and, therefore, contribute to “go/no go” decisions.
APPENDIX
Appendix 1: CTHRE Calculation
In this section, we derive the calculation of the CTHRE value (eq. 14).
At steady state, or under continuous infusion to reach CaspTHRE, eq. 8 gives:
 (8a)
(8a)As a result:
 (8b)
(8b)In parallel, from eq. 7, we can write:
 (7a)
(7a)From the interface compartment equation (eq. 5), we obtain at steady state:
 (5a)
(5a)This leads to (since CTHRE ⋅ fu > δ and thus H = 1):
 (5b)
(5b)Inserting the relations from eq. 7a to eq. 8b into eq. 5b, we finally obtain:
 (14)
(14)Appendix 2: Independence of Tumor Growth Inhibition from Tumor Growth Function
For a general tumor growth model, we have:

with

then

which leads to

After integration, we obtain:

with

Finally

Thus

Authorship Contributions
Participated in research design: Pierrillas, Henin, Kraus-Berthier, Tod.
Conducted experiments: Kraus-Berthier.
Performed data analysis: Pierrillas, Henin, Tod.
Wrote or contributed to the writing of the manuscript: Pierrillas, Henin, Ogier, Chenel, Bouzom, Tod.
Footnotes
- Received June 30, 2018.
- Accepted September 10, 2018.
↵1 Current affiliation: Calvagone, Liergues, France.
↵2 Current affiliation: Translational DMPK & Safety, IPSEN Innovation, ZI Courtaboeuf, Les Ulis, France.
↵3 Current affiliation: UCB Biopharma, Development Sciences, Braine l’Alleud, Belgium.
E.H. was funded by Fondation Synergie Lyon Cancer and La Ligue Nationale contre le Cancer. This work is part of a Ph.D. project (P.P.) granted by Servier Laboratories.
↵
 This article has supplemental material available at jpet.aspetjournals.org.

Abbreviations
- PD
- pharmacodynamic
- PK
- pharmacokinetic
- PK-PD
- pharmacokinetic-pharmacodynamic
- S 55746
- (S)-N-(4-hydroxyphenyl)-3-(6-(3-(morpholinomethyl)-1,2,3,4-tetrahydroisoquinoline-2-carbonyl)benzo[d][1,3]dioxol-5-yl)-N-phenyl-5,6,7,8-tetrahydroindolizine-1-carboxamide
- VPC
- visual predictive check
- Copyright © 2018 by The American Society for Pharmacology and Experimental Therapeutics


