


Abstract
Sulfation and glucuronidation, the major routes of metabolism of troglitazone, an antidiabetic agent, were examined in vitro using hepatic cytosol and microsomes prepared from KK mice, an animal model of non-insulin-dependent diabetes mellitus. Stereoselectivity was observed for both conjugation reactions, and the metabolic intrinsic clearance of glucuronidation was about 3- to 100-fold higher than that of sulfation for each stereoisomer. In addition, the metabolic intrinsic clearance of glucuronidation exhibited an 8-fold difference among stereoisomers. The predicted metabolic clearance for each stereoisomer, calculated from thein vitro data based on a dispersion model, was comparable to the measured metabolic clearance in vivo, ranging from 27 to 93%. We also attempted to predict the in vivo metabolic clearance from in vitrometabolism data, to investigate species differences in the stereoselectivity of the conjugation reactions in normal animals,i.e., ddY mice and rats. For ddY mice the in vivo hepatic glucuronidation clearance was 170-fold higher than the corresponding sulfation clearance, whereas for rats the sulfation clearance was 6-fold higher than the glucuronidation clearance. The hepatic sulfation clearance in mice and rats predicted from in vitro metabolism data was 5.3- and 1.1-fold higher, respectively, than that in vivo, calculated from the plasma disposition of parent drug and biliary excretion of metabolites. For glucuronidation, the predicted values in mice and rats were 1.0- and 0.33-fold higher, respectively. These results suggest that semiquantitative extrapolation of in vitrostereoselective metabolism of troglitazone, by conjugation, to thein vivo situation is possible.
To extrapolate in vitro metabolism data to the in vivo situation, the following approach is increasingly used: estimation of enzyme kinetic parameters per unit liver weight from in vitro metabolism data, extrapolation of these data to the metabolizing organ and whole body using an appropriate mathematical model based on clearance concepts and physiological pharmacokinetics and comparison of the prediction with the drug’s pharmacokinetics observed in vivo. This approach has been successfully used for many drugs (Rane et al., 1977; Roberts and Rowland, 1986a; Wilkinson, 1987; Sugiyama et al., 1989; Houston, 1994; Iwatsuboet al., 1996).
Troglitazone (CS-045) is a novel oral antidiabetic agent with hypoglycemic activity in non-insulin-dependent diabetes mellitus in animals and humans (Fujiwara et al., 1988; Suter et al., 1992). Troglitazone is an equal mixture of four stereoisomers, arising from two asymmetric carbons at the 2-position of the chroman ring and the 5-position of the thiazolidine ring (fig.1). Little unchanged drug is excreted in the urine or bile (Kawai et al., in press) and, therefore, theCL tot of the drug is determined by its metabolic clearance (Izumi et al., 1996). Furthermore, because troglitazone is mainly metabolized in liver,CL tot essentially reflects hepatic metabolism (Izumi et al., 1996). Glucuronidation and sulfation are the major pathways of metabolism, along with a minor degree of oxidation to the quinone form (Kawai et al., in press).
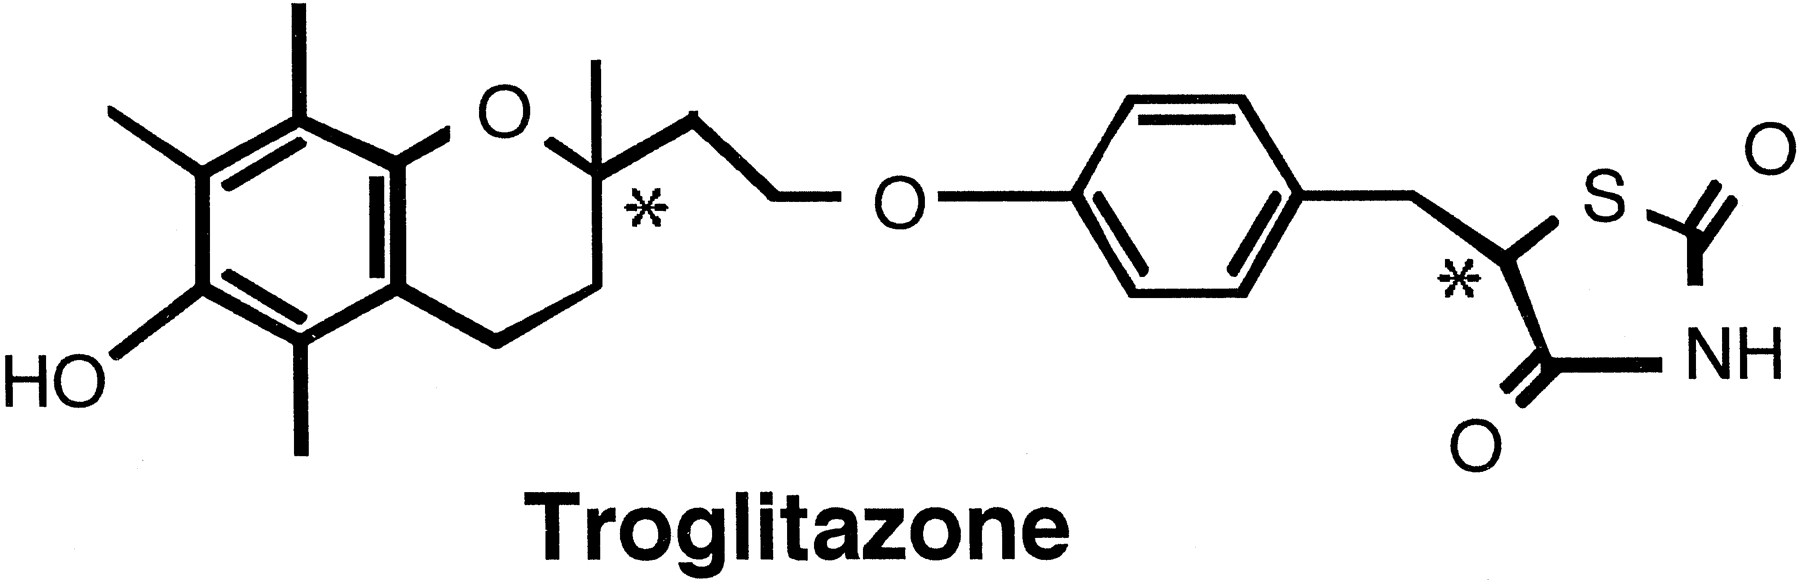
Chemical structures of troglitazone. *, chiral centers.
We previously demonstrated stereoselective troglitazone pharmacokinetics in KK mice, an animal model of non-insulin-dependent diabetes mellitus, that involved epimerization at the 5-position of the thiazolidine ring and metabolic clearance (Izumi et al., in press). In the present study, the stereoselectivity in metabolic clearance involving the sulfate and glucuronide conjugation of troglitazone stereoisomers was investigated using hepatic cytosol and microsomal fractions, respectively. Subsequently, the in vitro kinetic parameters were used to predict the in vivo clearance of the drug, which was then compared with that determined experimentally in vivo. The same approach was also used to examine species differences in both conjugation reactions in normal ddY mice and rats.
Methods
Chemicals
Troglitazone and its four stereoisomers (SS,SR, RS and RR) were synthesized by Sankyo Co. (Tokyo, Japan) (Yoshioka et al., 1989). The sulfate (Yoshioka et al., 1987) and glucuronide conjugates (Yoshioka et al., 1991) were also synthesized by Sankyo Co. PAPS and UDPGA were purchased from Sigma Chemical Co. (St. Louis, MO) and Seikagaku Kogyo (Tokyo, Japan), respectively. The other reagents and solvents used were of analytical and HPLC grade, respectively.
Animals
Adult male KK mice (25–35 g) and ddY mice (25–35 g) were purchased from Tokyo Experimental Animals (Tokyo, Japan) and Japan SLC (Shizuoka, Japan), respectively. Adult male Wistar-Imamichi rats (300–350 g) were purchased from the Imamichi Institute for Animal Reproduction (Saitama, Japan). The animals were allowed free access to food and drink for more than 1 week; immediately before the experiments, each animal was fasted overnight.
Preparation of Hepatic Cytosol and Microsomes
Cytosolic (Sekura and Jakoby, 1979) and microsomal (Kutt and Fouts, 1971) fractions were prepared according to standard procedures and stored at −80°C until used. Protein concentration was determined by the bicinchoninic acid method (Pierce Chemical Co., Rockford, IL), using human serum albumin (standard solution; Sigma) as a standard.
Measurement of Conjugating Activities In Vitro
Cytosolic sulfation.
After 100 μl of mouse liver cytosol (final concentration, 2 mg/ml) and 375 μl of Tris-HCl buffer (pH 7.2, 0.1 M) containing 5 mM 2-mercaptoethanol were kept at 37°C for 10 min, 25 μl of PAPS solution (final concentration, 200 μM) (Pacificiet al., 1988) and 5 μl of troglitazone stereoisomer inN,N′-dimethylformamide solution (final concentration, 0.25–50 μM) were added to start the sulfation reaction. The reaction was stopped after 10 min by mixing with an ethanolic solution of 9-acetylanthracene (used as an analytical internal standard). Preliminary studies showed that sulfation was linear with respect to both time and protein concentration over this incubation period. In the studies with rat hepatic cytosol, the protein concentration was 0.5 mg/ml and the reaction time was 3 min; other incubation conditions were the same as in the mouse studies.
Microsomal glucuronidation.
A suspension of mouse or rat liver microsomes (10 mg/ml) was mixed with 50 mM Tris-HCl (pH 7.4) buffer containing 10 mM MgCl2 and Brij 58 (0.2 mg/mg microsomal protein) and was incubated for 30 min under ice-cooled conditions to activate the microsomes (Lett et al., 1992). The activated 100-μl microsomal sample (final concentration, 2 mg/ml) was mixed with 375 μl of 0.1 M Tris-HCl buffer (pH 7.4) containing 5 mM MgCl2 and 2 mM d-saccharic acid 1,4-lactone (El-Mouelhi and Bock, 1991) and was preincubated at 37°C for 10 min; then 25 μl of UDPGA solution (final concentration, 5 mM) and 5 μl of troglitazone solution inN,N′-dimethylformamide (final concentration, 0.25–50 μM) were added to initiate glucuronidation. Preliminary experiments indicated that the formation of glucuronide was linear up to 10 min; therefore, the reaction was terminated at 5 min by addition of ethanol.
Determination of sulfate and glucuronide.
An LC-10A HPLC system (Shimadzu, Kyoto, Japan) was used. The column for the analysis of sulfate conjugates was a YMC-Pack, ODS-A, A-314G column (YMC, Kyoto, Japan), and the mobile phase was acetonitrile/water/phosphoric acid (62:38:0.05, v/v); the detection wavelength was 230 nm, the flow rate was 1.2 ml/min and the column temperature was 35°C. The column for the analysis of glucuronides was a YMC-Pack, ODS-A, A-312 column (YMC). The mobile phase, detection wavelength, flow rate and column temperature were acetonitrile/water/phosphoric acid (45:55:0.05, v/v), 230 nm, 1.2 ml/min and 35°C, respectively. The limit of detection for sulfate and glucuronide conjugates was 60 nM.
Determination of fu in cytosolic and microsomal samples.
The f u of troglitazone stereoisomers in cytosolic and microsomal incubations at 37°C was determined using a HPFA method (Shibukawa et al., 1995). Preliminary experiments indicated that the measurement of thef u of stereoisomers in the cytosol required a large volume to be injected onto the HPFA column and the plateau phase was short because of the high C u. Under linear binding conditions, the reciprocal of f u should be proportional to the protein concentration. Therefore, for cytosolic binding, the 1/f u value at 2 mg/ml cytosol (0.5 mg/ml for rat cytosol) after addition of 2S-isomers (equal mixture of SS and SR) and 2R-isomers (equal mixture of RS and RR) at 2 and 50 μM was extrapolated by linear regression from those at 10, 20 and 40 mg/ml cytosol, without the addition of PAPS. For microsomes, 2 or 50 μM troglitazone 2S- or 2R-isomers was added to 2 mg/ml microsomal suspension; the other incubation conditions were the same except for the absence of UDPGA. The total concentration in the microsomal mixture was measured by HPLC as described above. After centrifugation at 105,000 × g for 30 min at 4°C, the supernatant concentration was measured by HPLC (Izumi et al., 1996). For measurement of C u, 3 ml of cytosolic or microsomal supernatant was injected onto the HPFA column (Develosil 100Diol5; Nomura Chemical Co., Aichi, Japan), which was equilibrated with phosphate buffer (pH 7.4, ionic strength of 0.17) at a flow rate of 1 ml/min at 37°C. The plateau region of the troglitazone peak (i.e., troglitazonef u) was delivered to the preconcentration column (Develosil ODS10; Nomura Chemical Co.) for 5 min on each occasion, using a column-switching apparatus (FCV-12AH; Shimadzu). The unbound drug eluted with the mobile phase (acetonitorile/water/phosphoric acid, 55:45:0.1, v/v) was analyzed on an analytical column (Cosmosil 5C18-AR; Nacalai Tesque, Kyoto, Japan).
Recovery from cytosol and microsomes.
The conversion values to calculate the kinetic parameters per unit liver weight were evaluated from the total cytosolic protein per unit liver weight, calculated from the total volume and protein concentration in cytosol, assuming 100% recovery. The cytosolic protein recoveries for KK mice, ddY mice and rats were 65.8, 52.3 and 50.7 mg/g liver, respectively. The microsomal protein recovery (Lin et al., 1980) was determined from the total content of cytochrome P450, a marker enzyme for microsomes, in the homogenate (Matsubara et al., 1976) and microsomes (Omura and Sato, 1964). The values for KK mice, ddY mice and rats were 53.2, 40.8 and 45.4 mg/g liver, respectively.
Calculation of Enzyme Kinetic Parameters andCLuint
The enzyme kinetic parameters for the sulfation and glucuronidation of the troglitazone stereoisomers were estimated using the C
u value, measured by the HPFA method. Depending on whether Eadie-Hofstee plots show curvature or not, the data were analyzed by equation 1 (linear plot) or equation 2(curvature).
Biliary and Urinary Excretion of Troglitazone in ddY Mice and Rats
Under urethane anesthesia, ddY mouse gallbladder was ligated, and the bile duct was cannulated using PE-10 tubing. After the bile flow rate was confirmed to be constant, troglitazone (5 mg/kg) was administered via the jugular vein, and bile was collected for 6 hr after administration. Excreted urine was collected, as well as urine that remained in the bladder, for 6 hr after administration. Blood was collected from the carotid artery of separate uncannulated mice at the times stated.
In rats, the bile duct was cannulated, under urethane anesthesia, using PE-50 tubing. Blood was collected from a similar cannula placed in the femoral artery. Under urethane anesthesia, the blood and bile were collected at the times stated for 6 hr after administration of troglitazone (5 mg/kg) via the jugular vein. Excreted urine and that remaining in the urinary bladder were collected.
Determination of Troglitazone and Its Sulfate and Glucuronide Concentrations
Troglitazone and the sulfate conjugate in plasma were extracted with ethyl acetate/n-hexane (90:10, v/v) after addition of tetrabutylammonium phosphate (Waters, Milford, MA) and internal standard solution (9-acetylanthracene) and were analyzed by HPLC. Troglitazone glucuronide in plasma was extracted with a Bond Elut cartridge (CBA; Analytichem International, Harbor City, CA); after washing with acetate buffer (pH 6.0, 0.1 M) and chloroform, and adding internal standard (9-anthracene carboxylic acid), and the glucuronide was eluted with ethanol. Troglitazone and sulfate conjugate in bile and urine were extracted with ethanol containing internal standard (9-acetylanthracene) and were analyzed by HPLC. Glucuronide conjugate in bile or urine was extracted using a Bond Elut cartridge (CBA; Analytichem International); after washing with acetate buffer containing 0.1% Triton X-100, acetate buffer and chloroform and adding internal standard (9-anthracene carboxylic acid), and the glucuronide was eluted with ethanol and analyzed by HPLC. The HPLC conditions were the same as described above.
Estimation of the Pharmacokinetic Parameters of Troglitazone in ddY Mice and Rats
The plasma profiles of troglitazone after i.v. administration to ddY mice and rats were fitted to a biexponential equation (eq. 9), using a nonlinear least-squares method (MULTI), to obtain A,B, α and β with a weighting of 1/(concentration)2. The CL
tot was calculated from equation 10. Because the CL
totof troglitazone is assumed to primarily reflect hepatic metabolic clearance, the CL
H for each conjugate was calculated from the product of CL
tot and the fraction of each metabolite excreted in the urine and bile.
Results
Sulfation and glucuronidation in KK mouse liver cytosol and microsomes.
The cytosolic binding, the 1/f uvalues, at each protein concentration in the cytosol showed good linearity (r > 0.92), and the extrapolatedf u value at 2 mg protein/ml cytosol was 0.03 with 2 and 50 μM added 2S- and 2R-isomer concentrations (table 1). In microsomes, >70% of the stereoisomers was found to be adsorbed to the microsomes (2 mg protein/ml). The f u value in the 105,000 ×g supernatant was 0.03. This binding in the supernatant was considered to mainly reflect that to Brij 58, which was used for activation of UDP-glucuronosyltransferase, because thef u value was similar to that at the same concentration of Brij 58 solution alone. In contrast, the cytosolic binding appeared to be due to binding to the cytosolic protein. From these results, the f u value for the stereoisomers in the reaction mixtures was estimated to be 0.01 at 2 and 50 μM added drug concentration (table 1).
Enzyme kinetic parameters of sulfation and glucuronidation for four stereoisomers of troglitazone with KK mouse liver
The Eadie-Hofstee plots of sulfation forSS-troglitazone were biphasic, indicating that two enzyme systems were involved, and the C u-vrelationship also showed a good fit to equation 2, as judged by the Akaike information criterion (Yamaoka et al., 1978) (fig.2). For glucuronidation, the Eadie-Hofstee plots for the four stereoisomers were monophasic and the enzyme kinetic parameters were analyzed by equation 1 (fig. 2). The unbound plasma concentrations of troglitazone stereoisomers in KK mice after i.v. administration of 5 mg/kg 2S- or 2R-isomers were estimated to be <0.06 μM and were obtained by multiplying the total concentration by a plasma f u value of 0.003 in KK mouse plasma (Izumi et al., in press). Therefore, both conjugating reactions would be expected to occur in a linear fashion over the range of C u studied. TheCLu int,Sulf. for the S-configuration at the 2-position in the chroman ring was about 4-fold greater than that for the R-configuration (table 1). On the other hand, the CLu int,Glu. for theR-configuration at the 2-position of the chroman ring was about 8-fold greater than that for the S-configuration (table 1). The CLu int,Glu. per unit liver weight (milliliters per minute per gram of liver) for each stereoisomer was also higher than the CLu int,Sulf.,i.e., 6-fold for SS, 3-fold for SR, 50-fold for RS and 100-fold for RR (table 1). These results suggest that glucuronide conjugation is the major metabolic pathway in KK mice.
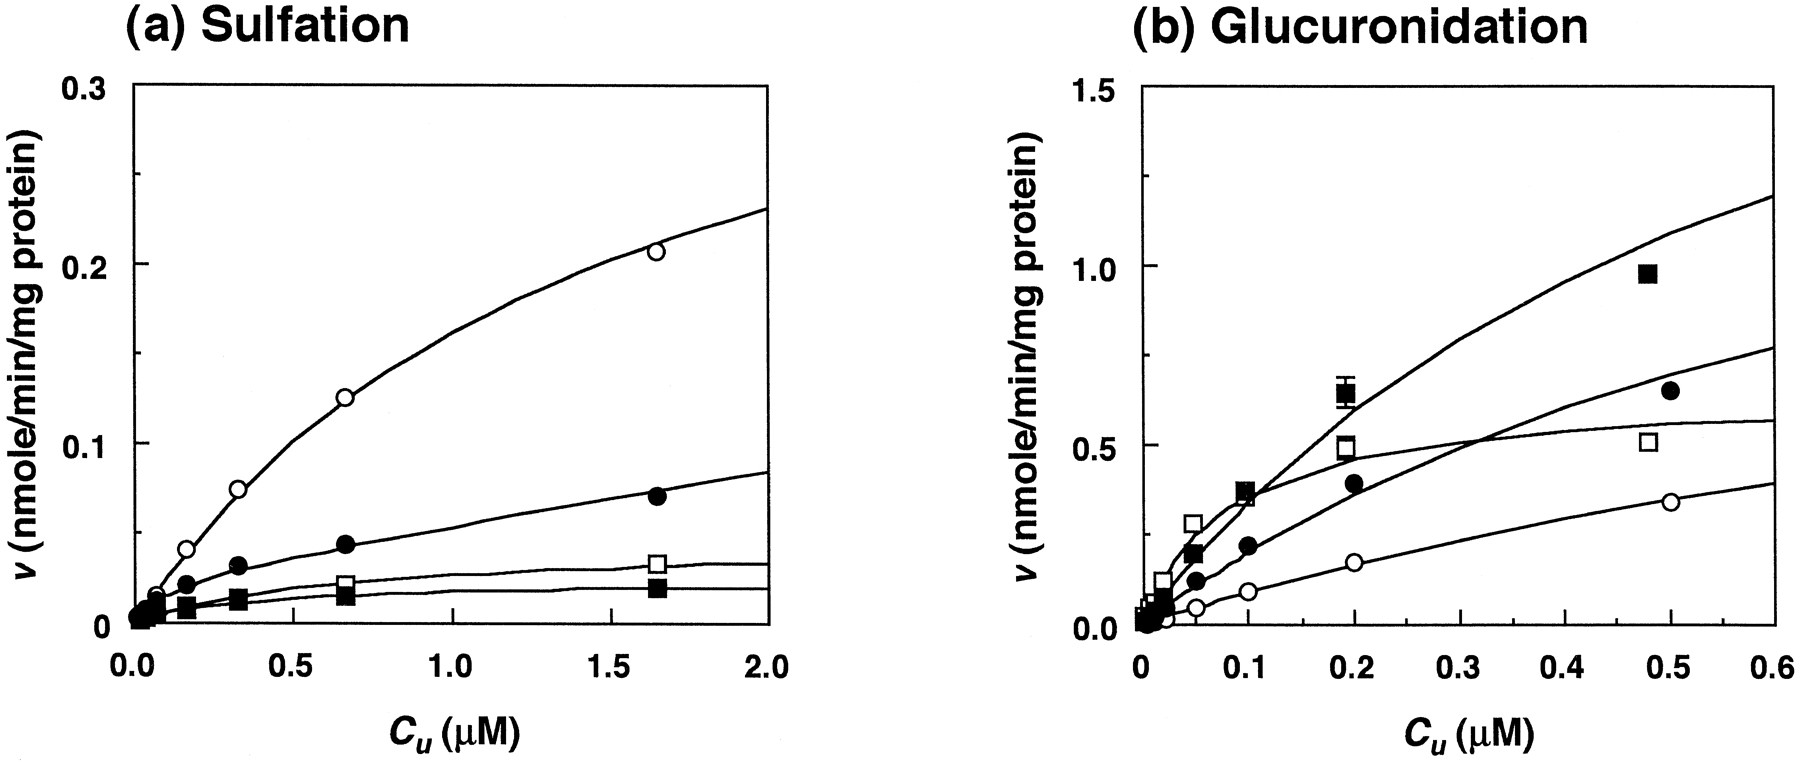
Relationship between the initial velocities (v) and C u for troglitazone stereoisomers in KK mice. a, sulfation by liver cytosol; b, glucuronidation by microsomes. Each point and bar represent the mean ± S.D. of three experiments. •, SS; ○,SR; ▪, RS; □, RR. Fitted curves were calculated from equation 1, except forSS, for which equation 2 was used.
Furthermore, the CL H for each stereoisomer was calculated based on a dispersion model from these in vitro CLu int values. The sum of theCL H for both conjugations for RR was about 4-fold higher than that for SR (table2). The in vivo CL H was evaluated by model analysis that assumed that 1) epimerization at the 5-position of the thiazolidine ring, which was measured in an in vitroincubation experiment in plasma, occurs in the central compartment and is a first-order process; 2) elimination (hepatic metabolism) occurs from the central compartment; and 3) there is no interaction between stereoisomers (Izumi et al., in press). In the comparison between CL H in vivo and the sum ofCL H for both conjugations calculated fromin vitro metabolic data, the CL Hvalue for SR predicted from in vitro data was about one-third that from in vivo data, and those forSS, RS and RR were 86, 93 and 82%, respectively (table 2).
Comparison of CL H in vitro and in vivo
In vivo conjugative metabolic clearance in ddY mice and rats.
The ratio of total-body blood clearance, i.e., CL tot divided by R B, to hepatic blood flow (90 ml/min/kg for mice and 55 ml/min/kg for rats) (Davies and Morris, 1993), reflecting the hepatic extraction ratio, was 0.36 for mice and 0.95 for rats, respectively (table 2). There was also a species difference with respect to the metabolites present in plasma (fig. 3). The plasma glucuronide levels were higher than those of the sulfate in ddY mice; in contrast, for rats, the sulfate was a major metabolite (fig. 3). No troglitazone or either conjugate was detected in the urine of both species. Troglitazone was not found in bile, and the amount of glucuronide conjugate excreted into bile was 63.5 ± 3.7% (mean ± S.D. of four experiments) of the administered dose for ddY mice and 11.6 ± 0.6% for rats. The corresponding figure for the sulfate conjugate excreted in bile was 0.373 ± 0.128% for ddY mice and 68.0 ± 0.8% for rats. Therefore, for rats the amount of glucuronide excreted into bile was 170-fold greater than that of the sulfate, whereas for rats sulfate excretion was about 6-fold higher than glucuronide excretion.

Plasma concentration-time profiles of troglitazone and its metabolites after i.v. administration of a 5-mg/kg dose of troglitazone to ddY mice or rats with bile duct cannulation. Each point and bar represent the mean ± S.D. of three experiments. •, troglitazone; ○, sulfate conjugate; □, glucuronide conjugate. Solid lines, curves fitted to equation 9.
In vitro stereoselective sulfation and glucuronidation in ddY mice and rats.
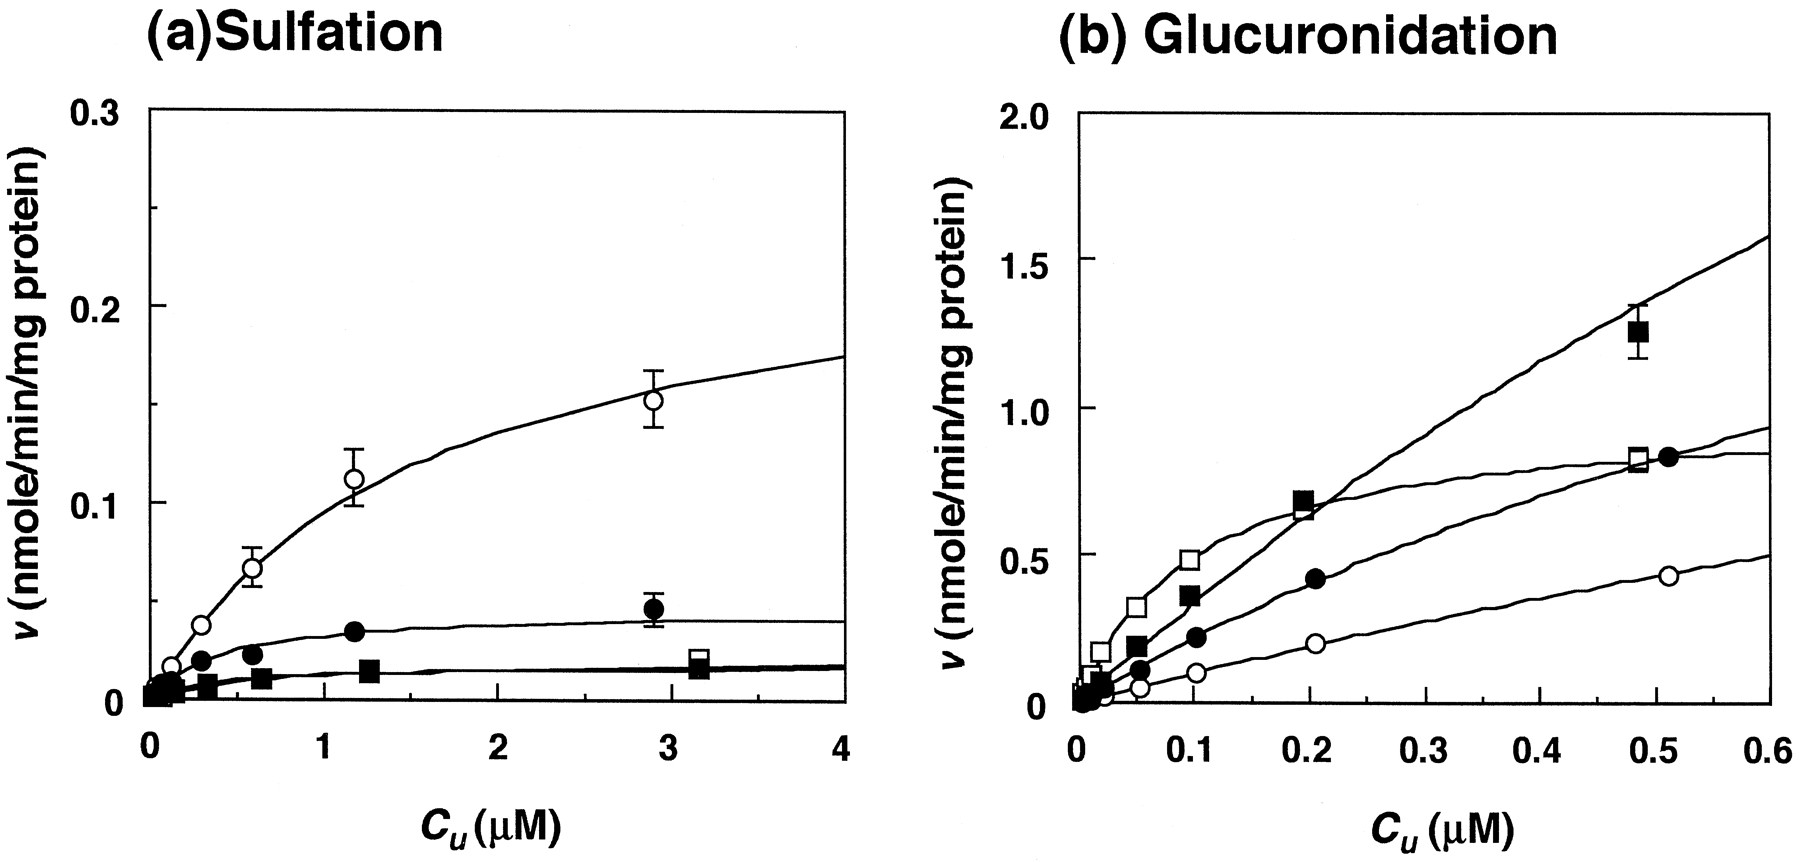
For both species thef u value in the cytosol and microsomes was small and there were no large differences between the 2S- and 2R-isomers over the range of concentrations used (tables3 and 4). The relationship betweenv and C u in ddY mice was very similar to that for KK mice (fig. 4). For rats, substrate inhibition of the formation of the sulfate conjugate was observed (fig.5) and the Ki values for 2S-isomers (0.054 and 0.070 μM) were lower than those for the 2R-isomers (1.1 and 3.9 μM) (table 4). However, substrate inhibition was considered not to occur in vivo, because the estimated maximum plasma C u (0.02 μM) was less than the Ki values. The maximum plasma C u was estimated by multiplying the total plasma concentration (fig. 3) by the plasmaf u value of 0.00092 in rat plasma (Izumiet al., 1996).
Enzyme kinetic parameters of sulfation and glucuronidation for four stereoisomers of troglitazone with ddY mouse liver
Enzyme kinetic parameters of sulfation and glucuronidation for the four stereoisomers of troglitazone with rat liver
Relationship between the initial velocities (v) and C u for troglitazone stereoisomers in ddY mice. a, sulfation in liver cytosol; b, glucuronidation in microsomes. Each point and bar represent the mean ± S.D. of three experiments. •, SS; ○,SR; ▪, RS; □, RR. Fitted curves were calculated from equation 1.

Relationship between initial velocities (v) and C u for troglitazone stereoisomers in rats. a, sulfation in liver cytosol; b, glucuronidation in liver microsomes. Each point and bar represent the mean ± S.D. of three experiments. •, SS; ○,SR; ▪, RS; □, RR. Fitted curves for sulfation were calculated from equation 3 and those for glucuronidation from equation 1.
For ddY mice, the CLu int (milliliters per minute per gram of liver) for glucuronidation was higher than that for sulfation for each stereoisomer, and the difference between the two conjugations for SS, SR, RS andRR was 16-, 5-, 54- and 240-fold, respectively (table 3). The sum of CLu int,Sulf. plusCLu int,Glu. for each stereoisomer was highest for RR and lowest for SR, the difference being 8-fold (table 3). For rats, the CLu int,Sulf. was higher than the CLu int,Glu., which was in contrast to that seen in KK and ddY mice; the difference between the two conjugation reactions for the stereoisomers was 13- to 30-fold (table 4). The sum of CLu int,Sulf. plusCLu int,Glu. for each stereoisomer was largest for SS and smallest for RS in rats (table 4). In addition, for ddY mice, the CL H,Sulf. andCL H,Glu. estimated from in vitro data were 5.3- and 1.1-fold higher, respectively, than the correspondingin vivo values (table 2). For rats,CL H,Sulf. and CL H,Glu.were 1.0- and 0.33-fold higher than the corresponding in vivo clearances (table 2).
Discussion
Stereoselectivity in the in vitro metabolism experiments (KK mice).
The stereoselectivity in the sulfation and glucuronidation of troglitazone were investigated using KK mouse liver cytosol and microsomes. For in vitro-in vivoscaling, the correction for the f u in the reaction mixture has been reported to be important (Lin et al., 1980; Houston, 1994; Obach, 1996). For troglitazone, high protein binding in the reaction mixture was anticipated because of the highly lipophilic nature of the drug. Therefore, thef u in the reaction mixture of cytosol and microsomes was measured by the HPFA method. Thef u of troglitazone stereoisomers in cytosol was 0.03 and that in the microsomal suspension was about 0.01, and these values seemed to be constant over the range of concentrations studied (table 1).
The CLu int (per unit liver weight) of sulfation and glucuronidation in KK mouse liver cytosol and microsomes, estimated after correction for the aforementioned protein binding, demonstrated contrasting stereoselectivity. Namely, the stereoisomers of theS-configuration at the 2-position in the chroman ring exhibited 4-fold greater sulfate conjugation than did those of theR-form, whereas those of the R-form showed 4- to 8-fold greater glucuronidation than did those of the S-form (table 1). For each stereoisomer, CLu int,Glu.was 3 to 100 times greater than CLu int,Sulf.(table 1). Stereoselective sulfation and glucuronidation of drugs with a phenolic hydroxyl group have been reported (Coughtrie et al., 1989; Hansen et al., 1992; Pesola and Walle, 1993;Walle et al., 1993). However, there have been no reports for drugs, such as troglitazone, where stereoselective sulfation and glucuronidation occur at the same phenolic hydroxyl group.
The sum of CL H calculated based on a dispersion model using CLu int,Sulf. andCLu int,Glu. for each stereoisomer, as obtained from in vitro metabolism experiments, was found to be comparable to the CL H in vivo for each stereoisomer (Izumi et al., in press), except forSR (table 2). These results indicate that the in vitro metabolism experiments reflect the in vivometabolism and that stereoselectivity in vivo is mainly due to glucuronide conjugation. There have been a few reports of extrapolation from in vitro experiments to the in vivo situation for glucuronidated drugs; moreover, this situation may be difficult because of the uncertain nature of the rate-controlling factors, such as the concentration of co-substrate and the condition of the enzymes (Rane et al., 1984; Mistry and Houston, 1987). In this study, the reaction conditions were set to obtain maximum glucuronidation activity by the addition of co-substrate (UDPGA), activation by detergent (Brij 58) and Mg++ and inhibition of β-glucuronidase by the addition of a saccharic acid 1,4-lactone. In particular, the UDP-glucuronosyltransferase in prepared microsomes is known to be in a “latent” state (Burchell and Coughtrie, 1989). The concentration of Brij 58 for activation of UDP-glucuronosyltransferase was that reported for the glucuronidation of 1-naphthol and morphine (Lett et al., 1992).
Species differences in conjugative metabolism between normal mice and rats.
We also examined the in vitro-in vivo extrapolation using normal mice, where glucuronidation is the major metabolic pathway, and rats, where sulfation is the major pathway. Substrate inhibition of sulfation was observed in rat liver cytosol. Such inhibition was not observed in sulfation by KK and ddY mouse liver cytosol, and the Km values in rats were very low, i.e., 1/10 to 1/130 of that in mice (tables 1, 3 and 4). These results demonstrate that sulfotransferases with different affinities for substrates are involved in the sulfation of troglitazone in mice and rats.
A higher CLu int, Sulf. was observed for theS-configuration of the 2-position of the chroman ring in mice, whereas a higher CLu int, Glu. was observed for the R-configuration (table 3). For rats, a higherCLu int of both conjugations was noted for theR-configuration (table 4). Thus, preferential sulfation of the R-configuration was observed in both species. Because a mixture of the four stereoisomers was used in the in vivoexperiments, the in vitro hepatic metabolic clearance of both conjugative reactions was calculated, based on a dispersion model using the mean CLu int obtained from in vitro conjugation reactions for each stereoisomer and compared with each other (table 2). The differences in sulfation and glucuronidation between mice and rats observed in vivo could be semiquatitatively predicted by extrapolation from the in vitro metabolism experiments. Although the major pathways,CL H,Glu. for ddY mice andCL H,Sulf. for rats, were well predicted in the in vivo CL H, the minor pathway CL H,Sulf. for ddY mice was overpredicted and the minor pathway CL H,Glu. for rats was underpredicted (table 2).
In this study, we used the dispersion model to predictCL H from the in vitro metabolism experiments based on our previous studies (Sugiyama et al., 1989; Iwatsbo et al., 1996), which indicated that the dispersion model (with D N of 0.17) was more appropriate than other models, such as the well-stirred model, for the prediction of a highly oxidatively metabolized drug. In the present study, the predicted CL H for RR andRS in KK mice, CL H,Glu. for ddY mice and CL H,Sulf. for rats, which showed relatively high clearance, were about 1.2-fold higher than those based on the well-stirred model, and the values predicted from the dispersion model were close to the CL H in vivo. On the other hand, the predicted CL H for SSand SR in KK mice, CL H,Sulf. for ddY mice and CL H,Glu. for rats, which showed low clearance, were almost identical for the two models. These results suggest that the dispersion model may be appropriate also for the prediction of in vivo conjugative CL Hfrom in vitro metabolism data.
Uneven distribution of sulfotransferase and UDP-glucuronosyltransferase in the hepatic lobes in rats has been reported, with a periportal localization of sulfation and uniform or perivenously distributed glucuronidation (Pang et al., 1992). These uneven zonations were estimated to affect competitive pathways of enzymes (Morris and Pang, 1987). For troglitazone, sulfation and glucuronidation are competitive pathways in KK and ddY mice and rats. However, no correction for this uneven distribution of enzymes was carried out in the present studies, because of a lack of quantitative information on the localization of isozymes of conjugating enzymes for troglitazone in liver. In rats, because the clearance is high and the enzyme reaction is assumed to be linear, the actual CL H,Sulf.assuming zonation might, in fact, be larger than that estimated in the present study.
Footnotes
-
Send reprint requests to: Takashi Izumi, Analytical and Metabolic Research Laboratories, Sankyo Co., 2–58, Hiromachi 1-Chome, Shinagawa-ku, Tokyo 140, Japan.
- Abbreviations:
- CLH
- hepatic plasma clearance
- CLH,Glu.
- hepatic plasma clearance for glucuronidation
- CLH,Sulf.
- hepatic plasma clearance for sulfation
- CLtot
- total-body plasma clearance
- CLuint
- metabolic intrinsic clearance
- CLuint,Glu.
- metabolic intrinsic clearance for glucuronidation
- CLuint,Sulf.
- metabolic intrinsic clearance for sulfation
- Cu
- unbound concentration
- fu
- unbound fraction
- HPFA
- high-performance frontal analysis
- HPLC
- high-performance liquid chromatography
- PAPS
- adenosine-3′-phosphate-5′-phosphosulfate
- UDPGA
- uridine-5′-diphosphoglucuronic acid
- Received February 6, 1996.
- Accepted November 22, 1996.
- The American Society for Pharmacology and Experimental Therapeutics


