


Abstract
A cDNA encoding a new member of the cytochrome P450 3A subfamily, P450 3A26, has been isolated from phenobarbital-induced canine liver. The sequence encodes a protein of 503 amino acids with 33 nucleotide differences conferring 22 amino acid substitutions when compared with the previously identified canine CYP3A12 enzyme. Nine of the amino acid differences are within the substrate recognition sites (SRSs) identified for P450 family 2, with five residue substitutions clustered within SRS-6. To facilitate heterologous expression inEscherichia coli, the N-terminus of 3A26 was modified. The expressed protein comigrated with a 3A-immunoreactive protein in dog liver microsomes with a slightly greater electrophoretic mobility on sodium dodecyl sulfate-polyacrylamide gel electrophoresis than 3A12, which suggests that 3A26 corresponds to a previously noted but never characterized 3A enzyme in dogs. Functional characterization of 3A26 was undertaken with use of progesterone, testosterone and androstenedione as substrates. Assays of expressed 3A26 and 3A12 demonstrated that 3A26 displays low steroid hydroxylase activity. Identification of an additional canine 3A enzyme should increase our understanding of xenobiotic metabolism in this important animal model. These findings also suggest that 3A26 and 3A12 may be an interesting model system for the investigation of structure-function relationships involved in steroid metabolism catalyzed by members of the cytochrome P450 3A subfamily.
Cytochromes 450 constitute a superfamily of hemoproteins that play a central role in the metabolism of a wide variety of xenobiotics and endogenous compounds. During the past decade, the study of these enzymes has been advanced greatly by the cloning of P450 cDNAs and expression of these proteins in heterologous systems. P450 family 3, which consists of the single subfamily 3A, is particularly important because of its metabolism of a wide range of pharmacologically, physiologically and toxicologically important agents. Compounds metabolized by P450 3A enzymes include macrolide antibiotics such as erythromycin and triacetyloleandomycin (Wrighton et al., 1985), the calcium channel blockers nifedipine and diltiazem (Guengerich et al., 1986), the immunosuppressive agent cyclosporine (Kronbachet al., 1988), steroidal compounds (Waxman et al., 1988) and several carcinogens including benzo(a)pyrene and aflatoxin B1 (Shimada et al., 1989;Gallagher et al., 1994). In addition, adverse pharmacokinetic drug interactions have been observed clinically with the concomitant use of multiple drugs that are metabolized by 3A enzymes (Periti et al., 1992). Despite the numerous studies, relatively little is known about the structure-function relationships of previously identified 3A enzymes. Unlike cytochromes P450 of family 2, 3A enzymes within or across species exhibit few dramatic substrate specificity differences that could provide obvious leads for site-directed mutagenesis of particular residues. Identification of substrates that can distinguish the various members of the 3A subfamily or of novel enzymes with altered substrate specificity would be very useful in the determination of the roles that specific residues play in conferring the distinctive catalytic activities of the 3A subfamily.
The rat, human and mouse P450 3A subfamilies consist of multiple members, which differ in their regulation (Nelson et al., 1996). Canine models have been used extensively in drug metabolism studies, but to date, only a single canine cytochrome P450 3A enzyme, 3A12, has been isolated (Ciaccio et al., 1991). Considerable evidence suggests that multiple canine 3A forms exist and that these may have different catalytic properties. Immunoblots of liver microsomes from PB-treated dogs were probed with a polyclonal antibody generated against canine hepatic 3A12. The results indicated the presence of two distinct proteins, one with an apparent molecular weight of 51 kDa, corresponding to 3A12, and the second with an apparent molecular weight of 49.5 kDa (Ciaccio and Halpert, 1989). In addition, previous studies demonstrated differences between the 6β-hydroxylation of steroids and TAO complex formation in canine liver microsomes. In particular, although both reactions were induced by PB and inhibited by antibodies to 3A12, TAO-P450 complex formation had little effect on steroid 6β-hydroxylation. These data suggested that some PB-inducible cytochrome P450 3A other than P450 3A12 might be responsible for TAO complex formation in dog liver microsomes. Finally, complex Southern blot hybridization patterns were observed when canine genomic DNA was probed with the 3A12 cDNA (Ciaccio and Halpert, 1989). Thus, several lines of evidence support the hypothesis that multiple canine cytochromes P450 3A exist, and that these enzymes may differ in their substrate specificity.
This study describes the isolation of a cDNA encoding a novel member of the cytochrome P450 3A subfamily, P450 3A26, and its subsequent heterologous expression and functional characterization. Degenerate oligonucleotide PCR techniques were used to probe the cDNA library, which resulted in the isolation of a 1.97-kbp fragment encoding the 3A26 enzyme. The cDNA encodes a protein of 503 amino acids and differs from 3A12 at 22 amino acid positions. 3A26 was expressed inEscherichia coli as described previously (Barnes et al., 1991; Born et al., 1996). The different catalytic activities ascribed to this enzyme will be useful in the elucidation of structure-function relationships between 3A26 and the previously identified 3A12.
Materials and Methods
Materials.
Restriction endonucleases and media for bacterial growth were purchased from GIBCO-BRL (Grand Island, NY). The pKK233–2 and pSE380 expression plasmids were purchased from Pharmacia (Alameda, CA). Primers for PCR amplification were obtained from the University of Arizona Macromolecular Structures Facility (Tucson, AZ). PCR products were purified with the GeneClean II kit from Bio101 (Vista, CA). TOPP3 cells were obtained from Stratagene (La Jolla, CA). CHAPS, progesterone, testosterone, androstenedione, erythromycin, troleandomycin, NADPH and DOPC were purchased from Sigma Chemical Co. (St. Louis, MO). [4-14C]Testosterone was obtained from Amersham Life Science (Arlington Heights, IL). [4-14C]Progesterone and [4-14C]androstenedione were obtained from Dupont-New England Nuclear (Boston, MA). HEPES was purchased from the Calbiochem Corp. (La Jolla, CA). Thin-layer chromatography plates (silica gel, 250 μm, Si 250 PA (19C)) were purchased from Baker (Phillipsburg, NJ). All other reagents and supplies not listed were obtained from standard sources.
Isolation and sequencing of the cDNA encoding P450 3A26.
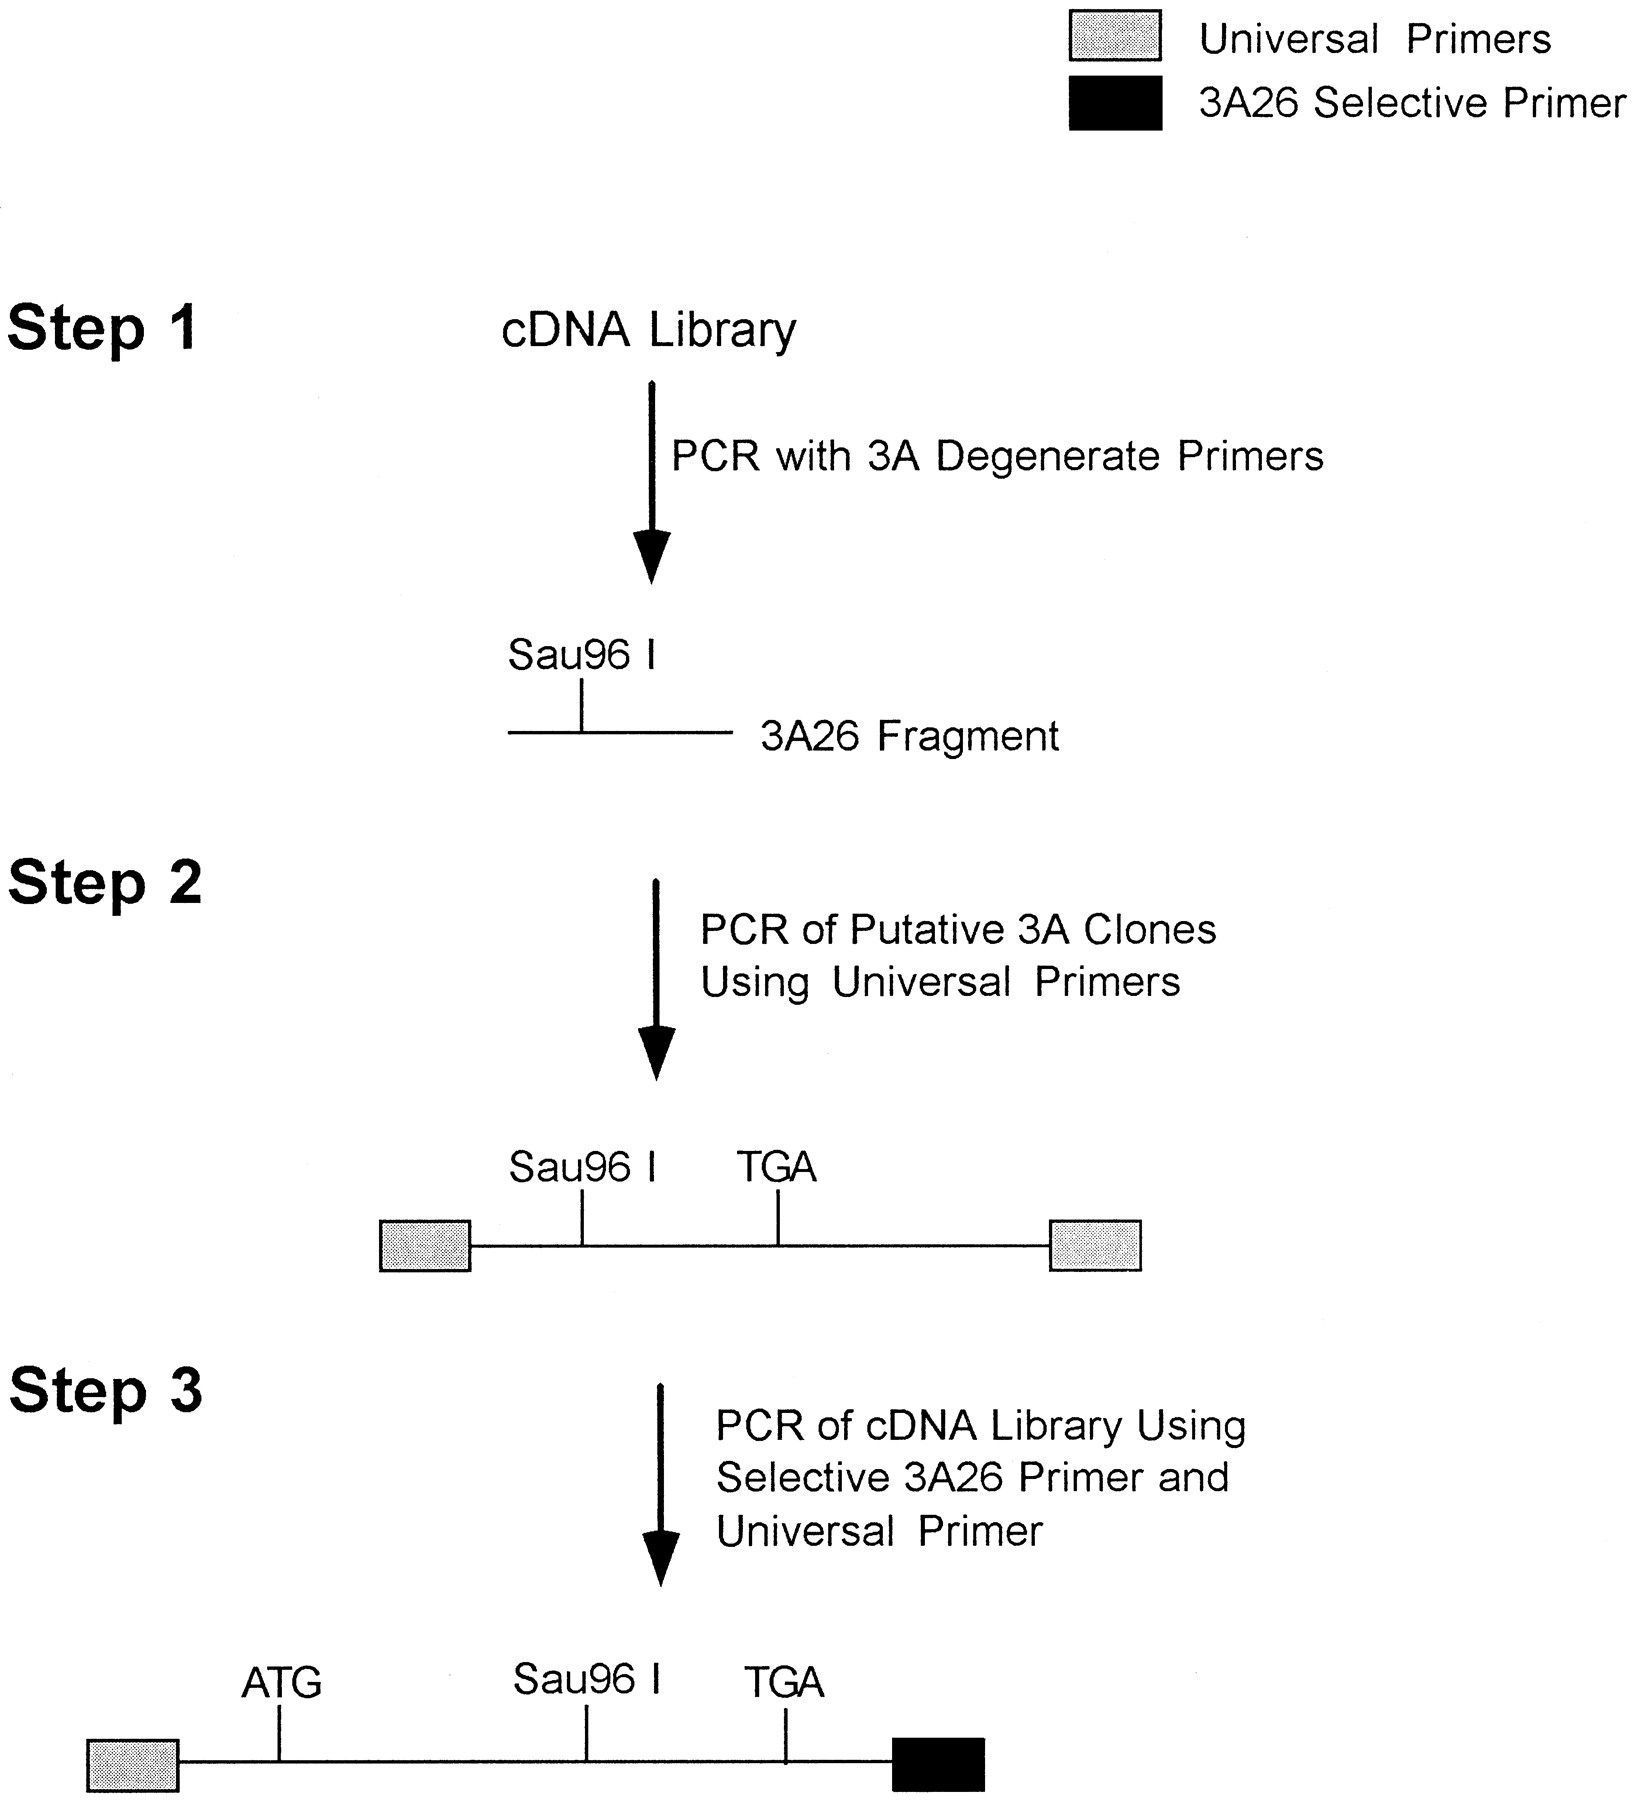
A λgt11 cDNA library previously generated and used to isolate the canine 3A12 cDNA (Ciaccio et al., 1991) was used for the isolation of the cDNA encoding P450 3A26. The overall cloning scheme is presented in figure 1. PCR was used in conjunction with degenerate oligonucleotide primers to probe the canine cDNA library for 3A sequences. The N-terminal (5′-TTTGC(GT)GG(AGCT)TATGA(AG)AC(AC)AC(AGCT)AGCAG-3′) and C-terminal (5′-CCTCAT(GT)CCAA(GT)GCA(AG)TT-3′) degenerate primers were based on highly conserved regions of mammalian P450 3A sequences, corresponding to amino acid residues 304–311 and 441–446 of 3A12, respectively. Use of these primers resulted in the amplification of a 0.4-kbp product (fig. 1, Step 1). Reaction conditions were: one cycle of 94°C for 2 min, 54°C for 2 min and 72°C for 2 min, followed by 30 cycles of 94°C for 1 min, 54°C for 1 min and 72°C for 1 min. The total reaction volume was 100 μl and all reactions were done in duplicate. A 20-μl aliquot of each reaction was run on a 1.2% agarose gel, and a single band at 0.4 kbp was identified and excised from the gel. The PCR products were isolated from the gel with the GeneClean II kit (Bio101, Vista, CA) and cloned into the pCRII cloning vector with the TA Cloning Kit (Invitrogen, San Diego, CA). Two types of clones could be distinguished. One type was identical in sequence to 3A12, and the other type possessed a Sau96I site and lacked anEarI site when compared with 3A12.

A representation of the cloning steps that led to the isolation of the cDNA encoding cytochrome P450 3A26. In Step 1, degenerate oligonucleotide primers based on conserved mammalian 3A sequences were used in conjunction with PCR to generate fragments of cDNA encoding members of the canine 3A subfamily including 3A12 and 3A26. Only the 3A26 fragment is depicted in this figure. This fragment carried several sequence differences when compared with 3A12, resulting in the identification of a Sau96I restriction endonuclease site not found in 3A12. In Step 2, previously isolated clones from a screen of λgt11 phage carrying canine cDNA sequences which interacted with 3A oligonucleotide probes were analyzed for the presence of Sau96I restriction sites as a means of identifying novel 3A clones. PCR of these λgt11 clones by use of universal primers (gray boxes) and subsequent restriction analyses resulted in the identification of a cDNA clone encoding a partial 3A26 sequence. In Step 3, primers based on differences between 3A26 and 3A12 sequences found 3′ to their respective translation stop sites and selective for 3A26 (black box) were used in conjunction with a universal primer to generate a PCR product encoding the entire coding region of 3A26. This sequence was subsequently cloned into the pCRII cloning vector and sequenced. Step 3 reactions were performed in duplicate and sequences of individual clones isolated from separate reactions were compared to ensure the fidelity of the PCR reactions.
These sequence variations were used to re-examine 13 clones isolated in the original homology screen of a λgt11 cDNA library that produced the 3A12 cDNA (Ciaccio et al., 1991) (fig. 1, Step 2). The cDNA inserts were amplified from the phage isolates by use of λgt11 forward and reverse primers. Two types of phage inserts were isolated in these experiments, the previously identified 3A12 and a variant clone lacking an EarI site and possessing a Sau96I site. However, because none of the variant clones were full length, it was necessary to go back to the library to isolate a cDNA encoding the complete 3A enzyme coding region (fig.1, Step 3). A region after the translation stop site was used to design a primer specific for the novel cDNA. That primer, 5′-AACCGGATAGGTTGAGTCTAC-3′, was used in conjunction with the forward λgt11 primer to produce a 1.8-kbp PCR product, which was cloned into the pCRII cloning vector and sequenced.
N-terminal modification and heterologous expression of 3A26.
The N-termini of canine 3A26 and 3A12 are identical in sequence until the first variation is encountered at base pair 295. Modifications to the N-terminus of 3A12 have been described previously (Born et al., 1996). Restriction endonucleases and subcloning were used in the modification of 3A26 for expression in E. coli. The unmodified N-terminus of 3A26 was removed using NcoI andScaI restriction endonuclease sites and replaced with the corresponding fragment from the modified N-terminus of 3A12. These alterations removed 10 amino acids in the signal anchor sequence of 3A26 and changed the second amino acid residue from aspartic acid to alanine, changes that have been shown to facilitate expression inE. coli (Barnes et al., 1991; Born et al., 1996). Both 3A26 and 3A12 constructs were subsequently subcloned into the pSE380 expression vector with an NcoI site at the 5′-end and BamHI or HindIII sites at the 3′-end, respectively.
Heterologous expression and preparation of solubilized E. coli membranes was done essentially as described previously (Johnet al., 1994). pSE3A26- and pSE3A12-containing TOPP3E. coli cells were grown at 37°C with 240 rpm shaking in 250 ml liquid TB media (12 g Bacto tryptone, 24 g Bacto yeast extract, 4 ml glycerol/l to mid log phase. IPTG (final concentration, 1.0 mM) and 80 mg/l δ-ALA were added, and cells were harvested after an additional incubation at 30°C with 190 rpm shaking. Maximum expression of 3A26 was observed at 42 h after IPTG/δ-ALA addition, and typically 5 to 8 nmol of P450 3A26 were recovered per liter of culture. Maximum expression of 3A12 was observed at 72 h after IPTG/δ-ALA addition and yields of 40 to 55 nmol/l of culture were routine.
Immunochemical detection of canine cytochromes P450 3A from heterologous expression systems and PB-induced canine liver microsomes.
Polyclonal antibodies raised against canine cytochrome P450 3A12 were isolated and characterized previously (Ciaccio and Halpert, 1989). Analyses of purified proteins, heterologously expressed proteins and microsomes by SDS-PAGE (8% polyacrylamide gels) were performed essentially as described by Laemmli (1970) and resolved proteins were stained with Coomassie blue or transferred to nitrocellulose membranes.
Functional characterization of E. coli-expressed canine P450s 3A26 and 3A12.
Steroid hydroxylase assays were performed with CHAPS-solubilized E. coli membrane preparations of 3A26 and 3A12 as described previously (John et al., 1994; Born et al., 1996). Ten picomoles P450 were reconstituted with 40 pmol E. coli expressed rat NADPH-P450 reductase, 10 pmol rat cytochrome b5 and 0.1 mg/ml DOPC in a minimal reaction volume. Assays were performed in 100 μl of 50 mM HEPES (pH 7.6) with 15 mM MgCl2 and 100 μM EDTA, 0.1 mg/ml DOPC and 0.06% CHAPS. Steroid stock solutions were made in 100% methanol. Methanol concentrations in all reactions were equivalent and did not exceed 1% of the total reaction volume. Individual testosterone, progesterone and androstenedione concentrations were 250 μM for all catalytic assays performed. Identification of metabolites was by relative mobility on TLC and by comparison to authentic standards (Waxman, 1991).
Results
Isolation of a cDNA encoding canine cytochrome P450 3A26.
The isolation of a cDNA clone encoding P450 3A26 was described under “Materials and Methods” and outlined in figure 1. Notably, both 3A12 and 3A26 were isolated from a cDNA library created with RNA from a single PB-induced dog liver, eliminating any possibility that the differences identified were caused by strain or inter-individual variations. In addition, PCR reactions were performed in duplicate, and one 3A26 clone from each reaction was isolated and analyzedvia dideoxy-sequencing. These sequences were found to be identical, which indicates that differences in DNA sequence between 3A26 and 3A12 are extremely unlikely to be the result of PCR error.
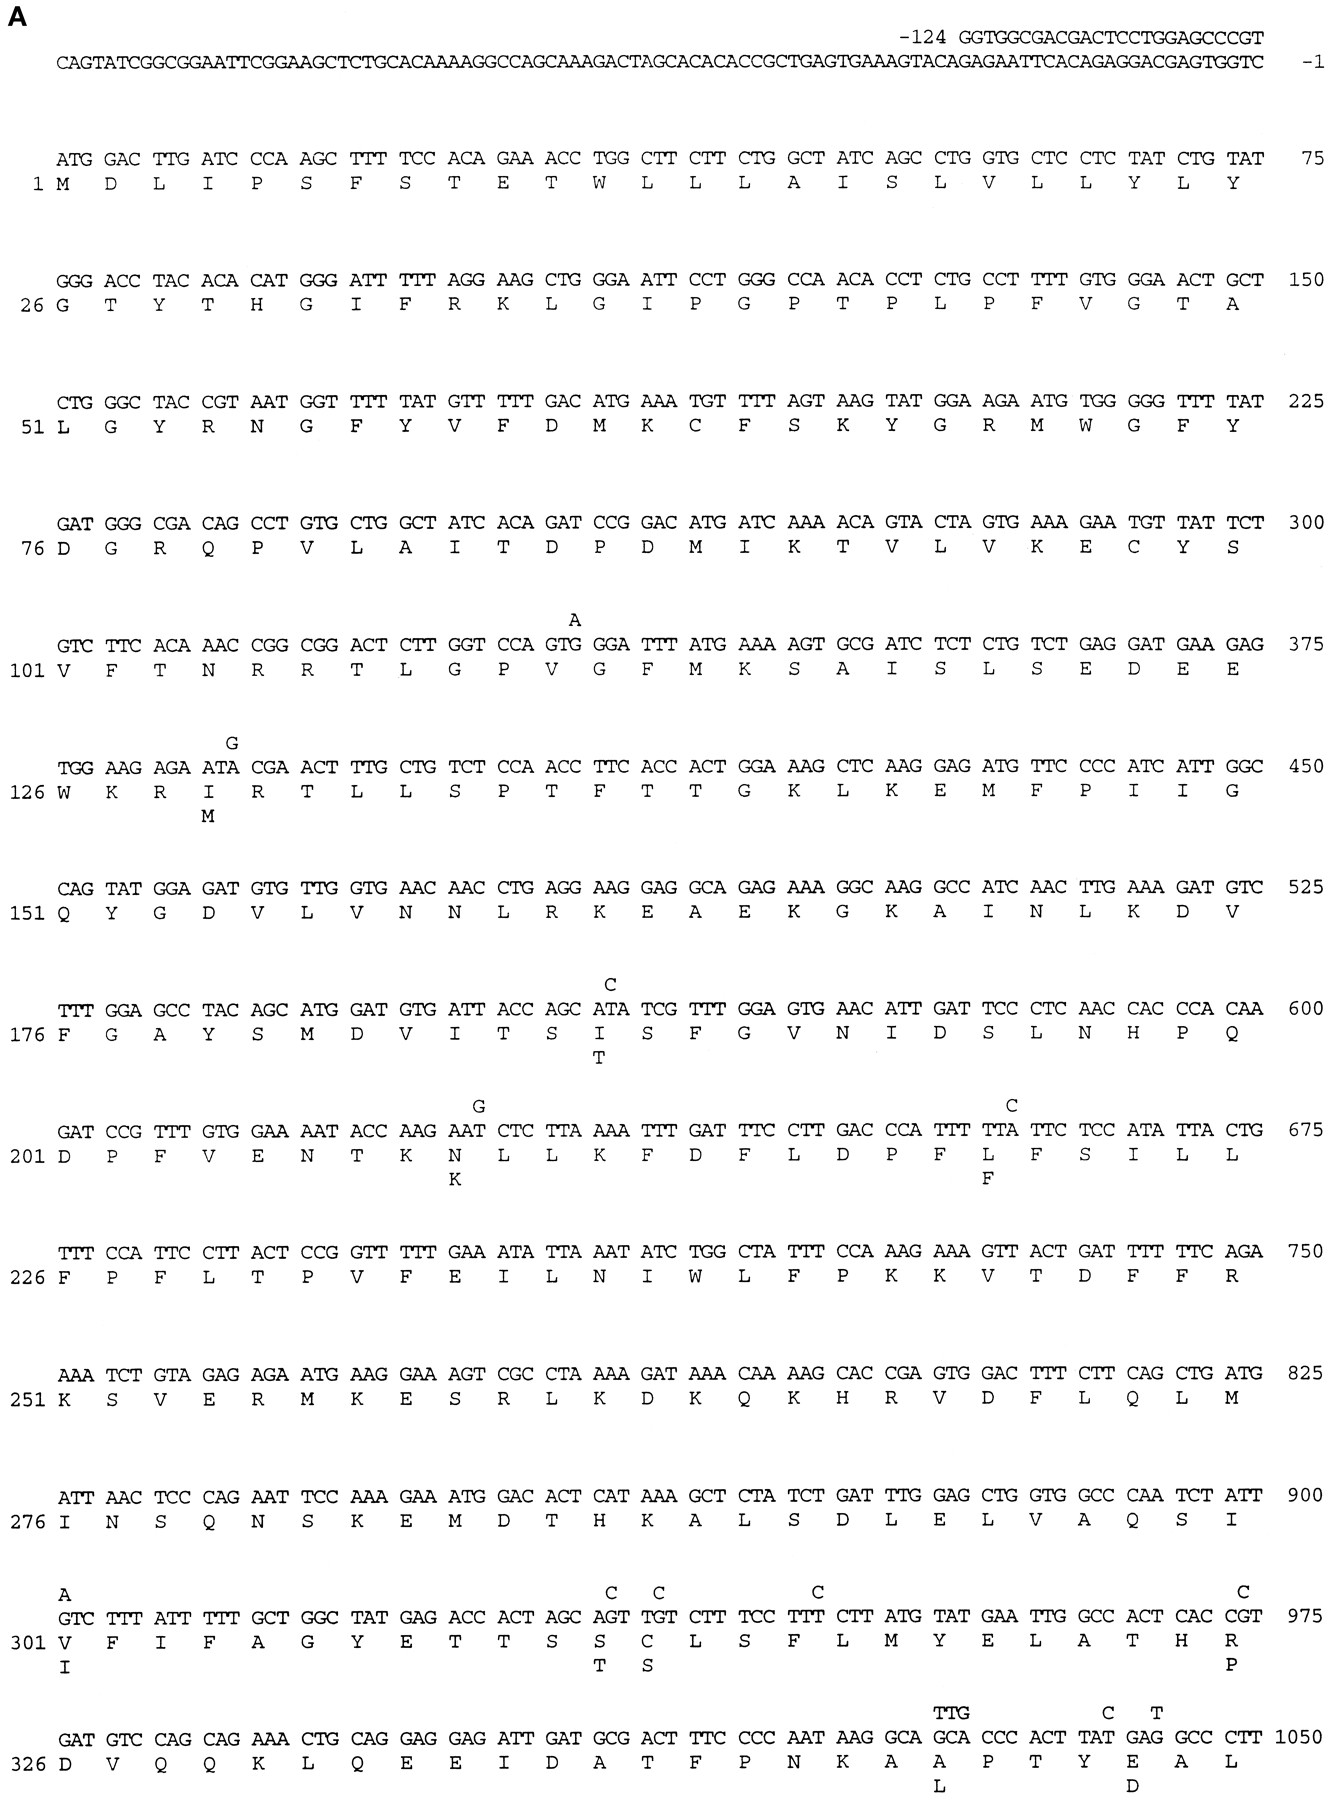
A comparison of P450 3A26 with the previously published canine P450 3A12 sequence is shown in figure 2. Both enzymes are 503 amino acids in length and share 95.6% amino acid identity. The two enzymes exhibit 33 nucleotide and 22 amino acid differences. Most of the amino acid differences are found in the C-terminal half of the sequence. It is also interesting to note that the 5′-untranslated region of 3A26 is identical in sequence to that found in the 3A12 clone, whereas significant variations are present in the 3′-untranslated regions of 3A26 and 3A12. These differences allowed for the design of a primer selective for 3A26, thus facilitating the isolation of the clone encoding the entire sequence from the λgt11 cDNA library (fig. 1, Step 3).


The complete sequence of cytochrome P450 3A26 isolated from a canine cDNA library. The sequence for 3A26 was determined and amino acids were deduced. The nucleotide and amino acid residue differences identified within the coding regions of 3A12 compared with 3A26 are shown above and below those of 3A26, respectively. The 5′- and 3′-noncoding regions of 3A12 were not aligned. A total of 33 nucleotide differences conferring 22 amino acid alterations were identified within the coding regions of the two sequences.
Putative SRSs (Gotoh, 1992) for P450 family 2 enzymes are predicted to contain key residues involved in enzyme-substrate interactions. The limited number of amino acid differences between 3A26 and 3A12 present interesting experimental possibilities in the investigation of structure-function relationships of P450 enzymes. Figure3 graphically represents the positions of amino acid sequence differences between 3A12 and 3A26. Putative 3A SRSs have been indicated, and the specific residue differences between 3A12 and 3A26 within these regions are noted by showing the one-letter code for the 3A12 residue, the position and the single letter code for the 3A26 residue. Changes in residues outside of the SRSs are noted with asterisks. Most of the changes found in the SRSs occur in sites 5 and 6, with only one difference in each of SRSs 2 and 4. No differences in amino acid sequence were observed in SRSs 1 or 3.

An alignment of the relative positions of variations in amino acid sequence between 3A12 and 3A26 with the proposed substrate recognition sites for P450 family 2 enzymes.
Comparison of differences found in P450 3A26 with analogous residues in other mammalian members of the cytochrome P450 3A subfamily.
Many of the residue differences identified between cytochromes P450 3A26 and 3A12 occur at positions that are generally well conserved in other mammalian P450 3A enzymes. Figure4 represents a comparison of residue differences within the putative SRSs found in 3A26 with other mammalian 3A enzymes. 3A26 has significant alterations in amino acid sequence in terms of residue volume, charge and hydrophilicity in these SRSs. For example, serine residues are found at positions 368 and 474 in 3A26, whereas proline is found at those positions in all other mammalian 3A sequences. In addition, the highly conserved lysine residue at position 476 has been replaced by a larger arginine residue in 3A26. These differences may prove to be significant in determining the metabolic profile of this enzyme.

Alignment of 3A enzymes at SRS positions where 3A26 and 3A12 differ. From a total of 22 amino acid differences identified between 3A26 and 3A12, 9 occur within these SRS regions.
Heterologous expression of the modified cytochrome P450 3A26 enzyme in E. coli.
Heterologous expression and preparation of CHAPS-solubilized membranes of the modified 3A26 and 3A12 in E. coli were performed as described previously (John et al., 1994). Expression levels for 3A26 were relatively low when compared with levels obtained for 2B or 3A constructs (John et al., 1994; Born et al., 1996; Harlow et al., 1997), resulting in maximal recovery of 5 to 8 nmol P450 per liter of culture. Maximal expression of P450 3A26 was found to occur at 42 h after addition of IPTG and δ-ALA when cultures were grown at 30°C. Culture temperatures of 24°C and 37°C resulted in reduced levels of recovered protein. In addition, variation of IPTG and δ-ALA concentrations as well as time of induction and order of addition of compounds were all examined and resulted in no increase in expression of P450 3A26 from the parameters described under “Materials and Methods.”
Immunoblot analyses of heterologously expressed P450s 3A26 and 3A12 and PB-induced canine liver microsomes.
Previous studies in this laboratory (Ciaccio and Halpert, 1989; Ciaccio et al., 1991) resulted in the isolation, identification and characterization of the canine cytochrome P450 3A12 enzyme. It was noted at that time that immunoblots of liver microsomes from PB-induced dogs with use of a polyclonal antibody to 3A12 produced two distinct immunoreactive bands. It was therefore of interest to examine the electrophoretic mobility of the expressed 3A26 enzyme. Immunoblot data of canine liver microsomes as well as heterologously expressed P450s 3A26 and 3A12 are shown in figure 5. Differences in electrophoretic mobility of these two cytochromes are evident, with 3A26 having greater mobility than 3A12. In microsomes from PB-induced dogs, two distinct bands were discernible, with the upper band corresponding in electrophoretic mobility to 3A12 and the lower band corresponding to 3A26. The possibility existed that, because of N-terminal modifications that removed 10 residues of the signal-anchor sequence, electrophoretic mobility of the expressed cytochrome P450 3A enzymes was altered significantly from that observed for their microsomal counterparts. However, no difference was observed between heterologously expressed 3A12 and the purified hepatic enzyme. These findings demonstrate that the differences in electrophoretic mobility observed for 3A26 and 3A12 are not likely to be the result of modifications that were introduced for heterologous expression. To demonstrate that other constituents in the samples had no influence on electrophoretic mobility differences, samples of 3A26 and 3A12 were combined and run along side of induced microsomal samples. It is evident from these experiments that P450 3A12 has decreased electrophoretic mobility relative to P450 3A26 on SDS-PAGE, and that each enzyme corresponds to immunoreactive bands identified in dog liver microsomes.

Immunoblot of E. coli-expressed 3A12 and 3A26, liver microsomal samples from PB-induced dogs and purified hepatic canine PBD-1 (3A12). Five picomoles of each cytochrome P450 enzyme were loaded into their respective lanes. A polyclonal antibody raised against 3A12 was used in these experiments. Because of the limited number of differences in their amino acid sequences, no differences in antibody recognition of the enzymes were expected or noted. Lane 1 of immunoblot B contains 5 pmol of 3A26 and 3A12 combined.
Characterization of the catalytic activity of cytochrome P450 3A26.
Steroid-hydroxylase assays were performed with solubilizedE. coli membrane preparations containing 3A26 or 3A12. The major steroid metabolite formed by other mammalian 3A enzymes is the 6β-OH product (Waxman et al., 1988; Ciaccio and Halpert, 1989; Born et al., 1996). The studies performed here (table1) indicate a significant reduction in steroid hydroxylase activity of P450 3A26 when compared with P450 3A12. Three different steroid substrates, androstenedione, testosterone and progesterone, were examined to determine the relative activities of heterologously expressed P450s 3A26 and 3A12. P450 3A12 exhibited high rates of steroid hydroxylase activity for all of the steroids employed, whereas the relative rates of steroid hydroxylation for 3A26 did not exceed 22% of 3A12 activity for any individual hydroxylated steroid metabolite. Interestingly, although steroid hydroxylase rates for 3A26 are low and determination of exact metabolite ratios is therefore difficult, metabolite profiles do seem to differ between 3A12 and 3A26.
Steroid hydroxylase activities of canine P450s 3A12 and 3A26
Discussion
Previous studies have suggested that multiple canine 3A forms exist and have distinct metabolic profiles (Ciaccio et al., 1989). The results presented here describe the isolation and initial characterization of a new canine cytochrome P450 3A enzyme, P450 3A26, from a cDNA library generated from PB-induced canine hepatic tissue. The 1.9-kbp cDNA encoding 3A26 exhibited 33 nucleotide and 22 amino acid differences when compared with canine P450 3A12. The sequence identity between CYP3A12 and CYP3A26 at the N-terminal and 5′-untranslated region, and the sequence differences found mostly at the C-terminal and 3′-untranslated region suggest that CYP3A26 might be the product of a recent “gene conversion” or “unequal crossing over” event involving CYP3A12. According to this hypothesis, the 5′ portion of the CYP3A26 gene would be derived from CYP3A12 and the 3′ portion would be derived from either an ancestral CYP3A26 gene, which was subsequently lost, or from a putative third canine CYP 3A gene. Southern blot evidence does not allow us to exclude the existence of a third, related CYP3A gene (Ciaccio et al., 1989). Recombination between closely related genes of the CYP2 family has been documented previously in the rat CYP2D subfamily (Matsunaga et al., 1990).
The recovery of heterologously expressed 3A26 was relatively limited and may be a limiting factor in future assays investigating its metabolic profile. However, it may be possible to augment the recovery of expressed 3A26. Recent mutagenesis studies examining the key residues involved in P450 3A4 substrate recognition (He et al., 1997) may give some indication of the cause of relatively low levels of expression of 3A26 in E. coli. These studies noted that the substitution of Pro-368 with Ser led to a 30-fold lower expression level of 3A4 than that of wild-type 3A4. Because residue 368 of 3A26 is a serine and all other mammalian P450s 3A examined contain a proline at this site, it is possible that expression of 3A26 is hampered by this single difference in amino acid sequence. Another serine for highly conserved proline substitution is observed at residue 474 of 3A26, which suggests a second potential site which could have a negative impact on expression. Although no direct evidence from expression studies with 3A26 indicates that these particular residues are contributing to lower expression levels inE. coli, these 3A4 mutagenesis findings do suggest that Ser-368 may be responsible for the low levels of expression of 3A26 inE. coli.
Immunoblot data presented here indicate that 3A26 has electrophoretic mobility characteristics similar to those of a canine 3A band identified in previous studies (Ciaccio et al., 1989). Specifically, the heterologously expressed 3A26 enzyme has slightly greater mobility than expressed 3A12 on SDS-PAGE. These differences are analogous to those seen in PB-induced canine liver microsomes in which two separate immunoreactive bands are discernible, which suggests that the 3A26 enzyme is analogous to the lower immunoreactive band and 3A12 corresponds to the upper band. These two enzymes are each 503 amino acids in length and share only 22 amino acid differences between them. Moreover, the molecular masses of 3A26 and 3A12, 57,689 Da and 57,684 Da, respectively, differ by only 5 Da. As observed in figure 4, in which microsomal preparations and purified hepatic 3A12 were compared with heterologously expressed enzyme samples, it was found that the N-terminal modifications that deleted 10 amino acids and reduced the size of each heterologously expressed enzyme by 1160 Da had no discernible effect on electrophoretic mobility. Taken together, these data indicate that differences in molecular weight cannot account for the differences in electrophoretic mobility observed for 3A12 and 3A26. Similar findings have been reported for cytochromes P450 2B1 and 2B2, which differ by only 14 amino acids from a total of 491 and have been found to generate two distinct immunoreactive bands (Ryan et al., 1982; Waxman et al., 1983). The molecular masses of these two enzymes are also quite similar to one another, differing by only 13 Da from a total of more than 55,900 Da each. These observations suggest that some secondary protein structure remains intact even after samples were boiled in SDS and may account for differences in electrophoretic mobility between these enzyme homologs.
In addition to the differences in electrophoretic mobility and heterologous expression levels of P450s 3A26 and 3A12, several distinctions in catalytic activity have been identified between these two enzymes. The major differences in steroid hydroxylase activities identified here clearly demonstrate that cytochrome P450 3A26 is uniformly less active than 3A12. Previous work on human cytochromes P450 3A4 and 3A5 has shown some parallels when compared with canine P450s 3A12 and 3A26. P450s 3A4 and 3A5 exhibit 84% amino acid sequence identity and metabolize many of the same substrates. Both P450s 3A4 and 3A5 have been found to catalyze 6β-hydroxylation of testosterone, progesterone and androstenedione, although minor hydroxylation products such as 16α-hydroxyprogesterone comprised approximately 20% of the total metabolites of 3A4 but not 3A5 (Aoyama et al., 1989). Recent site-directed mutagenesis studies have demonstrated that the replacement of Ile-369 in P450 3A4 with the corresponding Val in 3A5 caused the suppression of progesterone 16α-hydroxylase activity (Heet al., 1997). Interestingly, P450 3A26 also has a Val at residue 369 and has no appreciable 16α-hydroxylase activity. Taken together, these experiments suggest that differences in residues of SRS5 found between P450s 3A12 and 3A26 may play major roles in determining steroid hydroxylase activity differences observed for these enzymes.
This study has resulted in the isolation, expression and functional characterization of a cDNA encoding the canine cytochrome P450 3A26 enzyme. This enzyme exhibits marked differences in the respective rates of hydroxylation of steroid substrates. Immunoblot data also confirm the presence of multiple 3A proteins in canine microsomes, with 3A26 corresponding to a previously unknown enzyme of lower apparent molecular weight identified in previous studies. Future experiments will use site-directed mutagenesis techniques to facilitate increased heterologous expression of 3A26 and to identify the residues responsible for conferring specific metabolism profiles to 3A26 and 3A12. These studies should be invaluable in the determination of P450 3A substrate specificity.
Footnotes
-
Send reprint requests to: David J. Fraser, Department of Pharmacology and Toxicology, College of Pharmacy, University of Arizona, Tucson, AZ 85721.
-
↵1 Supported by Procter & Gamble Pharmaceuticals, Inc., a fellowship from the Flinn Foundation, NIH Grant GM 54995, and Core Center Grant ES 06694. Presented in part at the XIth International Symposium on Microsomes and Drug Oxidations, Los Angeles, CA, July 1996 and the American Society for Pharmacology and Experimental Therapeutics Annual Meeting, San Diego, CA, March 1997.
- Abbreviations:
- P450
- cytochrome P450
- PB
- phenobarbital
- TAO
- troleandomycin
- SDS-PAGE
- sodium dodecyl sulfate-polyacrylamide gel electrophoresis
- PCR
- polymerase chain reaction
- androstenedione
- androst-4-ene-3,17-dione
- DOPC
- dioleoylphosphatidylcholine
- HEPES
- 4-(2-hydroxyethyl)-1-piperazineethanesulfonic acid
- IPTG
- isopropyl-β-d-thiogalactopyranoside
- ALA
- δ-aminolevulinic acid
- CHAPS
- 3-((3-cholamidopropyl)-dimethylammonio)-1-propanesulfonate
- EDTA
- (ethylenedinitrilo)-tetraacetic acid
- TLC
- thin layer chromatography
- SRS
- substrate recognition site
- -OH
- hydroxy
- kbp
- kilobase pairs
- Received April 7, 1997.
- Accepted August 11, 1997.
- The American Society for Pharmacology and Experimental Therapeutics


