


Abstract
UDP glucuronosyltransferase (UGT) 1A6 is a major isoform in human liver that glucuronidates numerous drugs, toxins, and endogenous substrates with high interindividual variability. The molecular basis for this variability remains unknown, although it likely involves genetic and environmental factors. Phenotype-genotype studies were conducted using a well characterized human liver bank (n = 54) and serotonin glucuronidation as a UGT1A6-specific phenotype marker. A positive moderate-to-heavy alcohol use history (>14 drinks per week) was the only demographic factor examined that correlated with phenotype and was associated with 2-fold higher serotonin glucuronidation (p < 0.001), UGT1A6 protein content (p = 0.004), and UGT1A6 mRNA content (p = 0.025). UGT1A6 gene resequencing identified three nonsynonymous polymorphisms (S7A, T181A, and R184S) in exon 1 and eight novel polymorphisms in the 5′-regulatory region (to -2052 base pairs). S7A was in complete linkage disequilibrium with three 5′-regulatory region polymorphisms (-1710c→g, -1310del5, and -652g→a). Initial univariate analyses did not identify any significant phenotype-genotype associations. However, in livers without substantial alcohol exposure, 50% lower UGT1A6 mRNA levels (p = 0.026) were found in carriers of the linked S7A-enhancer polymorphisms compared with noncarriers but without significant effect on UGT1A6 protein content or glucuronidation activities. Three major haplotypes, including *1A (reference), *1B (-1535g→a and -427g→c), and *2 (-1710c→g, -1310del5, -652g→a, S7A, T181A, and R184S), were identified, accounting for 90% of alleles. No association of haplotype with any of the phenotype measures could be discerned. In conclusion, although the identified UGT1A6 polymorphisms did not explain the observed glucuronidation variability, there does seem to be a significant role for environmental factors associated with alcohol consumption.
The UDP-glucuronosyltransferases (UGTs) comprise a superfamily of enzymes that catalyze the conjugation of glucuronic acid with hydrophobic compounds, thereby greatly enhancing water solubility (Mackenzie et al., 1997). Glucuronidation serves as one of the main clearance mechanisms for drugs from virtually all therapeutic classes, as well as for numerous dietary constituents, environmental pollutants, chemical carcinogens, and their phase I oxidation products. UGT1A6 is a major UGT isoform in humans that mediates the glucuronidation of drugs, such as acetaminophen (Bock et al., 1993; Court et al., 2001) and valproate (Ethell et al., 2003); carcinogens, such as benzo(a)pyrene; and endogenous substrates, including serotonin (Krishnaswamy et al., 2003b) and 5-hydroxytryptophol (Krishnaswamy et al., 2004). Recent work in this laboratory indicates that serotonin is glucuronidated exclusively by human UGT1A6, and as a consequence serotonin glucuronidation can serve as a specific indicator of UGT1A6 expression and function in human tissues (Krishnaswamy et al., 2003a).
Interindividual differences in UGT1A6-mediated glucuronidation may have important toxicological, pharmacological and physiological consequences. Our previous work indicates that individual variability in UGT1A6 expression and function in human liver is considerable, with more than 120-fold variability in UGT1A6 protein content and more than 13-fold variability in serotonin glucuronidation activities (Krishnaswamy et al., 2003a). The mechanism for this variability at present is unclear, but it is likely to involve both environmental and genetic causes. UGT1A6 in either human or rodent model systems is known to be induced by compounds that act via the arylhydrocarbon receptor (Munzel et al., 1998; Bock-Hennig et al., 2002; Jemnitz et al., 2002; Auyeung et al., 2003a,b), Nrf2 (Chan et al., 2001), the constitutive androstane receptor (Bock et al., 1987), and the pregnane X receptor (Xie et al., 2003; Gardner-Stephen et al., 2004). A number of studies have also identified highly prevalent sequence polymorphisms within the UGT1A6 gene that are suggested to contribute to interindividual variability. Two missense mutations (T181A and R184S) comprising a single allele (UGT1A6*2) were originally identified by Ciotti et al. (1997). Studies using recombinant allozymes indicated that UGT1A6*2 glucuronidated compounds at a slower rate compared with the wild-type UGT1A6*1 (Ciotti et al., 1997). However, a study using human liver microsomes failed to find an effect of UGT1A6*2 on glucuronidation of either 4-methylumbelliferone or 4-nitrophenol, although the number of livers examined (n = 39) may have been insufficient to detect a difference (Peters et al., 2003). More recent work (Nagar et al., 2004) indicates that the UGT1A6*2 allele also contains an additional amino acid substitution (S7A). Furthermore, study of a somewhat larger number of livers (n = 58) suggested that the UGT1A6*2 polymorphism was associated with approximately 2-fold higher glucuronidation activity using 4-nitrophenol and 1-napthol as substrates (Nagar et al., 2004). These findings were also supported by recombinant allozyme activity data that showed 2-fold higher intrinsic clearance (Vmax/Km) values in UGT1A6*2 compared with UGT1A6*1 preparations (Nagar et al., 2004).
A major limitation of the UGT1A6 phenotype-genotype association studies that have been conducted to date is the use of relatively nonspecific substrate probes such as 4-nitrophenol, 1-napthol, and 4-methylumbelliferone for evaluation of liver glucuronidation phenotype. Significant linkage disequilibrium between the UGT1A6*2 and UGT1A1*28 (associated with Gilbert's syndrome) polymorphisms has recently been described by several investigators (Kohle et al., 2003; Peters et al., 2003), and so differences in liver glucuronidation activity attributed to UGT1A6*2 might instead result from effects of UGT1A1*28. Consequently, the aim of the present investigation was to rigorously evaluate genotype-phenotype associations in a well characterized human liver bank (n = 54) using serotonin glucuronidation as a UGT1A6-specific marker activity. In addition to the UGT1A6 exon 1 region (which encodes the variable aglycone binding domain), we also resequenced the gene 5′-regulatory region (to -2052 bp) and measured liver UGT1A6 mRNA and protein content to identify polymorphisms that might influence gene expression.
Materials and Methods
Reagents. Unless otherwise indicated, most reagents, including alamethicin, UDP-glucuronic acid (sodium salt), 5-hydroxytryptamine hydrochloride (serotonin), 4-nitrophenol, and 4-nitrophenol glucuronide were purchased from Sigma-Aldrich (St. Louis, MO). All reagents were of analytical or better grade. Oligonucleotide primers were synthesized by the Tufts Core Facility (Tufts University, Boston, MA) using an automated DNA synthesizer (ABI 380B; Applied Biosystems, Foster City, CA).
Human Liver Tissues. Liver samples from donors with no known liver disease were obtained from either the National Disease Research Interchange (Philadelphia, PA) or the Liver Tissue Procurement and Distribution Service (Minneapolis, MN) with the approval of the Tufts University Institutional Review Board. All livers were either intended for transplantation but had failed to tissue match or were normal tissue adjacent to surgical biopsies. Donors were primarily of white ethnicity (n = 48), but also included four African-Americans and two Hispanics. Other available demographic information included gender (16 females and 38 males) and age (median 41 years; range 2-75 years). Smoking history was positive for 19 donors, negative for 29 donors, and unknown for six donors, whereas moderate-to-heavy alcohol use (defined as 14 or more drinks per week) was positive for 13 donors, negative for 34 donors, and unknown for eight donors. Complete details of donor demographics for individual livers have been reported previously (Hesse et al., 2004).
Microsomes. HLMs were prepared by differential ultracentrifugation as described previously (Court et al., 1997). Microsomal pellets were suspended in 0.1 M potassium phosphate buffer, pH 7.5, containing 20% glycerol and kept at - 80°C until use. Protein concentrations of HLM samples were determined using the bicinchoninic acid protein assay (Pierce Chemical, Rockford, IL) with bovine serum albumin as the standard. The quality of the liver samples was ascertained by reference to at least 10 other glucuronidation activities measured in this laboratory using the same set of livers. Livers that consistently showed low activity values (>2-fold lower for all measured activities) relative to the median activity value for the entire liver set had been excluded from study.
HLMs Glucuronidation Activities and UGT1A6 Protein Quantitation. The rates of in vitro glucuronidation of serotonin (4 mM) and 4-nitrophenol (1 mM), and UGT1A6 protein content data that were used in this study (including details of assay methods) have been reported in detail previously (Krishnaswamy et al., 2003a). The UGT1A6-specific antibody (WB-UGT1A6; BD Gentest, Woburn, MA) that we used was shown in previous work to lack cross-reactivity with all commercially available recombinant UGT forms, including UGTs 1A1, 1A3, 1A4, 1A7, 1A8, 1A9, 1A10, 2B4, 2B7, 2B15, and 2B17.
UGT1A6 mRNA Quantitation. Total RNA was isolated from 50 to 100 mg of liver tissue (TRIzol; Sigma-Aldrich) and then repurified with a spin column (RNeasy; QIAGEN, Valencia, CA). UGT1A6 and GAPDH mRNA contents were quantified with a branched DNA signal amplification assay (QuantiGene; Bayer Diagnostics, East Walpole, MA) using probe sets from XenoTech LLC (Kansas City, KS) based on previously published methods (Czerwinski et al., 2002; Hesse et al., 2004). The UGT1A6 probe set was designed to hybridize to UGT isoform unique sites within the exon 1 region of the UGT1A6 mRNA spanning the 5′-untranslated region to +433 bp (relative to the first nucleotide of the start codon—nucleotide 97 of the GenBank reference sequence NM_001072.2). Luminescence from the capture wells was measured using a luminescence counter (Wallac Trilux #1450 Microbeta; PerkinElmer Life and Analytical Sciences, Boston, MA). Luminescence signal using both UGT1A6 and GAPDH probes was determined to be linear (Rs = 0.94-1.0) over a wide range of RNA concentrations (0.03125-1 μg of total RNA per well). Consequently, for the assay, 0.5 μg of total RNA from each liver was added to each well. UGT1A6 data were normalized to GAPDH data and expressed relative to the liver with the lowest value. Assays were performed in duplicate twice (on separate days), and results were averaged. Between-day variation averaged less than 30% (Rs = 0.91).
Resequencing of the UGT1A6 Gene Exon 1 and 5′-Regulatory Region. Genomic DNA was isolated from 50 to 100 mg of human liver tissue using DNAzol (Invitrogen, Carlsbad, CA). PCR reactions were performed using Platinum taq (Invitrogen) according to the manufacturer's instructions. Preliminary PCR reactions for each primer set were performed using the gradient capability of the thermal cycler (PTC200; MJ Research, Waltham, MA) to identify an appropriate anneal temperature that was then used in subsequent reactions. Typical cycler settings included an initial denaturation step (95°C) for 10 min followed by 40 cycles of denaturation (95°C) for 30 s, anneal (between 62 and 72°C; optimized for individual primer sets) for 30 s, and extend (72°C) for 1 min. The complete UGT1A6 exon 1, including the exon-intron boundary (-65 to +913 bp), was amplified by genomic PCR using primers Pri 46 (5′-tag gag ccc tgt gat ttg gag agt g-3′) and Pri 47 (5′-gag gac aga gcc tgg aag aaa caa g-3′) and sequenced (ABI Prism 3100; Applied Biosystems) with internal primers Pri 56 (5′-aca ccc tga act tct tta agg ag-3′) and Pri 84 (5′-gag tga aaa ctc ttt att acc g-3′). Sequence positions are given relative to the first nucleotide of the predicted UGT1A6 translation start codon (nucleotide 108,262 of the GenBank reference sequence NG_002601.1). A similar procedure was used to amplify the UGT1A6 promoter and 5′-regulatory region (-2052 to +69 bp) using primers Pri 299 (5′-cat gcc cca aag tgc taa gaa gaa aac c-3′) and Pri 300 (5′-gga ctt ctg gga cta aga aca gga ccc ac-3′) with internal sequencing primers Pri 301 (5′-gtt gct cag gct tct tct ccc ttc c-3′), Pri 302 (5′-gtt att caa aac aga tcc ctt tcg atc-3′), Pri 303 (5′-ccg tat tgt ttg caa tat cct ttg-3′) and Pri 304 (5′-gtc atc ttc aaa gtg ttg cta taa c-3′).
Data Analysis. Statistical analyses were conducted with the SigmaStat program (version 3.1; SPSS Inc., Chicago, IL). Data were routinely evaluated for normality of distribution and equal variance, and in instances where these tests failed nonparametric methods of statistical analysis were used. Unless otherwise indicated, a p value of <0.05 was considered statistically significant.
ARLEQUIN version 2.001 (Schneider et al., 2001) was used to evaluate SNP genotype frequencies for consistency with the Hardy-Weinberg equilibrium by a modified Markov-chain random walk algorithm. The significance of linkage disequilibrium between identified SNPs was also assessed by ARLEQUIN using a pairwise likelihood-ratio test. The possible effect of mutations identified in the 5′-regulatory region on transcription factor binding was analyzed by comparing consensus sites for the mutant with wild-type sequences as predicted by the MatInspector program (Quandt et al., 1995). The location of likely PXR and CAR nuclear receptor binding sites was also evaluated by use of the Nubiscan program (Podvinec et al., 2002).
Relationships between each of the phenotype parameters evaluated (including serotonin and 4-nitrophenol glucuronidation activities, immunoquantified UGT1A6 protein content and UGT1A6 mRNA content) were examined by Spearman correlation analysis. The effect of donor gender and histories of smoking and alcohol ingestion on each of the phenotype parameters was evaluated by the Mann-Whitney rank sum test. Possible interactions between these independent variables were also evaluated by two-way ANOVA on rank transformed phenotype data. In instances when the ANOVA indicated a significant difference (p < 0.05) post hoc multiple pairwise comparisons of groups were performed using the Student-Newman-Keuls method.
For each of the identified SNPs, the influence of genotype (homozygous reference; heterozygous; and homozygous variant) on each of the measured phenotypes was analyzed initially by ANOVA on rank transformed data. Data were additionally stratified by alcohol exposure history (nonalcoholic and alcoholic groups) and ethnicity (white only group) to evaluate the effect of the presence of at least one variant allele (SNP carrier status) on each phenotype measure using the Mann-Whitney rank sum test.
Genotype data were then used to reconstruct multisite haplotypes by the Bayesian statistical method implemented in the program PHASE version 2.0.1 (Stephens et al., 2001). The analysis was run 10 times with different seed values for the random number generator, and results with the best goodness of fit values were used. The stability of these haplotype estimates was confirmed by showing no change in estimates after running the analysis a further 10 times. Identified haplotypes were compared with those previously described by the UGT allele nomenclature committee (http://som.flinders.edu.au/FUSA/ClinPharm/UGT/1A6alleles.html). Novel haplotypes were named according to the established guidelines and approved by the committee. The effect of diplotype (haplotype pair) on each of the phenotype parameters was evaluated by one-way Kruskal-Wallis ANOVA on ranks initially using all data, and also with data stratified by alcohol exposure history and ethnicity.
Results
UGT1A6 Activity, Protein and mRNA Variability, and Correlations. Serotonin glucuronidation activities (n = 53), immunoquantitated UGT1A6 protein content (n = 51), and relative UGT1A6 mRNA content (normalized to GAPDH; n = 50) are shown Fig. 1. Median (range) values were 3.6 (1.1-14) nmol/min/mg protein for serotonin glucuronidation, 30 (1-129) times that of the lowest liver for relative UGT1A6 protein content, and 3.5 (1-13) times that of the lowest liver for relative UGT1A6 mRNA content. Interindividual variability as indicated by the ratio of the 95th divided by the 5th percentile values was much greater for UGT1A6 protein content (27-fold) compared with serotonin glucuronidation activities (8-fold) and UGT1A6 mRNA content (7-fold). The correlation between UGT1A6 protein and serotonin glucuronidation activity was relatively good (Rs = 0.76, n = 51, p < 0.001) (Fig. 1A), whereas UGT1A6 mRNA levels were less well correlated with serotonin glucuronidation (Rs = 0.47, n = 47, p < 0.001) (Fig. 1B) and with UGT1A6 protein content (Rs = 0.53, n = 47, p < 0.001) (Fig. 1C). Correlation of UGT1A6 protein with 4-nitrophenol glucuronidation (used as an alternate UGT1A6 activity marker) was essentially identical to that of serotonin glucuronidation (Rs = 0.76, n = 51 p < 0.001), although the correlation between the two activities was slightly less (Rs = 0.70, n = 53 p < 0.001) (data not shown).
Effect of Donor Demographics. As shown in Table 1, alcohol use history was associated with 2-fold higher median UGT1A6 mRNA content (p = 0.025), UGT1A6 protein content (p = 0.004), serotonin glucuronidation (p < 0.001), and 4-nitrophenol glucuronidation (p = 0.028) compared with donors without an alcohol use history. Positive smoking history and gender had no influence on any of the measured phenotype parameters (p > 0.05). Since alcohol and tobacco are frequently coabused, two-way ANOVA on rank transformed data were used to evaluate effects of each factor independent of the effect of the other factor. As shown in Fig. 2, A to D, a positive alcohol history consistently was associated with higher glucuronidation activities, UGT1A6 protein, and UGT1A6 mRNA levels, regardless of smoking history. Conversely, smoking history again showed no apparent effect on any of the measured phenotypes, regardless of alcohol use history.
Univariate analysis of effects of liver donor demographics and genotype on UGT1A6 glucuronidation, protein, and mRNA content

Correlations of serotonin glucuronidation with UGT1A6 protein content (A), and of relative UGT1A6 mRNA content with serotonin glucuronidation (B), and with relative UGT1A6 protein content (C) measured in the same bank of human livers (n = 54). UGT1A6 mRNA content determined for this study using a branched DNA assay, whereas serotonin glucuronidation (measured using 4 mM serotonin concentration) and UGT1A6 protein content data were derived from a previous study (Krishnaswamy et al., 2003a). Also shown are the Spearman correlation coefficients (Rs) and significance values for each correlation.
Polymorphisms in the UGT1A6 Gene Exon 1 and 5′-Regulatory Region. Resequencing of the UGT1A6 gene exon 1 and associated 5′-regulatory region DNA from the livers of 54 individuals identified 12 different sequence variants (Fig. 3), 10 of which were relatively common in the mainly white population studied (>20% allele frequency). Of the four variants in exon 1, three were coding (cSNPs) resulting in the amino acid variants S7A (19t→g), T181A (541a→g), and R184S (552a→c), whereas the remaining SNP was silent (315a→g). The remaining eight sequence variants in the 5′ regulatory region included seven SNPs and one deletion mutation (-1310 to -1306 delete [aggag]). Of the 12 polymorphisms identified in this study, the four exon 1 SNPs (S7A, T181A, R184S, and 315a→g) have been reported previously (Nagar et al., 2004), whereas all of the 5′-regulatory region variants, to our knowledge, were considered to be novel unpublished findings.
Preliminary computer analysis (MatInspector; Quandt et al., 1995) of the potential effect of each of the promoter mutations on consensus transcription factor consensus binding sites identified five of eight variants that were predicted to significantly alter sites through either gain or loss of consensus sites (data not shown). However, none of these variants could be shown to affect potential binding sites for nuclear factors that have been implicated so far in the regulation of UGT1A6, including hepatocyte nuclear factor 1α (-160 to -144 bp), Nrf2 (-203 to -195 bp; -591 to -583 bp; -1484 to -1477 bp), Ah receptor/aryl hydrocarbon receptor nuclear translocator (-1503 to -1499 bp), and PXR/CAR (-854 to -823 bp) (Fig. 3).
The frequency distributions of genotypes for all of the identified SNPs were consistent with Hardy-Weinberg equilibrium (p > 0.05), indicating that the liver bank was likely a representative sample of the population from which the livers were obtained. Complete linkage disequilibrium was identified between -1710c→g, -1310del5, -652g→a, and S7A. There was also highly significant linkage (p < 0.001) between each of these variants and -1377g→a.
UGT1A6 Genotype-Phenotype Analyses. As shown in Table 1, univariate statistical analyses failed to identify any associations between UGT1A6 genotype and each of the measured phenotype parameters. Since alcohol was previously shown to significantly affect all phenotype measures, data were stratified by alcohol use history to control for this effect. Since this resulted in smaller genotype group sizes, genotypes were reclassified into carrier and noncarrier groups to enhance statistical power. Using this approach (Table 2), all of the completely linked sequence variants (1710c→g, -1310del5, -652g→a, and S7A) as well as the closely linked -1377g→a were shown to be associated with 2-fold lower median UGT1A6 mRNA content (p = 0.026) in livers without an alcohol exposure history but not in livers with an alcohol history (p > 0.05). However, there were no genotype effects on any other phenotype parameter, including serotonin and 4-nitrophenol glucuronidation activities or UGT1A6 protein content.
Effect of UGT1A6 genetic polymorphism carrier status on glucuronidation, protein, and mRNA content in livers without an alcohol exposure history
UGT1A6 Gene Haplotype Structure and Phenotype Associations. Nine unique haplotypes could be inferred using available genotype data (Table 3). The most common haplotype was UGT1A6*1A (the reference sequence) representing 40% of total alleles. Two other major haplotypes were identified, including UGT1A6*2 (31% alleles) that incorporated all three cSNPs, the exon 1 synonymous SNP, and four of the six promoter SNPs, and UGT1A6*1B (19% alleles) that included the remaining two of the six promoter SNPs. Together, these three haplotypes accounted for 90% of all alleles identified in the liver bank.
Haplotypes inferred from genetic polymorphism data obtained by sequencing the UGT1A6 exon 1 and 5′-regulatory region in genomic DNA from 54 human livers Haplotypes were inferred using the program PHASE version 2.0.1 (Stephens et al., 2001). n, number of chromosomes evaluated.
For the 54 livers analyzed, 15 different haplotype pairs (diplotypes) could be identified. The most commonly observed diplotypes were*1A/*1B (n = 12), *1A/*2 (n = 10), *1A/*1A (n = 9), *2/*2 (n = 7), and*1B/*2 (n = 5). Remaining diplotypes were only observed in two or fewer livers.
The association of UGT1A6 diplotype with each phenotype parameter were then evaluated by Kruskal-Wallis ANOVA on ranks using data from all livers (Fig. 4, A-D) and also livers that were stratified based on alcohol history. No significant effect of diplotype on serotonin glucuronidation, 4-nitrophenol glucuronidation, UGT1A6 protein, or UGT1A6 mRNA content could be discerned (p > 0.05), regardless of alcohol exposure history.

Influence of liver donor histories of smoking and of alcohol use (>14 drinks per week) on serotonin glucuronidation activities (A), 4-nitrophenol glucuronidation activities (B), UGT1A6 protein content (C), and UGT1A6 mRNA content (D) measured in the same bank of human livers (n = 54). The horizontal bar indicates the median value for each group. Also shown below each graph are the p values for individual factors (smoking and alcohol histories) and the two-factor interaction (smoking × alcohol) obtained using two-way ANOVA on rank transformed data (*, p < 0.05; **, p < 0.01; ***, p < 0.001).

Gene sequence variants identified in the UGT1A6 exon 1 and associated 5′-regulatory region (to -2052 bp) using DNA from 54 human livers. Also shown are the locations of binding sites for known regulatory transcriptional factors that have been identified experimentally (for Ah receptor/aryl hydrocarbon receptor nuclear translocator and Nrf2 (Munzel et al., 1998, 2003) or by computer-based homology analysis (hepatocyte nuclear factor 1α and CAR/PXR; MatInspector; Quandt et al., 1995). Gene position is given relative to the first nucleotide of the predicted UGT1A6 Var 1 translation start codon (nucleotide 108,262 of the GenBank reference sequence NG_002601.1).
Discussion
Previous work in our laboratory indicates that interindividual variability in UGT1A6 expression and function in human liver is considerable with more than 13-fold variation in serotonin glucuronidation and more than 120-fold variation in UGT1A6 protein content with excellent correlation between these parameters (Rs = 0.76). In this study, we have substantially enhanced these findings by showing 13-fold variation in UGT1A6 mRNA content and significant correlations of these values with both glucuronidation activity and protein content (Rs = 0.47 and 0.53, respectively). The cause of the nearly 10-fold higher variation in UGT1A6 protein values compared with UGT1A6 mRNA and glucuronidation activities is presently unclear. The high variability was not simply a consequence of a few outlier points since the distribution of data was relatively continuous, and the ratio of 95th to 5th percentile values was still relatively high (27-versus 7- to 8-fold for mRNA and activities). UGT1A6 protein levels were determined using a semiquantitative immunoblotting method, and so it is feasible that overestimation of the true range of values might have resulted from assay nonlinearity. We did however confirm the linearity of assay response through use of a standard curve constructed using different amounts of recombinant UGT1A6 that resulted in immunoblot band intensities bracketing values obtained for HLMs.
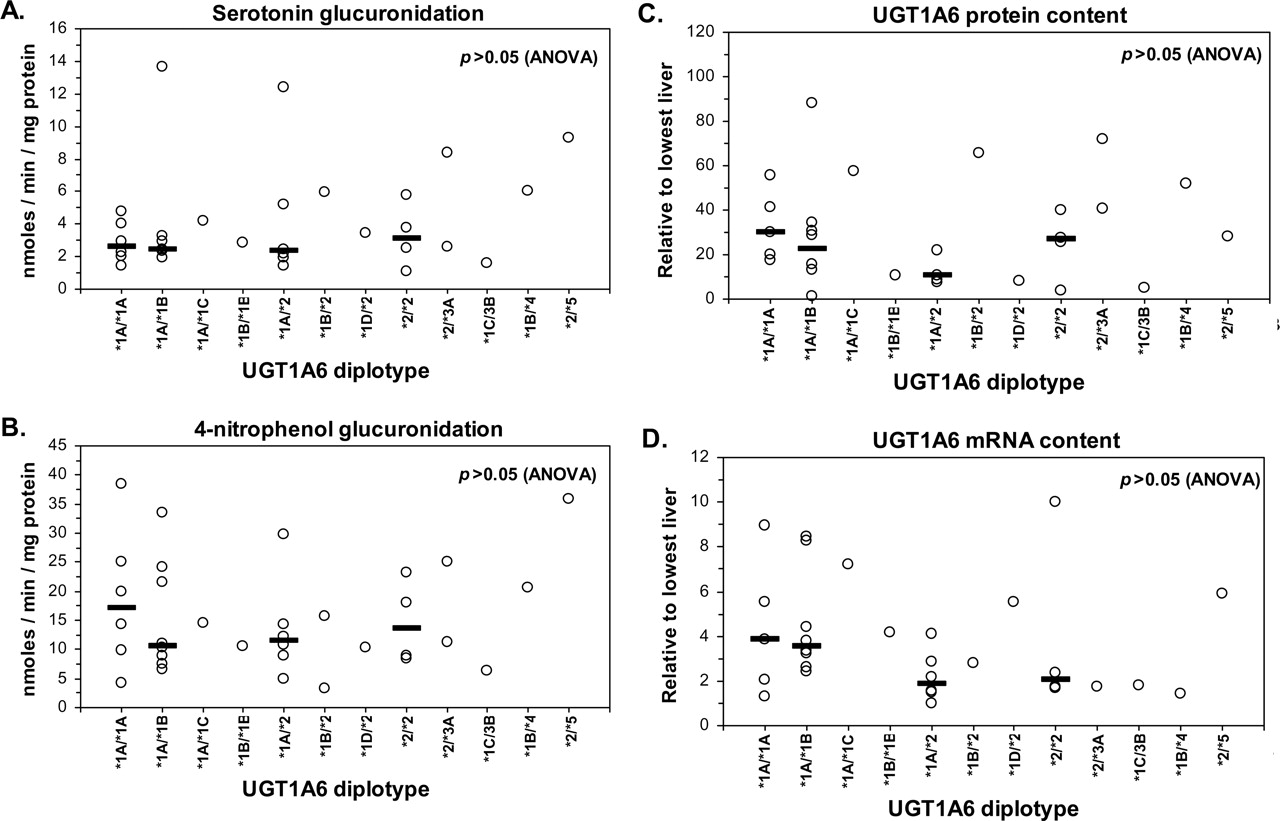
Influence of UGT1A6 diplotype on serotonin glucuronidation (A), 4-nitrophenol glucuronidation (B), UGT1A6 protein content (C), and UGT1A6 mRNA content (D) measured in the same bank of human livers (n = 54). The horizontal bar indicates the median value for each group. No differences between diplotype groups could be detected by Kruskal-Wallis one-way ANOVA on rank transformed data for each set of data (p > 0.05). Similar results were obtained when data were stratified by liver donor alcohol use history.
A significant and novel finding of this study is the association of liver donor alcohol consumption with enhanced UGT1A6 gene expression, as reflected by the substantially higher UGT1A6 mRNA, protein, and glucuronidation activities in donors with a history of consuming 14 or more drinks per week compared with donors with lower or no alcohol consumption. This does not seem to be a nonspecific effect on all glucuronidation enzymes since using the same set of livers we have not previously observed enhanced glucuronidation of S-oxazepam, a specific substrate of UGT2B15 (Court et al., 2002) or of 3′-azidothymidine, a specific substrate for UGT2B7 (Court et al., 2003) in livers exposed to alcohol. However, it should be pointed out that there are limitations in the reliability of such liver donor historical information, and so this finding will need to be confirmed by prospective studies, including use of in vitro induction models (human primary hepatocytes and cell lines) and in vivo studies using UGT specific probe drugs in human volunteers.
Interestingly, we have recently shown that UGT1A6 efficiently and specifically glucuronidates 5-hydroxytryptophol, an endogenous serotonin metabolite that is formed in significantly increased quantities in humans and other animals after alcohol exposure (Krishnaswamy et al., 2004). Consequently, enhanced expression of UGT1A6 (and perhaps other drug-metabolizing enzymes) could be speculated to serve in part to compensate for accumulation of endogenous metabolites resulting from the effects of alcohol. In other work, we have also determined that a positive alcohol exposure history is associated with enhanced cytochrome P450 2B6 mRNA levels in our liver bank (Hesse et al., 2004), suggesting a role for the nuclear receptor CAR, which has also been implicated in the regulation of both CYP2B6 (Wang et al., 2003) and UGT1A6 (Bock et al., 1987).
A review of available literature did not identify any studies that have determined whether chronic alcohol use is associated with enhanced in vivo glucuronidation of UGT1A6 substrates, such as acetaminophen, in human subjects. Alcohol is known to enhance the oxidative metabolism of acetaminophen (by CYP2E1) to the highly reactive metabolite N-acetyl-p-benzoquinone imine, which has been suggested to predispose to liver toxicity (Zimmerman and Maddrey, 1995). The degree of enhancement of N-acetyl-p-benzoquinone imine formation is similar to that which we observed for acetaminophen glucuronidation (less than 2-fold), but may occur more rapidly since the primary mechanism of induction of CYP2E1 is post-translational (Thummel et al., 2000). In good agreement with the results of the present study, cigarette smoking was previously shown in two different studies (Scavone et al., 1990; Miners and Mackenzie, 1991) to have no effect on acetaminophen conjugation in vivo. In contrast, the results of a third study suggested that heavy smoking (>40 cigarettes per day) was associated with higher urinary acetaminophen glucuronide excretion (Bock et al., 1987). However, alcohol is frequently coabused with tobacco, and it is unclear whether there were confounding effects from co-consumption of alcohol.
Our inability to detect an effect of genetic polymorphism (specifically UGT1A6*2) on glucuronidation by HLMs is in good agreement with the study of Peters et al. (2003), but contrasts with that of Nagar et al. (2004). The latter study found 2- to 3-fold higher 4-nitrophenol and 1-napthol glucuronidation in *2/*2 livers compared with both *1/*1 and *1/*2 livers, although it should be pointed out that the number of *2/*2 livers evaluated was relatively small (n = 3). In this study, although we identified more than twice as many *2/*2 livers (n = 7), we did not find any effect of this genotype on serotonin glucuronidation activity. The difference also does not seem to result from the use of the more specific UGT1A6 substrate (serotonin), since we also found no genotype effect on 4-nitrophenol glucuronidation measured in the same livers. Based on evidence presented here and elsewhere (Bock et al., 1987), UGT1A6 is sensitive to environmental influences and so it is possible that the *2/*2 livers identified by Nagar et al. (2004) may have been exposed to such inducing agents. However, it should also be pointed out that Nagar et al. (2004) used a simple colorimetric method to quantitate both 4-nitrophenol and 1-napthol glucuronidation, which is much less specific than the high-performance liquid chromatography method we used in this study.
As far as we are aware, this is the first study to identify genetic polymorphisms in the UGT1A6 5′-regulatory region. A major haplotype block was identified that included three of the 5′-regulatory polymorphisms and the S7A cSNP. This block was associated with 2-fold lower UGT1A6 mRNA in livers without alcohol exposure, suggesting an effect of one of the 5′-polymorphisms on a transcriptional factor binding element. This possibility should be explored in future work through mutational analysis of UGT1A6 promoter-reporter constructs, and by DNA-transcription factor interaction studies.
Interestingly, the -1310 to -1306 deletion variant is predicted to lie within the 5′-untranslated region of a recently identified transcriptional variant of UGT1A6 (UGT1A6 Var 2: GenBank reference sequence NM_205862). This variant was identified by GenBank staff via alignment of high-throughput cDNA and expressed sequence tag sequences with the UGT1A6 gene sequence. It seems to result from use of an alternate promoter site located at approximately -1350 bp, coupled with splicing of a novel 5′-untranslated region (-1329 to -1182 bp) to position +782 bp in exon 1 (Fig. 3). The mature mRNA is predicted to code for a truncated 266 residue protein that lacks the N-terminal aglycone binding domain and is therefore unlikely to be functional as a glucuronosyltransferase. This differs from the rat UGT1A6 transcriptional variant (Auyeung et al., 2003a) in which the alternate 5′-untranslated region is spliced to a position upstream of the normal translation start site and therefore does not affect the UGT1A6 protein sequence.
Although we did not find genetic polymorphisms in the UGT1A6 gene that explained the observed interindividual variability in UGT1A6 mediated glucuronidation, it is likely there are sequence variants in more distal regulatory elements or in the conserved exons (2 to 5) of the UGT1A locus that are worthy of further investigation. In particular, polymorphisms in the conserved UGT1A exons may have the broadest significance considering that these exons are shared by nine distinct UGT isoforms (including UGT1A6) that are expressed in hepatic, as well as renal, gastrointestinal, and other extrahepatic tissues. Such shared polymorphisms would be especially important for the glucuronidation of drugs such as acetaminophen that are known to be metabolized by multiple UGT1A forms, including UGTs 1A1, 1A6, 1A9, and 1A10 (Court et al., 2001).
Footnotes
-
This work was supported by Grants GM-61834, DA-05258, MH-58435, DA-13209, DK-58496, AG-17880, AT-01381, AI-058784, and RR-00054 from the National Institutes of Health and by Department of Pharmacokinetics, Dynamics and Metabolism, Pfizer Global Research and Development (Ann Arbor, MI).
-
Article, publication date, and citation information can be found at http://jpet.aspetjournals.org.
-
doi:10.1124/jpet.104.081950.
-
ABBREVIATIONS: UGT, UDP glucuronosyltransferase; bp, base pair(s); HLM, human liver microsome; PCR, polymerase chain reaction; SNP, single nucleotide polymorphism; PXR, pregnane X receptor; CAR, constitutive androstane receptor; ANOVA, analysis of variance; cSNP, coding single nucleotide polymorphism.
- Received December 7, 2004.
- Accepted March 3, 2005.
- The American Society for Pharmacology and Experimental Therapeutics


