Article Text

Abstract
Objective: To investigate differential intestinal gene expression in patients with ulcerative colitis and in controls.
Design: Genome-wide expression study (41 058 expression sequence tags, 215 biopsies).
Setting: Western General Hospital, Edinburgh, UK, and Genentech, San Francisco, USA.
Patients: 67 patients with ulcerative colitis and 31 control subjects (23 normal subjects and 8 patients with inflamed non-inflammatory bowel disease biopsies).
Interventions: Paired endoscopic biopsies were taken from 5 specific anatomical locations for RNA extraction and histology. The Agilent microarray platform was used and confirmation of results was undertaken by real time polymerase chain reaction and immunohistochemistry.
Results: In healthy control biopsies, cluster analysis showed differences in gene expression between the right and left colon. (χ2 = 25.1, p<0.0001). Developmental genes, homeobox protein A13 (HOXA13), (p = 2.3×10⁻¹⁶), HOXB13 (p<1×10−45), glioma-associated oncogene 1 (GLI1) (p = 4.0×10⁻²⁴), and GLI3 (p = 2.1×10⁻²⁸) primarily drove this separation. When all ulcerative colitis biopsies and control biopsies were compared, 143 sequences had a fold change of >1.5 in the ulcerative colitis biopsies (0.01>p>10−45) and 54 sequences had a fold change of <−1.5 (0.01>p>10−20). Differentially upregulated genes in ulcerative colitis included serum amyloid A1 (SAA1) (p<10−45) the alpha defensins 5 and 6 (DEFA5 and 6) (p = 0.00003 and p = 6.95×10⁻⁷, respectively), matrix metalloproteinase 3 (MMP3) (p = 5.6×10⁻¹⁰) and MMP7 (p = 2.3×10⁻⁷). Increased DEFA5 and 6 expression was further characterised to Paneth cell metaplasia by immunohistochemistry and in situ hybridisation. Sub-analysis of the inflammatory bowel disease 2 (IBD2) and IBD5 loci, and the ATP-binding cassette (ABC) transporter genes revealed a number of differentially regulated genes in the ulcerative colitis biopsies.
Conclusions: Key findings are the expression gradient in the healthy adult colon and the involvement of novel gene families, as well as established candidate genes in the pathogenesis of ulcerative colitis.
Statistics from Altmetric.com
The inflammatory bowel diseases (IBDs), ulcerative colitis and Crohn’s disease, are chronic relapsing inflammatory diseases of the gastrointestinal tract. Both diseases are complex clinical entities that occur in genetically susceptible individuals who are exposed to as yet poorly defined environmental stimuli.1 2
In recent years, the application of non-parametric linkage analyses and well-designed case–control association studies have led to the identification of a number of susceptibility genes or loci strongly associated with Crohn’s disease and ulcerative colitis. In Crohn’s disease, success has been especially evident since the application of genome-wide association studies that have implicated at least 10 novel loci, including the genes encoding interleukin 23R (IL23R), autophagy-related 16-like 1 (ATG16L1) and immunity-related GTPase family, M (IRGM).3–6 Determinants implicated to date in ulcerative colitis include the IBD2 and IBD5 loci, the human leukoryte antigen (HLA) complex, and the multidrug-resistance 1 (MDR1) gene.1 7 These studies all highlight important pathways involved in disease pathogenesis and the emerging challenge now is to move from gene identification to functional understanding.
Microarray expression analysis allow a comprehensive picture of gene expression at the tissue and cellular level, thus helping to understand the underlying patho-physiological processes.8 Earlier studies using microarray platforms to interrogate resection specimens from patients with IBD identified a number of novel genes that were differentially regulated when diseased samples from patients with severe disease were compared to controls.9–11
Subsequently, the ability to use endoscopic pinch mucosal biopsies rather than resection samples has allowed investigators to microarray tissue from a larger range of patients encompassing those with less severe disease.12–15 Whilst these studies have shown consistent differential expression of a number of genes of interest, the data generated also highlight the heterogeneity of different experimental microarray platforms and biopsy collection techniques. As microarray technology has improved still further, data sets have become even more consistent, and the degree of replication between individual arrays and across platforms has increased significantly.16 17
The aims of the current study were to use microarray gene expression analysis to investigate genome-wide expression in endoscopic mucosal biopsies taken at colonoscopy from 67 patients with ulcerative colitis and 31 controls. This represents the largest cohort described to date and particular care has been taken to characterise disease phenotype as well as the anatomical location sampled. Comparisons have been made between gene expression profiles in health and disease, as well as within ulcerative colitis. Thereby, the present data set has allowed us to gain valuable insight into gradients of gene expression along the healthy adult colon, as well as changes associated with disease. The data extend current understanding of gene expression in health, and are complementary to current studies of germline and somatic variation associated with ulcerative colitis.
METHODS
Patients and controls
Sixty-seven patients with ulcerative colitis and 31 control patients undergoing colonoscopy were recruited (table 1). All patients with ulcerative colitis attended the clinic at the Western General Hospital, Edinburgh, and the diagnosis of ulcerative colitis adhered to the criteria given by Lennard-Jones.18 Phenotypic data were collected by interview and case-note review.
Eleven of the controls were men and 20 were women. The median age was 43 years at the time of endoscopy. Six of the controls had normal colonoscopies for colon cancer screening, nine controls had symptoms consistent with irritable bowel syndrome and had a normal colonoscopic investigation and seven patients had a colonoscopy for another indication and histologically normal biopsies were obtained. Eight control patients had abnormal inflamed colonic biopsies (one pseudomembranous colitis, one diverticulitis, one amoebiasis, two microscopic colitis, one eosoinophilic infiltrate, two scattered lymphoid aggregates and a history of gastroenteritis). Written informed consent was obtained from all patients.
Biopsy collection
Paired biopsies were taken from each anatomical location (table 2). One biopsy was sent for histological examination and the other was snap frozen in liquid nitrogen for RNA extraction.
Each biopsy was graded histologically by an experienced gastrointestinal pathologist as having no evidence of inflammation, biopsies with evidence of chronic inflammation and predominately chronic inflammatory cell infiltrate or simply those with acute inflammation and an acute inflammatory cell infiltrate.
Microarray analysis
Total RNA was extracted from each biopsy using the micro total RNA isolation from animal tissues protocol (Qiagen, Valencia, California, USA). One microgram of total RNA was amplified using the Low RNA Input Fluorescent Linear Amplification protocol (Agilent Technologies, Palo Alto, California, USA). A T7 RNA polymerase single round of linear amplification was carried out to incorporate the cyanine-3 and cyanine-5 labels into cRNA. The cRNA was purified using the RNeasy Mini Kit (Qiagen). One mictrolitre of cRNA was quantified using the NanoDrop ND-1000 spectrophotometer (NanoDrop Technologies, Wilmington, Delaware, USA). Seven hundred and fifty nanograms of Universal Human Reference (Stratagene, La Jolla, California, USA) cRNA labelled with cyanine-3 and 750 ng of the test sample cRNA labelled with cyanine-5 were fragmented for 30 min at 60°C before loading onto the Agilent Whole Human Genome microarrays which are annotated to represent 33 296 genes.
The samples were hybridised for 18 h at 60°C with constant rotation. Microarrays were washed, dried and scanned on the Agilent scanner according to the manufacturer’s protocol. Microarray image files were analysed using Agilent’s Feature Extraction software version 7.5. The genes were normalised using the Stratagene Universal Human Reference. The distribution of log intensities for each sample was plotted and outlier samples (ie, greater than 2 standard deviations from the mean) were excluded from analysis. The whole data set is available at Gene Expression Omnibus (http://www.ncbi.nlm.nih.gov/geo/ (accessed 18 July 2008)) accession: GSE11223.
PCR, in situ hybridisation and immunohistochemistry
Methods for real time polymerase chain reaction (PCR), in situ hybridisation for defensin alpha 5, and immunohistochemistry for rabbit anti-human lysozyme and rabbit anti-human defensin alpha 6 are provided in the supplementary methods section.
Data analysis
Microarray data were analysed using the Rosetta Resolver software (Rosetta Inpharmatics, Seattle, WA, USA). Statistical significance of the microarray data was determined by Student’s unpaired t test. A value of p<0.01 and a fold change of greater or less than 1.5 were considered statistically significant. Fold change data were calculated using the Rosetta Resolver software. To correct for multiple hypothesis testing a q-value was calculated for each tested feature to estimate significance in terms of the false discovery rate (FDR) rather than the false positive rate. From the q-values a FDR was calculated using the method proposed by Storey and Tibshirani.19 A FDR of less than 5% was calculated for each of the presented analysis. Gene ontology was analysed using Ingenuity software (Ingenuity Systems, Mountain View, CA, USA). The Mann–Whitney U test was used to analyse the real time PCR data. A value of p<0.05 was considered significant.
RESULTS
Influence of anatomical location on gene expression in the healthy colon and terminal ileum
Unsupervised hierarchical clustering analysis using probes that had a fold change of greater or less than 1.3 were used to interrogate 56 histologically normal biopsies from control patients. Clear separation by anatomical location was observed; on one side of the dendrogram 25/25 biopsies were from the left colon (descending colon or sigmoid colon) whereas on the other side of the dendrogram 20/31 biopsies were from the ascending colon (χ2 = 25.1, p<0.0001) (fig 1). Biopsies from individual patients did not cluster together. The genes driving the differential expression between the right and left colon which were causing the observed clustering were predominately involved in the embryological development of the gastrointestinal tract: homeobox proteins HOXA13, fold change (FC), +4.93, p = 2.3×10⁻¹⁶), HOXB13 (FC, +16.96, p<1×10−45); glioma-associated oncogenes GLI1 (FC, +2.2, p = 4.0×10⁻²⁴) and GLI3 (FC, +2.3, p = 2.1×10⁻²⁸) were all upregulated in the left colon. Sixty-one sequences had a fold change of greater than 1.5 and 44 sequences had a fold change of less than 1.5 in the left colon in the control biopsies. In the ulcerative colitis biopsies when non-inflamed left and right colonic biopsies were compared 26 sequences had greater than a 1.5-fold increase in expression and 21 sequences had less than a −1.5-fold decrease in the left colon.

When gene ontology was compared between these two analyses alternative splicing genes were the most differentially regulated genes in both of the analyses (p = 1.7×10−41 and p = 7.9×10⁻¹⁹ for controls and ulcerative colitis, respectively). In the control analysis the next three most differentially regulated gene groups were nuclear protein function (p = 4.3×10⁻²⁹), metal binding (p = 4.7×10⁻²⁵) and membrane function (p = 4.2×10⁻²⁰). In ulcerative colitis oxido-reductase function (p = 1.4×10⁻¹³) was the second most differentially expressed group followed by mitochondrial function (p = 4.7×10⁻²⁵) and catalytic activity (p = 2.7×10⁻¹¹). There was a 34.5% overlap between the differentially expressed ontology groups in the control and ulcerative colitis analysis.
Analysis of expression in ulcerative colitis and control biopsies
Using unsupervised hierarchical clustering we were unable to differentiate between biopsies from patients with ulcerative colitis and from controls patients. In addition no clustering based on the inflammation status of the biopsies was observed. When all the ulcerative colitis biopsies (129) and control biopsies (73) were compared, 143 sequence probes had a fold change of greater than 1.5 in the ulcerative colitis biopsies (0.01>p>10−45) and 54 sequences had a fold change of less than 1.5 (0.01>p>10−20) (supplementary table 1). Serum amyloid A1 (SAA1) was the most upregulated gene (FC, +8.18, p<10−45). Other notably upregulated genes were the S100 calcium-binding proteins A8 (FC, +3.50, p = 2.3×10⁻¹⁷), S100A9 (FC, +3.06, p = 4.1×10⁻¹³), the alpha defensins, alpha 5 (DEFA5) (FC, +3.25, p = 0.00003), alpha 6 (DEFA6) (FC, +2.18, p = 6.95×10⁻⁷) and the matrix metalloproteinases MMP3 (FC, +2.17, p = 5.6×10⁻¹⁰) and MMP7 (FC, +2.29, p = 2.3×10⁻⁷). The differential gene expression of a number of candidate genes of interest is shown in table 3.
Gene ontology analysis involving the genes differentially expressed between the ulcerative colitis and control biopsies showed a preponderance of differentially expressed genes were involved in immune response (48 genes out of a total of 679 genes classified under immune response, p = 2.1×10⁻⁹, odds ratio (OR) 2.61, confidence interval (CI) 1.85 to 3.56) and response to wounding (30 genes out of a total of 359 genes classified under response to wounding, p = 6.42×10⁻⁹, OR 3.14, CI 2.09 to 4.53) when biological systems were considered.
Analysis of expression in sigmoid colon biopsies in patients with quiescent ulcerative colitis and non-inflamed control biopsies
To compare expression in biopsies without an acute inflammatory signal and to remove the effect of anatomical variation, 22 biopsies from the sigmoid colon with no histological evidence of inflammation from patients with ulcerative colitis were compared to 18 histologically normal control sigmoid colon biopsies. One hundred and two sequences had a fold change greater than 1.5 (0.01>p>4.77×10⁻¹³) and 84 sequences had a fold change of less than 1.5 (0.01>p>1.8×10⁻²¹) (supplementary table 2). Upregulated genes in the ulcerative colitis biopsies included defensin beta 14 (FC, +2.11, p = 0.00002) and SAA1 (FC, +2.01, p = 0.00024). Interesting genes that were downregulated included HLA class II histocompatibility antigen DRB1 (HLA-DRB1) (FC, −3.0, p = 0.0010) and thymic stromal lymphopoietin isoform (TSLP) (FC, −2.73, p = 2.7×10⁻¹⁰) (table 3).
Inflamed versus non-inflamed ulcerative colitis sigmoid colon biopsies
When expression signals were compared between 35 histologically inflamed and 22 non-inflamed sigmoid colon ulcerative colitis biopsies, 700 sequences had a fold change of greater than 1.5 (0.01>p>1×10−45) and 518 sequences (0.01>p>1×10−45) had a fold change of less than 1.5 in the inflamed biopsies (supplementary table 3). Notably upregulated genes included SAA1 (FC, +16.5, p = <10−45), TNFAIP3 interacting protein 3 (TNIP3) (FC, +10.5, p = 1×10−38), DEFA5 (FC, +8.44, p = <10−45), DEFA6 (FC, +6.72, p = 4.16×10⁻¹⁹) and regenerating islet-derived 3 gamma (REG3γ) (FC, +6.99, p = <10−45).
Analysis of specific gene families: alpha defensins 5 and 6
When DEFA5 and DEFA6 were analysed expression in the normal controls and the non-inflamed ulcerative colitis biopsies was similar across the different anatomical locations with there being high expression in the terminal ileum, and expression decreasing as the biopsy location became more distal in the colon (fig 2). In the acute and chronically inflamed ulcerative colitis biopsies there was marked upregulation of DEFA5 and DEFA6 expression in the descending and sigmoid colon (table 3).

ATP-binding cassette transporter family and the xenobiotic-transcription regulators
Expression patterns from probes representing 48 ATP-binding cassette (ABC) transcriptional genes and their key mediators pregnane X receptor (PXR), farnesoid X-activated receptor, and oxysterols receptor LXR-beta were analysed. When these genes were compared in all the ulcerative colitis and control biopsies, seven genes were found to be significantly downregulated in the ulcerative colitis samples when compared to the control samples: ABCA1 (p = 0.01), ABCA8 (p = 0.0064), ABCB1 (p = 0.00091), ABCC6 (p = 0.0050), ABCB7 (p = 0.0068), ABCF1 (p = 0.0005) and ABCF2 (p<0.00001). Only one probe representing ABCB2 was significantly upregulated in ulcerative colitis (p = 0.0048).
ABCB1 expression was also significantly downregulated when inflamed ulcerative colitis sigmoid colon biopsies were compared to non-inflamed ulcerative colitis sigmoid biopsies (FC, −1.82, p = 5.6×10⁻⁶) (table 3). No difference in the expression of PXR between ulcerative colitis and controls was observed in any of the analyses.
Real time polymerase chain reaction analysis
In eight genes implicated by microarray expression results, confirmatory real time PCR analysis was undertaken in biopsies of patients form the original cohort following stratifying to represent a range of SAA1 and IL8 expression. Increased SAA1 expression in the inflamed ulcerative colitis sigmoid colon biopsies compared to the normal control sigmoid colon biopsies and the non-inflamed ulcerative colitis sigmoid colon biopsies (p = 0.041 and p = 0.044, respectively) was observed. Elevated IL8 expression was also confirmed in the inflamed ulcerative colitis sigmoid biopsies when compared to the control sigmoid biopsies (p = 0.031) (supplementary fig 1).
Increased expression of DEFA5 and DEFA6 in the inflamed ulcerative colitis sigmoid colon biopsies when compared to the non-inflamed ulcerative colitis sigmoid colon biopsies (p = 0.0008 and p = 0.0005, respectively) and the control sigmoid colon biopsies (p = 0.0002 and p = 0.0001, respectively) was observed (supplementary fig 1). Increased expression in the inflamed ulcerative colitis sigmoid colon biopsies when compared to the non-inflamed ulcerative colitis sigmoid colon biopsies was also observed when MMP7 (p = 0.0005), S100A8 (p = 0.0029) and toll-like receptor 4 (TLR4) (p = 0.019) were examined (supplementary fig 2).
In situ hybridisation and immunohistochemistry
In situ hybridisation of the terminal ileal biopsies for DEFA5 showed strong hybridisation in the basal crypts consistent with Paneth cell location (fig 3). In the ulcerative colitis biopsies taken from the sigmoid colon strong, multifocal hybridisation in the basal crypt region of these biopsies was observed and this would be consistent with Paneth cell metaplasia. This was not observed in the non-inflamed control biopsies.

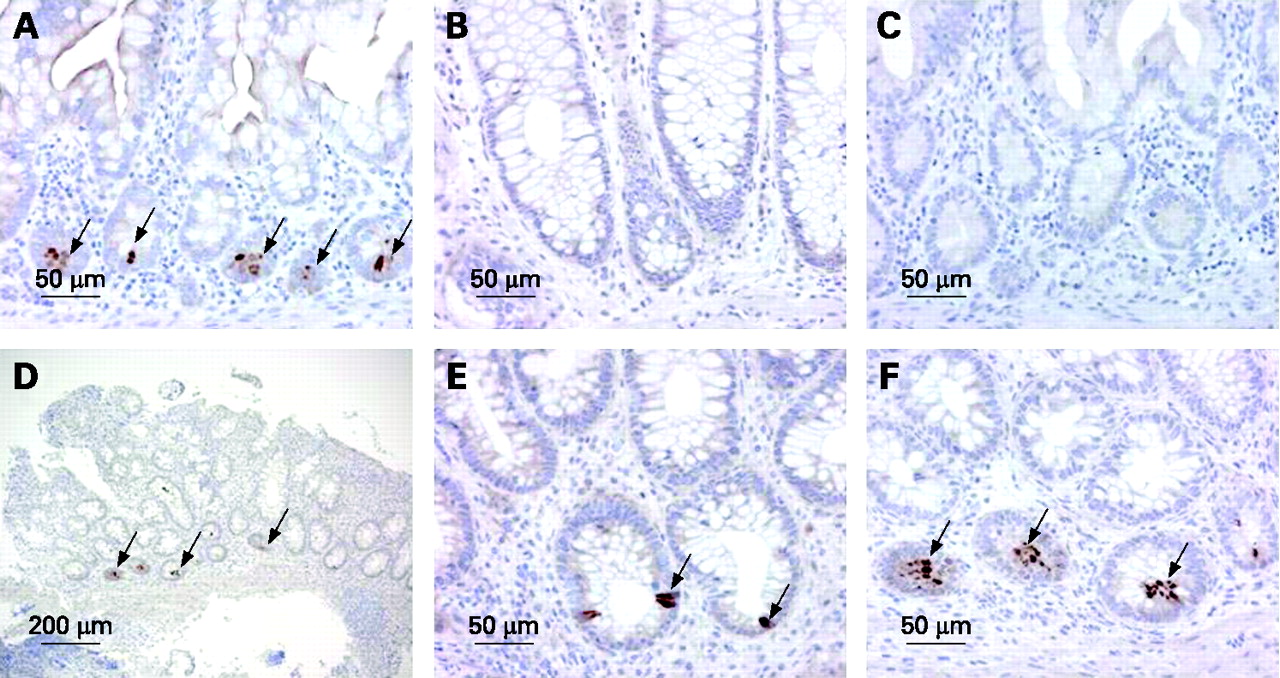
Immunohistochemistry for DEFA6 confirmed that in the sigmoid colon ulcerative colitis biopsies, staining was observed in the basal crypt region of these biopsies consistent with Paneth cell metaplasia. Again, this was not observed in the control biopsies (fig 4).

Expression of genes within the IBD2 locus
Using the markers defining the IBD2 locus we identified 526 Agilent probes representing genes or expressed sequence tags within this locus on chromosome 12. Twelve probes had a greater or less than a 1.5-fold change in expression with p<0.01 when expression of acute and chronically inflamed ulcerative colitis sigmoid colon biopsies were compared to non-inflamed ulcerative colitis sigmoid colon biopsies (table 4).
Expression of genes within the IBD5 locus
Agilent probes representing 11 genes within the IBD5 locus were identified and compared in healthy control, non-inflamed and inflamed ulcerative colitis biopsies (table 5). Solute carrier family 22A5 (SLC22A5) (OCTN2) was downregulated in ulcerative colitis biopsies compared to controls (FC, −1.26 p = 3.37×10⁻⁶) and when inflamed ulcerative colitis sigmoid colon biopsies were compared to non-inflamed ulcerative colitis sigmoid colon biopsies (FC, −1.50, p = 2.2×10⁻⁶).
DISCUSSION
In the present study we have taken particular care to address concerns currently being expressed about micoarray studies in disease. We initially documented the regional variation of gene expression in the healthy colon before undertaking comprehensive studies in ulcerative colitis. By documenting the anatomical location for each biopsy, using appropriate inflammatory controls, as well as avoiding the pooling of samples, we have been able to remove a considerable amount of background variability that has hampered previous studies.17 20–22 A further strength of our study has been the fact that real time PCR analysis consistently confirmed the significant changes in expression, substantially increasing the confidence associated with the interpretation of the data.
We have made a number of novel observations. In the healthy adult colon this is the first microarray study to show a gradient of expression of a number of genes. Genes involved in developmental pathways, the HOX family and the hedgehog signalling pathway, appeared to be the most differentially regulated along the anatomical length of the healthy colon. HOXA13 has been shown to play a crucial role in the development of the tail gut, and mutations in the gene result in urogenital abnormalities,23 and interestingly it has been shown that HOXB13 expression is downregulated in colorectal tumours from the distal left colon.24
GLI1 is one of the major effector molecules of the hedgehog signalling pathway and the GLI1 gene lies within the IBD2 locus, strongly implicated in ulcerative colitis.25–27 Data from the present study would also suggest that GLI1 is downregulated in inflamed ulcerative colitis biopsies compared to non-inflamed biopsies from patients with ulcerative colitis. These data add further weight to data from Cambridge and our own unit showing an association between mutations in the GLI1 gene and ulcerative colitis.28 29
With regards to the observed gradient of expression in the healthy adult colon, our data contrast with data from Costello et al12 and Wu et al15 where no significant differences in expression patterns were observed when comparing biopsies from caecum, transverse colon, descending colon and sigmoid colon. The observed differences in these data sets may be explained by the fact that we have considered only non- inflamed healthy controls in these studies and have not pooled healthy and diseased data. When anatomical variation in the colon was compared between patients with ulcerative colitis and controls there was only a 34.5% homology between the differentially expressed gene ontology groups. This difference may be explained by environmental factors in the ulcerative colitis colon such as microbial dysbiosis.
In ulcerative colitis, we demonstrated dysregulation of genes involved in innate immunity, notably the alpha defensins 5 and 6 together with other pathways currently implicated in inflammatory bowel disease. In our data set high levels of alpha defensin 5 and 6 expression were observed in the terminal ileal biopsies of non-inflamed controls and patients with ulcerative colitis. Levels of expression in these patients fell as the location that the biopsies were retrieved from became more distal in the colon: the ascending colon, descending colon and sigmoid colon. However, in the inflamed ulcerative colitis biopsies increased expression of both alpha defensins 5 and 6 was observed at each anatomical location. Lawrance and colleagues11 also noted that the defensins alpha 5 and 6 were upregulated in patients with ulcerative colitis compared to controls, although RNA was extracted from surgical resections and no details about the anatomical location of these specimens were given.
Recent data published by Varnat and colleagues30 have suggested that peroxisome proliferator activated receptor β (PPARβ) negatively regulates Paneth cell differentiation by downregulating the expression of Indian hedgehog, another of the major effector molecules in the hedgehog signalling pathway. Immunohistochemistry and in situ hybridisation have shown that this is largely mediated by Paneth cell metaplasia. Given our present data now implicating germline GLI1 variation in disease susceptibility, and the regional variation in health, we speculate that in patients with ulcerative colitis, further, as yet undetermined, defects in the hedgehog signalling pathway may result in unregulated Paneth cell differentiation, Paneth cell metaplasia, increased alpha defensin 5 and 6 expression, and mucosal inflammation.
It is of interest that many but not all of our results are broadly in line with two of the landmark microarray papers in IBD. Consistent with data from Lawrance and colleagues11 we have shown upregulation of S100A8 and A9, and the alpha defensins 5 and 6 in ulcerative colitis. Dieckgraefe and colleagues9 observed upregulation of a number of the MMP genes, again seen in our dataset. Another consistent finding was the upregulated expression of members of the REG family in the colon of patients with ulcerative colitis, probably as a result of Paneth cell metaplasia.31
The downregulation of ABCB1 in our dataset is of significant interest, and consistent with earlier microarray data from Langmann et al,13 Dieckgraefe et al,9 Lawrance et al,11 and Wu et al.15 It is pertinent that when the entire class of proteins sharing homology with ABCB1 were analysed, a further six out of 48 ABC transporters were significantly dysregulated in ulcerative colitis, including ABCA1, ABCA8, ABCC6, ABCB7, ABCF1 and ABCF2. An important role of the ABC transporters in the aetiopathogenesis of ulcerative colitis seems likely, supported by these consistent microarray data, association with germline MDR1 variability, and animal data to date.
However, and in contrast to data produced by Langmann et al,13 we did not observe any changes in expression of the transcriptional regulator pregnane-X receptor. These negative data are consistent with genetic studies carried out in the IBD population in Edinburgh; using a haplotype tagging approach, there was an association between the ABCB1 gene and ulcerative colitis,32 but no association between the pregnane-X receptor and ulcerative colitis.33 Aspects of study design and patient recruitment may explain the differences observed between our data and those of Langmann and colleagues.
When novel genes were considered, of particular note was the differential expression of the poorly characterised gene TNFAIP3-interacting protein 3 (TNIP3) which is a nuclear or cytoplasmic protein with three coiled domains that was first pulled down from a yeast-2 hybrid scan of TNFAIP3 (A20).34 The protein has been found to be expressed in macrophages and is upregulated by infection with Listeria. Further to this, TNFAIP3 was recently identified as the closest gene to rs7753394, a “second tier” hit from the UK genome-wide scan in Crohn’s disease, focusing further interest on this nuclear factor κB dependent signalling pathway.3
The tight linkage disequilibrium spanning the IBD5 linkage interval has limited genetic studies of this region.35–39 Consistent downregulation of the organic cation transporter SLC22A5 (OCTN2) was observed in ulcerative colitis biopsies compared to controls and in inflamed ulcerative colitis biopsies compared to non-inflamed biopsies. SL22A4 (OCTN1) was also downregulated in inflamed ulcerative colitis biopsies and these provocative data add weight to the hypothesis that decreased expression of these genes may after all be involved in the pathogenesis of IBD.40 However, we also noted expression of interferon regulatory factor 1 (IRF-1) and PDZ and LIM domain 4 (PDLIM4), both plausible candidates within IBD5 to be dysregulated, emphasising the uncertainties pertaining to this locus at present.
In conclusion, these data provide a rigorously characterised expression profile of the whole genome in the terminal ileum and colon of patients with ulcerative colitis and controls. The studies provide new insights into regional variation of gene expression in the healthy colon, and also considerably extend previous studies in ulcerative colitis. These data also identify a number of key regulators of intestinal inflammation worthy of further study. As further data from genome-wide scanning emerge in this and other complex diseases, access to these data and the ability to study expression, function and germline variation in parallel will become all the more necessary.
REFERENCES
Supplementary materials
web only appendices 57/10/1398
Files in this Data Supplement:
Footnotes
▸ Supplementary figures, tables and methods are published online only at http://gut.bmj.com/content/vol57/issue10
JS and LD are joint senior authors.
Competing interests: None.
Ethics approval: Approval for this study was granted by the Lothian Research Ethics Committee: REC 04/S1103/22.