


Abstract
The transcriptional regulation of drug-metabolizing enzymes and transporters (here collectively referred to as DMEs) in the developing proximal tubule (PT) is not well understood. As in the liver, DME regulation in the PT may be mediated through nuclear receptors, which are thought to “sense” deviations from homeostasis by being activated by ligands, some of which are handled by DMEs, including drug transporters. Systems analysis of transcriptomic data during kidney development predicted a set of upstream transcription factors, including hepatocyte nuclear factor 4α (Hnf4a) and Hnf1a, as well as Nr3c1 (Gr), Nfe2l2 (Nrf2), peroxisome proliferator–activated receptor α (Pparα), and Tp53. Motif analysis of cis-regulatory enhancers further suggested that Hnf4a and Hnf1a are the main transcriptional regulators of DMEs in the PT. Available expression data from tissue-specific Hnf4a knockout tissues revealed that distinct subsets of DMEs were regulated by Hnf4a in a tissue-specific manner. Chromatin immunoprecipitation combined with massively parallel DNA sequencing was performed to characterize the PT-specific binding sites of Hnf4a in rat kidneys at three developmental stages (prenatal, immature, adult), which further supported a major role for Hnf4a in regulating PT gene expression, including DMEs. In ex vivo kidney organ culture, an antagonist of Hnf4a (but not a similar inactive compound) led to predicted changes in DME expression, including among others Fmo1, Cyp2d2, Cyp2d4, Nqo2, as well as organic cation transporters and organic anion transporters Slc22a1 (Oct1), Slc22a2 (Oct2), Slc22a6 (Oat1), Slc22a8 (Oat3), and Slc47a1 (Mate1). Conversely, overexpression of Hnf1a and Hnf4a in primary mouse embryonic fibroblasts, sometimes considered a surrogate for mesenchymal stem cells, induced expression of several of these proximal tubule DMEs, as well as epithelial markers and a PT-enriched brush border marker Ggt1. These cells had organic anion transporter function. Taken together, the data strongly supports a critical role for HNF4a and Hnf1a in the tissue-specific regulation of drug handling and differentiation toward a PT-like cellular identity. We discuss our data in the context of the “remote sensing and signaling hypothesis” (Ahn and Nigam, 2009; Wu et al., 2011).
Introduction
The kidney proximal tubule (PT) is involved in reabsorption of water, electrolytes, and organic solutes, tubular secretion and other processes. Some PT transporters play vital roles in the clearance of many substrates, including some metabolic intermediates, xenobiotics, and environmental toxins. Importantly, they are also responsible for excretion of many commonly administered pharmaceuticals or their metabolites generated by the cohorts of phase I and phase II drug-metabolizing enzymes. Hence, these transporters, which belong to the ABC and SLC gene families, are commonly grouped as Phase III drug transporters.
The phase I and II processes of drug metabolism, which result in chemical modification and conjugation of drugs, respectively, have been mostly studied in hepatocytes. However, a significant number of genes associated with phase I and II reactions are expressed in the kidney, some of which have been shown to serve important functional roles (Lohr et al., 1998; Lash et al., 2008). While much remains to be understood regarding the contribution of genes involved in proximal tubule cell systemic and phase I, phase II, and phase III metabolism, even less is known about the transcriptional regulation of these genes.
Little is understood about how drug-metabolizing enzyme (DME) expression is coordinated in the developing and postnatal PT, in part because many knockout models aimed at studying the kidney experience developmental defects prior to PT formation. The best characterized transcriptional regulator of physiologically relevant transporters in the PT in vivo is hepatocyte nuclear factor 1α (Hnf1a). While still able to form upon complete Hnf1a ablation, the proximal tubule exhibits several transport deficiencies, similar to the characteristics of Fanconi syndrome in humans (Pontoglio et al., 1996). It is possible that expression of phase I and phase II genes was altered as well, but this remains to be studied in detail.
While regulation of the DME repertoire in the PT remains to be explored, we have previously performed a focused study on the regulation of the organic cation transporter Slc22a1 (Oct1), and organic anion transporters Slc22a6 (Oat1) and Slc22a8 (Oat3), in cultured kidney tissues. These transporters are highly enriched in the proximal tubule, where they mediate the rate-limiting uptake step of many drugs and toxins (Nigam et al., 2007; Giacomini et al., 2010; Burckhardt and Burckhardt, 2011; Nigam and Bhatnagar, 2013). They have also been hypothesized to function as part of a larger “remote sensing and signaling” system in whole organism homeostasis (Kaler et al., 2007; Ahn and Nigam, 2009; Wu et al., 2011). We found multiple lines of evidence suggesting that the nuclear receptor hepatocyte nuclear factor 4α (Hnf4a) may be involved in their regulation, which was further supported by detection of Hnf4a binding in rat kidneys at all three promoters in vivo (Gallegos et al., 2012).
Nevertheless, more direct and functional evidence is lacking. In this study, we sought to identify transcriptional regulators involved in the initiation and maturation of DME expression at distinct stages of prenatal and postnatal PT development. Systems analysis of previously published microarray expression data suggested a large role for Hnf4a in regulating phase I and phase II drug-metabolizing enzymes and phase III drug transporters. Based on the important role of genomic enhancer elements in establishing cell-specific expression (Visel et al., 2009; Heinz et al., 2010; Shen et al., 2012), which is in part defined by expression of specific phase I, II, and III genes in the PT, we set out to characterize the genome-wide localization of p300 in adult rat kidney cortex, where proximal tubules make up the dominant cell fraction. Motif analysis of enhancer elements identified Hnf4a and Hnf1a as the major “lineage-determining” factors of the PT.
To gain more insight into Hnf4a-dependent transcriptional regulation during development, we analyzed publically available microarray expression data from five different wild-type and Hnf4a knockout tissues: embryonic liver, embryonic and adult colon, adult small intestine, and adult B-islet cells. All tissues exhibited some degree of differential DME expression as a result of Hnf4a ablation, with liver exhibiting the most severe effects. Hence, to better understand PT-specific role of Hnf4a, we used chromatin immunoprecipitation combined with massively parallel DNA sequencing (ChIP-seq) to determine its binding profile in rat PTs at three progressive stages of PT development: embryonic day 20 (E20), 2 weeks [postnatal day (P)13], and 8 weeks (adult). Hnf4a binding was found to be correlated to levels of DME expression in PTs. A small-molecule antagonist was used to show that Hnf4a regulates key representative phase I, phase II, and phase III genes in ex vivo rat kidney cultures. Finally, lentiviral-mediated transduction of Hnf1a and Hnf4a into mouse embryonic fibroblasts (MEFs) induced the expression of proximal tubule phase I, II, and III genes. Together, these findings reveal the pivotal role of Hnf4a and Hnf1a in coordinating DME expression in the developing and postnatal proximal tubule.
Materials and Methods
Microarray Expression Analysis.
Seven separate analyses were performed: a comparison of embryonic and adult mouse proximal tubule cell expression, a time series of expression in whole rat kidneys, and five comparisons of wild-type and Hnf4a knockout mouse tissues. To compare expression in prenatal and postnatal proximal tubules, we analyzed publically available mRNA expression data from proximal tubules isolated from E15.5 (GSM144594-144595, GSM152247-152249) (Brunskill et al., 2008) and adult mouse kidneys [GSM256959-256961 (Wright et al., 2008), GSM490067-490069]. Time-series data were obtained from a previously published study (Tsigelny et al., 2008) and restricted to genes determined to be enriched in the proximal tubule (Brunskill et al., 2008). To investigate the tissue-specific changes in DME expression upon Hnf4a deletion, the following datasets were analyzed: GSE3126 (E18.5 liver; Battle et al., 2006), GSE3116 (E18.5 colon; Garrison et al., 2006), GSE11759 (adult colon; Darsigny et al., 2009), GSE3124 (adult small intestine), and E-MEXP-1729 (adult isolated B-islet cells; Boj et al., 2010). Microarrays for each of the seven analyses were prepared separately with Genespring 12.5 software using the robust multiarrary average algorithm. Probes were discarded within each analysis group unless they had present flags in more than half of the samples in at least one sample group (E15.5/adult PT, Hnf4a wild-type/knockout tissue) or time point (E13–E21, P0, 1 week, 4 weeks, adult), as determined by the MAS5 algorithm. For the whole rat kidney data, sex chromosome–linked genes were excluded as well. Many genes are represented by more than one probeset; Figs. 1A, 2, and 4A depict differential probeset signal intensities, while Figs. 1, B and C, and 4B consider the average of corresponding probe intensities for each gene. In the comparison of expression in pre- and postnatal proximal tubules, differential expression was defined as having more than a 2-fold change (FC) with P < 0.05 with the Benjamini-Hochberg correction. For pairwise comparisons of wild-type and Hnf4a−/− tissue, it was important to be as inclusive as possible to consider changes from tissues with weaker phenotypes. Thus, the cutoff was lowered to FC > 1.3 with P < 0.05, and no multiple testing correction was applied to increase the solution space. It should be noted that even though all of the five experiments were conducted in mice, two different array platforms were used: Affymetrix (Santa Clara, CA) mouse 430_2 (45,101 probe sets) and mouse 430A (22,690 probe sets). Overall, the 430_2 array is more thorough and has a higher probe/gene ratio. Embryonic colon and small intestine were analyzed using the 430A array; therefore, the differential expression may be underrepresented relative to the other three tissues. To define proximal tubule–enriched gene expression in the kidney during development, a conversion algorithm integrated within GX 12.5 was used to translate probes determined to be enriched in the early mouse proximal tubule to the rat 230 2.0 platform. For network analysis, probe IDs were imported into the Ingenuity Pathway Analysis (IPA) software suite (Ingenuity Systems, Redwood City, CA). Core analysis was conducted using the default settings. Upstream regulators were selected based on molecule type and prediction z-score above 2.0.

DMEs are dynamically regulated in proximal tubule development. (A) Of 297 DMEs expressed in either embryonic (E15.5) or adult mouse proximal tubules, 170 were significantly changing (P < 0.05), at least 2-fold. (B) Expression of IPA-predicted upstream regulators of DMEs in mouse PTs. *Although Hnf1a expression in the proximal tubule is well documented (Lazzaro et al., 1992; Pontoglio et al., 1996; Coffinier et al., 1999), there appeared to be issues with probe sets on the mouse chip; therefore, an expression value (not to scale) has been adopted from another publically available source—the Rat Proximal Tubule Transcriptome Database (http://dir.nhlbi.nih.gov/papers/lkem/pttr/). Car expression was not detected in any of the datasets. (C) Ingenuity Pathway Analysis–predicted network of DME transcriptional regulation in proximal tubule development and maturation.

DMEs contribute to proximal tubule gene expression and cellular identity. While DMEs make up less than 3% of the total annotated genes, DMEs account for over 12% of proximal tubule–enriched gene expression in the rat kidney throughout development (subset of published data; Tsigelny et al., 2008), based on lists of enriched genes in E15.5 mouse proximal tubules, which were adapted from a published study (Brunskill et al., 2008). DMEs are highlighted in green (35/280 genes).
Chromatin Immunoprecipitation.
ChIP was performed as previously described (Gallegos et al., 2012) with some modifications. Isolating proximal tubules from adult kidneys requires enzymatic and mechanical manipulation processes that can alter the native state of proximal tubule cells before the ChIP part of the technique is performed. To preserve the endogenous chromatin landscape of cells, freshly isolated kidneys from unsexed E20, P13 or male adult Sprague Dawley rats—corresponding to the three states of DME regulation in the proximal tubule identified by the developmental time-series analysis in the context of proximal tubule genes—were collected as previously described (Tsigelny et al., 2008) and immediately frozen in liquid nitrogen. To isolate kidney cortex, a frozen whole adult kidney was kept frozen within a ceramic mortar surrounded by dry ice while the outer ∼1 mm was shaved off with a razor. Whole kidneys or isolated cortex were thawed and minced in 1% formaldehyde in phosphate-buffered saline (PBS) on ice, followed by rotation for 15 minutes at room temperature. Fixation was quenched with glycine for 5 minutes. Fixed samples were then homogenized with a tissue grinder, washed twice with cold 0.5% IGEPAL (octylphenoxypolyethoxyethanol) CA-630 (Sigma-Aldrich, St. Louis, MO) in PBS, and further disrupted in the same buffer using a type A glass Dounce homogenizer. Nuclei were pelleted and sonicated on ice (three 5-minute cycles of 30 seconds on/30 seconds off) in ChIP buffer using a Cole-Parmer (Vernon Hills, IL) handheld sonicator. To quantify the chromatin and for use as control samples, “input” samples were prepared from the chromatin by treatment with RNase first and then proteinase K (further decrosslinking overnight at 65°C), phenol extraction, and ethanol precipitation. Concentrations were determined using a NanoDrop 1000 (Thermo Fisher Scientific, Waltham, MA). ChIP for Hnf4a was performed in duplicate using 20 μg of chromatin from E20, P13 and adult whole kidneys and 4 μg antibody (sc-8987; Santa Cruz Biotechnology, Dallas, TX); for p300, 2 μg of chromatin from adult cortex and 10 μg antibody (sc-585; Santa Cruz Biotechnology) was used. A mix of preblocked protein A/G beads was used to recover antibody-bound complexes, which were subsequently washed and eluted with SDS-containing buffer. The DNA was purified from the enriched samples as described above for the input samples.
Massively Parallel Sequencing and Analysis.
Libraries were prepared using the ChIP-Seq DNA Sample Prep Kit (Illumina, Inc., San Diego, CA), using either the pooled duplicates for the ChIP samples or 50 ng for the inputs. Amplified DNA fragments within 200–400 bp long were sequenced using the HiSeq 2000 instrument (Illumina, Inc.) and aligned to the rn4 genome by BIOGEM [Genomics Data Analysis Services, University of California at San Diego (UCSD)] according to the standard Illumina pipeline. All further analysis was performed using the HOMER v3.13 software package (UCSD; Heinz et al., 2010). Clonal reads were removed, and default settings designed for ChIP-seq analysis were used to define and annotate peaks, and calculate measures for quality control. The raw reads and peak files have been deposited in National Center for Biotechnology Information’s Gene Expression Omnibus database under the GEO series accession number GSE50815.
HOMER software was also used to generate files for peak visualization in the UCSC Genome Browser, as well as to calculate overlapping and differentially bound peaks between the four samples. Motif enrichment within promoter-distal peaks was calculated with default settings in HOMER, except the number of background sequences was increased to be over five times higher than the number of peaks.
Organ and Cell Culture.
Kidneys were dissected from E13.5 Sprague Dawley rat embryos and cultured on Transwell filters in Dulbecco’s modified Eagle’s medium (DMEM)/F-12 media supplemented with 10% fetal bovine serum (FBS) and 1% penicillin/streptomycin (Pen/Strep), as previously described (Sweet et al., 2006). Media was changed every 3 days. After 6 days, cultures were treated in triplicate with either 1:1000 dimethylsulfoxide, 2.5 μM and 5 μM Hnf4a antagonist BI6015 [2-methyl-1-(2-methyl-5-nitrophenylsulfonyl)-1H-benzo[d]imidazole; Kiselyuk et al., 2012], or 10 μM analogous inactive compound BI6018 for 12 hours (both kindly provided by Dr. Fred Levine, Sanford Burnham Research Institute). Samples were then stored in RNAlater (Life Technologies, Austin, TX) until further processing for quantitative reverse transcription–polymerase chain reaction (PCR).
MEFs were prepared from E16.5 mouse embryos using a modified version of a previously described method (Sekiya and Suzuki, 2011). Embryonic tissue (excluding CNS and visceral organs) was minced and digested in 0.25% trypsin in DMEM containing DNase I at 37°C in a shaker, and periodically agitated with a pipettor. The resulting suspension was gravity-pelleted for 2 minutes to allow large undigested pieces of tissue to settle. The supernatant was collected, pelleted, and resuspended in L-15 media with 1% Pen/Strep, filtered through several layers of sterile gauze, and then twice through a 40-μm cell strainer. Resulting cells were again pelleted and frozen (in 45% DMEM, 45% FBS, 10% dimethylsulfoxide) for future use. All animal procedures were approved by the Institutional Animal Care and Use Committee.
Immunofluorescence.
Kidney organ cultures were fixed in 4% formaldehyde in PBS at 4°C overnight, and then kept in PBS at 4°C until staining. The filter membrane was cut out from the Transwell, residual glycine was blocked with 50 mM glycine in PBS, followed by blocking in PBS with 10% bovine serum albumin, 0.1% Tween 20 and 0.05% Triton X-100 for 1 hour at room temperature. Samples were then incubated with mouse E-cadherin antibody (Zymed, Cary, NC) in immunohistochemistry buffer (2% bovine serum albumin, 0.1% Tween 20, 0.05% Triton X-100) overnight at 4°C. After three 1-hour washes in immunohistochemistry buffer at room temperature, samples were incubated with anti-mouse Cy5 (Jackson ImmunoResearch, West Grove, PA), rhodamine-conjugated Dolichos biflorus (Vector Laboratories, Burlingame, CA) and DAPI (4′,6-diamidino-2-phenylindole) at 4°C overnight. After three 1-hour washes with 0.1% Tween 20 in PBS, samples were mounted with Fluoromount, sealed, and imaged using a FluoView FV1000 confocal microscope (Olympus, Center Valley, PA).
Lentiviral Transduction.
Lentiviral plasmids pWPI-mHnf4a and pWPI-mHnf1a (Huang et al., 2011) were kindly provided by Dr. Lijian Hui, Shanghai Institute of Biochemistry and Cell Biology. To produce lentiviral vector, FuGENE HD (Promega, Madison, WI) was used to cotransfect human embryonic kidney 293T cells at ∼50% confluency with pWPI-Hnf4a or pWPI-Hnf1a, psPAX2 (Addgene, Cambridge, MA) and pCMV-VSVG (Miyoshi et al., 1998) in DMEM/F-12 media with 10% FBS and 1% Pen/Strep. After 24 hours, media was replaced, then collected at 48 and 72 hours, and kept at –80°C until use. MEFs were plated the day before infection, and infected overnight at ∼40% confluency with media mixed 1:1 with viral supernatant, or 2:1:1 when infecting with both Hnf1a and Hnf4a, in the presence of 8 μg/ml polybrene (Sigma-Aldrich). On the next day, MEF media was replaced with DMEM/F-12 containing 1% FBS, 1% Pen/Strep, 1× Insulin-Transferrin-Selenium (Invitrogen, Carlsbad, CA), 20 ng/ml epidermal growth factor (EGF; R&D Systems, Minneapolis, MN), 4 ng/ml triiodothyronine (Sigma-Aldrich), 20 ng/ml dexamethasone (Sigma-Aldrich), 10 ng/ml cholera toxin (Sigma-Aldrich) for both infected and uninfected cells. For all assays, cells were sampled 3 days after switching the media. Because pWPI includes enhanced green fluorescent protein (EGFP) downstream of the insert, an Accuri C6 flow cytometer (BD Biosciences, San Jose, CA) was used to quantify transduction efficiency. Of the live cells, based on forward and side scatter, ∼70–80% were positive for EGFP.
Quantitative Reverse Transcription PCR.
RNA was extracted from cultured embryonic kidneys and MEF cultures using the RNeasy Micro Kit (Life Technologies, Grand Island, NY), and cDNA was made using SuperScript III FirstStrand Synthesis System (Life Technologies). Real time PCR was carried out using a 3-step cycle on the 7900HT Fast Real-Time PCR System (Life Technologies) with Power SYBR Green Master Mix (Life Technologies). Melt curves were examined to confirm primer specificity. The list of primer sequences is included in Supplemental Table 1.
6-Carboxyfluorescein Uptake Assay.
Uninfected and transduced MEFs were washed with PBS, and incubated in either PBS, PBS with 10 μM 6-carboxyfluorescein (6-CF), or PBS with 10 μM 6-CF and 1 mM probenecid in triplicate at room temperature for 10 minutes. Cells were then washed three times with ice-cold PBS, and levels of fluorescence were measured using a model 1420 Multilabel Counter (PerkinElmer, Waltham, MA). Assays were performed as previously described (Sweet et al., 2006; Nagle et al., 2011).
Results
Curating an Extensive List of Phase I, II, and III Genes.
To begin our analysis of DME transcriptional regulation in the proximal tubule, it was first necessary to define a list of genes potentially involved in phase I, II, or III drug metabolism. We employed several different sources for the purpose of curating such a list (Table 1). For so-called phase I and II enzymes, we first included all of the gene families containing classically accepted DMEs (Aldh, Cyp, Gsta, Sult, Ugt, etc.) (Aleksunes and Klaassen, 2012). To work with the broadest possible list (that may also be relevant to the handling of toxins and endogenous metabolites), additional enzymes were then added either based on their ability to catalyze the same class of reactions that are carried out by known DMEs, or on previous studies (van den Bosch et al., 2007; Lee et al., 2011) suggesting the gene’s involvement in phase I or II reactions. Paralogs and orthologs of known DMEs were included as well. For phase III transporters, we included all members of Abc and Slc transporter subfamilies that include known drug transporters, as classified by the UCSF-FDA TransPortal (Morrissey et al., 2012) (Abcb, Abcc, Abcg, Slc10, Slc21, Slc22, Slc47, Slc51). Some of these transporter family members are associated with metabolite rather than drug handling. However, transporters can typically transport a range of chemical moieties, metabolite handling is commonly reported for classic drug transporters, and many metabolic transporters can bind or transport drugs. Examples of drugs and endogenous substrates are included in Supplemental Table 2. The list of “clinically relevant” DMEs continues to evolve, particularly for nonhepatic tissues; so, at this first stage, we aimed for inclusivity. However, data were collected from multiple species; some gene IDs chosen based on human data may or may not exist as identically named homologs in rodents, and vice versa. Others might exist only in rat or mouse, but not both. The resulting list is summarized in Table 1.
DMEs and transporters
Drug transporters are sometimes also categorized as phase 0 (influx) and phase III (efflux). Here we use the more general classification of phase III that includes all drug transporters.
Analysis of Changes in DME Expression during Pre- and Postnatal Kidney Development Identifies a Set of Potential Transcriptional Regulators.
We sought to determine how the DMEs were transcriptionally regulated throughout pre- and postnatal renal development. Of 455 DMEs (201 phase I, 183 phase II, 71 phase III) annotated on the Mouse 430 2.0 microarray platform, 297 were expressed in either embryonic or adult proximal tubules, of which 159 were significantly changing (P < 0.05) at least 2-fold (Fig. 1A; Supplemental Table 3). Of those 159, 66 belonged to phase I, 71 belonged to phase II, and 22 belonged to phase III. Interestingly, 37 of the 159 changing DMEs were found to be downregulated in adult proximal tubules compared with embryonic kidney, indicating selective regulation of DMEs as opposed to a general increase in expression of “terminal differentiation” genes, as is sometimes assumed to be the case.
The list of 159 significantly changing genes, along with corresponding log ratios, was then analyzed using the IPA software suite. Upon analyzing changes of DME expression in proximal tubules from E15.5 to adulthood, seven upstream transcriptional regulators were predicted to be activated: Hnf4a, Nr3c1 (Gr), Nfe2l2 (Nrf2), Pparα, Hnf1a, Tp53 and Nr1i3 (Car, constitutive androstane receptor). However, the IPA knowledgebase compiles information from multiple tissues, species, and experimental models, which can introduce error in a search for the most likely regulators of gene expression in particular tissue. To help resolve this, we examined the expression of the predicted regulators in E15.5 and adult proximal tubules, shown in Fig. 1B. Multiple studies have reported expression of Hnf1a in the proximal tubule, and deletion of Hnf1a leads to broad defects in proximal tubule transport function in mature animals (Pontoglio et al., 1996). Figure 1C displays these transcription factors in the predicted regulatory network, with their corresponding predicted targets. While the Car nuclear receptor is heavily associated with regulating drug metabolism in the liver, it was omitted from the network because it is not significantly expressed in the kidney. The remaining predicted transcriptional regulators—Tp53, Hnf4a, Nfe2l2, Pparα, Hnf1a, and G—are highly expressed in prenatal and adult proximal tubules. If one further examines the level of connectivity, it is noteworthy that Gr, which is thought to regulate proximal tubule maturation in vivo, and Hnf4a were both connected to 33 predicted targets; this was followed by a decline in connectivity to 26, 22, 18, and 17 for Nfe2l2, Pparα, Hnf1a, and Tp53, respectively.
Analysis of the Proximal Tubule Transcriptome during Developmental Time Points Reveals a Dominant Contribution of DMEs.
Nevertheless, sampling proximal tubule expression at two extremes along the developmental spectrum does not provide sufficient resolution to determine the dynamics of this transition. While proximal tubule expression profiles have not been collected from other time points, a thorough time series of genome-wide expression data has previously been collected from whole rat kidneys at various stages of development (Tsigelny et al., 2008). Although physiologic studies clearly indicate that the proximal tubule is an important site of drug metabolism and transport, due to the many cell types that make up the kidney, it is difficult to attribute the expression profile of widely expressed genes in the whole developing and adult organ to any single cell type. Therefore, we restricted our analysis to proximal tubule–enriched genes, as previously defined (Brunskill et al., 2008). When focusing on DMEs that are enriched in the proximal tubule in the kidney, it became apparent that they are a major contribution to proximal tubule cell gene expression. Even though those DMEs in our classification account for less than 3% of all protein-coding genes, they make up approximately 12% of the total PT-enriched kidney transcriptome (Fig. 2). Furthermore, the dynamics of DME regulation were revealed. Initial induction of DME expression can be seen in late embryonic stages, followed by a surge shortly after birth, and continues to increase into puberty. While it is conceivable that a fraction of the observed increases in transcription might be attributed to a rising fraction of proximal tubule cells, it is important to emphasize that many accepted proximal tubule markers do not change. This suggests regulatory mechanisms independent of cell number. Based on the expression profile of PT-enriched genes, we concluded that three distinct stages minimally describe the transitions in proximal tubule transcription: late embryonic development, postnatal maturation, and adulthood. In mature proximal tubule cells, DMEs are some of the most highly expressed genes. This suggests that transcriptional regulatory mechanisms involved in proximal tubule maturation likely include those playing a key role in the regulation of DMEs.
Motif Analysis of Ep300-Bound cis-Regulatory Elements in the Developing Kidney Suggests Hnf4a and Hnf1a as Key Regulators.
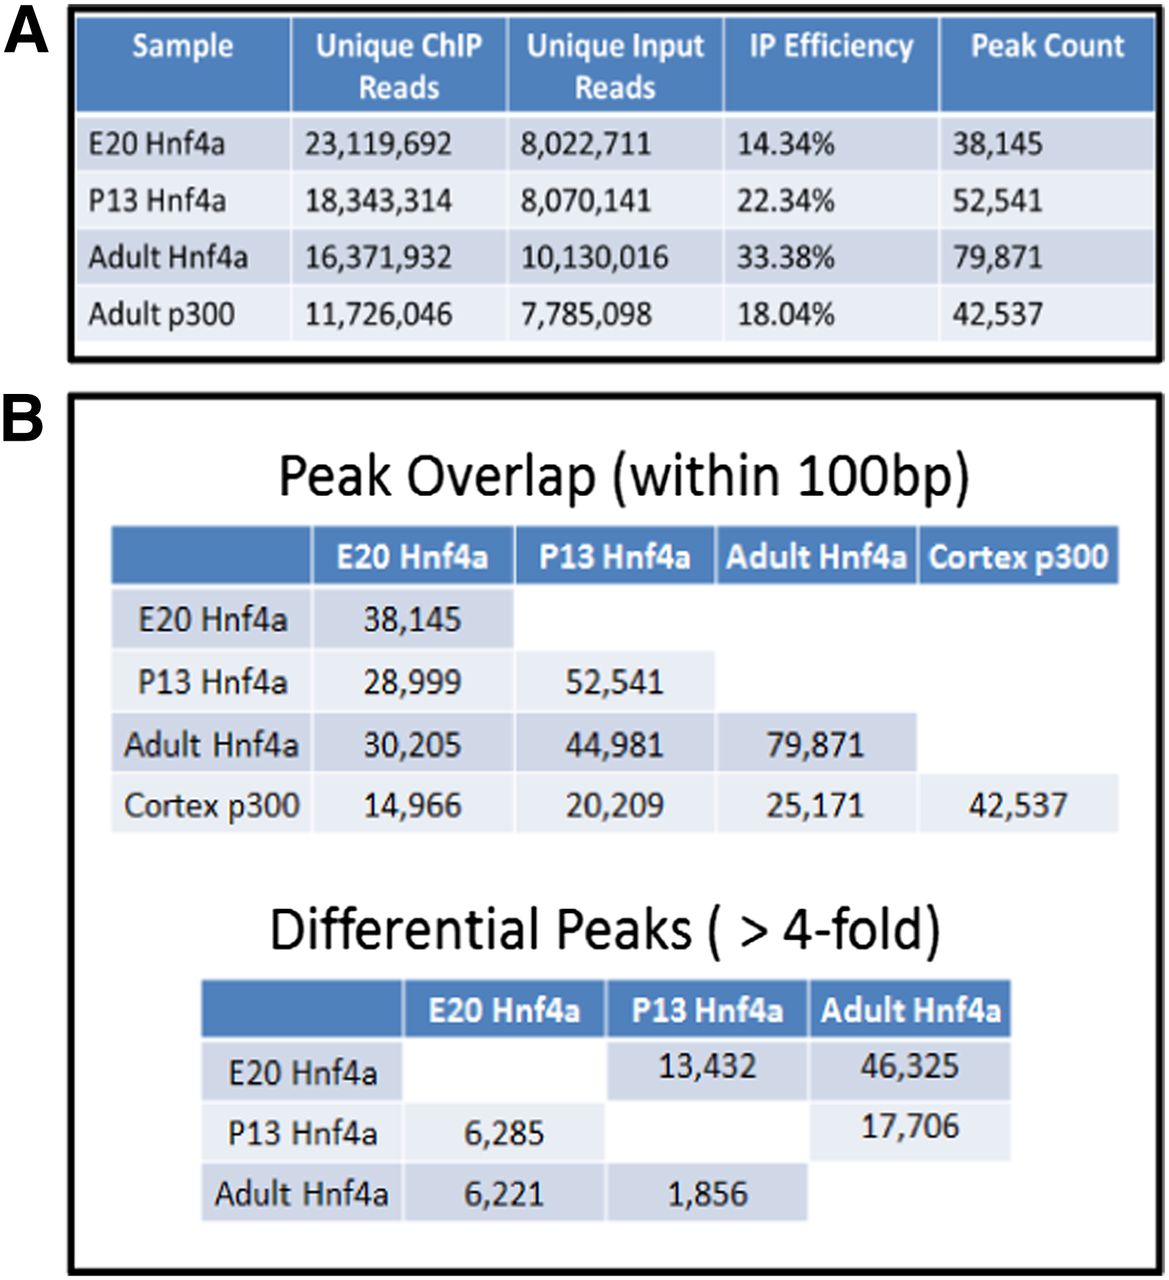
While we had already established a list of top candidate transcriptional regulators of DMEs, we sought to isolate the dominant contributor(s). Recent data from the ENCODE project and other published work indicates that cis-regulatory enhancer elements are key determinants of cell-specific expression, and they are enriched in binding motifs and binding events of transcription factors responsible for lineage determination (Heintzman et al., 2009; Heinz et al., 2010; ENCODE Project Consortium et al., 2012; Shen et al., 2012). Thus, we set out to characterize the colocalization of a known enhancer marker, Ep300, in adult rat proximal tubules using ChIP-sequencing. We obtained high quality data in terms of signal-to-noise and number of peaks; the ChIP-seq yielded 11,726,046 unique mappable positions for p300, and 7,785,098 for the control input sample in the rn4 genome build. Of the mapped reads 18% was contained within highly enriched regions, resulting in 42,537 peaks (Fig. 5A). Of those 20,590 were located in intergenic regions, 14,252 in introns, 906 in exons, and 7439 in promoters [–1000 to +100 bp relative to transcription start site (TSS)]. Based on the literature (Heintzman et al., 2007), this distribution is consistent with expectations of specific p300 marks. Screenshots of representative peaks are displayed in Fig. 3A.

P300 ChIP-seq in adult rat kidney cortex reveals Hnf4a as the top transcriptional regulator in proximal tubules. (A) Screenshots of p300 peaks (tags per bp normalized to input). P300 is highly enriched at the Oat1, Oat3, and Mate1 loci, three highly expressed drug transporters specific to the proximal tubule in the kidney. Aldh3a2, which is expressed in the PT, had a strong peak at the promoter; conversely, Aldh3a1 and Mate2, which are not expressed in the PT, exhibited minimal p300 colocalization. There were multiple peaks at the Hnf1a locus, but none at Nr1i3, which is consistent with the finding that Hnf1a but not Car is expressed in the PT (Fig. 1B). (B) Motif analysis of promoter-distal p300 peaks revealed that the two most highly enriched transcription factor binding motifs matched those of Hnf4a and Hnf1a. The motif for the ubiquitous insulator CTCF (CCCTC-binding factor) was also enriched around p300 binding sites, which is consistent with previous studies.
Ep300 cannot directly bind DNA; rather, it enhances transcription by interacting with DNA-bound transcription factors. Thus, the detected binding sites are contingent on the presence of recruiting transcription factors. We used the HOMER software, which has previously been effectively used to identify functional motifs (Heinz et al., 2010), to perform motif analysis on 34,034 “distal” enhancers, defined by peaks located more than 1 kb upstream and 500 bp downstream of annotated TSSs. Consistent with our earlier pathway analysis, the HOMER software determined that the most highly enriched de novo motif best matched the known binding motif for Hnf4a (Fig. 3B). The second most enriched motif was the target sequence for Ctcf, an insulator protein that helps establish chromatin architecture. This finding of Ctcf agrees with previous studies, which found CTCF enrichment at enhancers (Shen et al., 2012) and DNase I hypersensitive sites (Xi et al., 2007). Interestingly, the third most enriched motif matched the known Hnf1a motif, a known regulator of proximal tubule cell identity. As already mentioned, the contribution of Hnf1a to mature proximal tubule function has been previously examined in a mouse knockout model, but the role of Hnf4a and Hnf1a in the developing proximal tubule, especially with respect to DME regulation, is not well understood.
Transcriptomic Analysis of Microarray Data from Hnf4a Tissue-Specific Knockouts Revealed That Distinct Subsets of Phase I, II, and III Genes Were Affected in Developing Liver, Colon, Intestine, and Pancreas.
There is no mouse model with a kidney-specific deletion of Hnf4a; this may reflect a role very early in kidney development (prior to proximal tubule morphogenesis) (Kanazawa et al., 2010), in addition to the later postnatal role in proximal tubule DME regulation that we have focused on here. Nevertheless, this nuclear receptor has been deleted in five other developing and mature tissues; the knockout tissue has been subjected to microarray analysis. Together, these tissues express most of the DMEs from our original curated list. Therefore, it is possible to determine which of the DMEs has direct or indirect regulation of its expression by Hnf4a; to the extent that these DMEs overlap with the set identified above in the developing proximal tubule of the kidney, it may be possible to infer a high probability of transcriptional regulation by Hnf4a in the kidney.
To this end, we analyzed the published microarray expression data from five tissues with specific Hnf4a knockout models: E18.5 liver (Battle et al., 2006), E18.5 colon (Garrison et al., 2006), adult colon (Darsigny et al., 2009), adult small intestine, and adult isolated B-islet cells (Boj et al., 2010). Of note, the consequence of deletion of Hnf4a has varying effects on the different tissues. Hnf4a is required for epithelialization and functional differentiation of hepatocytes; as a result, the consequences of removing this gene in the liver are severe, leading to embryonic lethality. The differentiation and function of the colonic epithelium is altered, but this does not prevent the animal from reaching adulthood. While the small intestine also expresses Hnf4a, its deletion apparently has minimal morphologic consequences (Babeu et al., 2009). Finally, B-islet cells lacking Hnf4a exhibit mild phenotypic and functional consequences, despite marked differences in the transcriptome.
We compared Hnf4a−/− tissues to matched wild-type samples and identified significantly changing (P < 0.05, FC > 1.3) probe sets in each tissue (Fig. 4A). We then assembled a list of DMEs that were differentially expressed as a result of Hnf4a deletion in at least one tissue. The list includes 203 regulated DMEs (96 phase I enzymes, 79 phase II enzymes, and 28 phase III transporters). Liver experienced the most changes in DME expression, followed by adult colon, B islets, small intestine, and embryonic colon, respectively. Of note, 156 of the 203 DMEs downstream of Hnf4a regulation in at least one knockout tissue are expressed in either embryonic or adult mouse proximal tubules, and they thus represent a group of DMEs potentially regulated in the proximal tubule by Hnf4a under either basal or stimulated conditions [Fig. 4B; Supplemental Table 4 (detailed view of Fig. 4B)].

Hnf4a is highly involved in tissue-specific expression of DMEs. (A) Comparison of significantly changing (FC > 1.3, P < 0.05 using uncorrected t test) probe sets in four tissues (E18.5 liver, E18.5 colon, adult colon, adult B-islet cells) with conditional Hnf4a deletion. (B) Heatmap of significantly changing DME genes from same four tissues in A, in addition to small intestine, matched to expression levels in embryonic and adult mouse proximal tubules. Rows are color-coded for phase I, II, and III with yellow, green, and blue, respectively, and split into those expressed in the pre- and/or postnatal PT (top) and those that are not expressed in the PT (bottom). Their corresponding expression in E15.5 and adult PTs is shown on the left (red, high expression; light, low expression; white, not detected). Genes are sorted within phase I, II, and III groups by expression levels in adult proximal tubules. To the right, differential expression in corresponding tissues is depicted. Of 203 differentially expressed DMEs 156 were found to be expressed in proximal tubules. The detailed list is included in Supplemental Table 4.
Interestingly, not a single DME gene was significantly changing in more than three tissues. In most cases, genes affected in more than one tissue were changing in the same direction. However, there are examples of the same gene being regulated in opposite directions in different tissues. Of the 203 affected DMEs, 12 changed in three tissues, 47 in two, and 144 were specifically regulated in a single tissue. On the other hand, expression of related gene family members in different tissues was frequently observed. These findings further supported an important role for Hnf4a in transcriptional regulation of DMEs in specific tissues during development, as well as in mature tissues. However, based on the large divergence of affected downstream targets, Hnf4a-mediated regulation appears to highly depend on cellular context.
Hnf4a Plays a Major Role in Establishing and Maintaining Transcriptional Enhancer Elements That Regulate DME Genes in the Proximal Tubule.
To gain more insight into proximal tubule–specific regulation, we used ChIP-seq to determine the colocalization of Hnf4a in rat proximal tubule cells at the three earlier-identified stages—prenatal differentiation, maturation, and adulthood. To represent these transitions, we selected the following three time points: 20 days postcoitum (E20), 2 weeks (P13), and 8 weeks (adult). By E20, late differentiation events are occurring, although new nephrons are still being formed; importantly, at this time point, the kidney is naïve to the influences of birth and the extrauterine environment. At P13, new nephrons are no longer being formed (Larsson, 1975), but the transcriptional profile or functional capacity has not yet reached mature levels (Sweeney et al., 2011). Finally, the proximal tubule reaches maturity after puberty, which occurs around 4–6 weeks in rodents. In the kidney, Hnf4a expression has been reported in condensed mesenchyme (Kanazawa et al., 2010), and in segments of nephron progenitor structures throughout all of nephrogenesis (Kanazawa et al., 2009), though ultimately its expression becomes restricted to the proximal tubule. Thus, even when using chromatin prepared from the entire population of kidney cells, Hnf4a-binding can be attributed to Hnf4a-expressing cells.
Figure 5A quantifies general results of Hnf4a ChIP-seq, along with the p300 data. At E20, Hnf4a occupancy was detected at 38,145 sites, revealing robust activity during late embryogenesis. During maturation, at P13, Hnf4a was detected at 52,541 locations. In mature proximal tubules, 79,871 sites containing Hnf4a were found (Fig. 5A). Thus, the number of Hnf4a binding locations in proximal tubules more than doubles from initial differentiation to maturity. Subsequently, Hnf4a-mediated transcriptional regulation is expected to change as a result of gained or lost binding events. Figure 6 shows representative screenshots of binding events and peak overlap from all four ChIP-seq experiments. Perhaps one of the most striking findings was the high level Hnf4a and p300 colocalization (Fig. 5B). At E20, 14,966 Hnf4a peaks, 39% of all peaks, were at locations that are occupied by p300 in mature proximal tubules. At P13, the number goes up to 20,209, or 38% of total Hnf4a peaks at this age. Finally, in the adult, 25,171 Hnf4a-binding locations, or 32% of all peaks, are co-occupied by p300. This suggests that Hnf4a might directly recruit p300, thus establishing cis-regulatory enhancer elements. Furthermore, the high level of Hnf4a-containing enhancer elements in adult proximal tubules implies a large role for Hnf4a in establishing gene expression profiles in these cells, exemplified by a specific DME repertoire.

Quantitation and characterization of ChIP-seq reads. (A) General measures of ChIP-seq data. (B) Pairwise quantitation of overlapping peaks between all four ChIP experiments (top), as well as differentially bound Hnf4a peaks with higher signal (without input normalization) in column relative to row (bottom).

Hnf4a regulates PT gene expression throughout kidney development and maturation. (A) Screenshots of peaks from all four ChIP-seq experiments. Oat1 and Oat3, two major drug transporters in the proximal tubule, accumulate Hnf4a binding events throughout development. While there was minimal colocalization of Hnf4a and p300 at the Pparγ (Pparg) locus, there were multiple binding events associated with Pparα (Ppara), which was implicated in Fig. 1C as a regulator of DME expression in the PT. (B) Schematic representing the overlap of all possible combinations of peaks. (C) Proportionally-scaled heatmap of tag densities of five representative subcategories highlighted in Fig. 5B.
We also examined differential binding of Hnf4a at the three developmental stages (prenatal, postnatal, adult). Peak overlap is one possible approach; however, this fails to differentiate between significant changes and borderline differences that affect peak calling. Instead, we identified peaks with at least 4-fold changes in tag density at different time points (Fig. 5B). Of 38,145 peaks present at E20, 6285 were significantly downregulated or completely lost by P13. Conversely, only 1856 of 52,541 peaks present at P13 were downregulated/absent in adult proximal tubules. Both transitions experienced comparable numbers of upregulated Hnf4a occupancy, with 13,432 upregulated sites from E20 to P13, and 17,706 upregulated sites from P13 to adult (Fig. 5B). Interestingly, motif analysis of Hnf4a peaks revealed that Hnf1a binding motifs were enriched at Hnf4a binding sites in P13 and adult proximal tubules, but not at E20 (data not shown).
Thus, there are substantial changes in Hnf4a binding during pre- and postnatal development. Based on Hnf4a occupancy throughout proximal tubule development and maturation, it is clear that it plays important roles in regulation of the proximal tubule transcriptome. We then focused in on peaks near or within DMEs, which are likely to regulate that locus. We found that most of the expressed DMEs were bound by Hnf4a near or within the genes, many of which contained peaks near the TSS. While there was a notable degree of differential binding, it was more common to see peaks that were present at E20 become more enriched and formation of new peaks as proximal tubule cells mature.
Part of Hnf4a-mediated regulation of DMEs in the proximal tubule may depend on exerting specific effects on other DME transcriptional regulators, rather than directly targeting DMEs. It appears that this is plausible—based on Hnf4a binding at relevant nuclear receptors. Very high Hnf4a enrichment was observed along the Pparα gene locus, a nuclear receptor predicted earlier (Fig. 1) to regulate a subset of DMEs in the PT. In contrast, Pparγ had a very low number of binding events, consistent with lack of expression (Fig. 6A). An interesting observation was a modest presence of Hnf4a colocalization around genes that are not basally expressed in the proximal tubule, sometimes even directly at the promoter. Conversely, all predicted DME transcriptional regulators included in Fig. 1 had high Hnf4a enrichment at multiple sites, often including the promoter.
Administration of an Hnf4a Small-Molecule Antagonist in an Ex Vivo Kidney Organ Culture Model Markedly Attenuated the Expression of Representative Phase I, II, and III DMEs.
Our findings support the view that Hnf4a plays an important role in transcriptional regulation of DMEs during kidney differentiation and maturation. There is currently no reported mouse model with kidney-specific ablation of Hnf4a to test this in vivo. Instead, we used a recently developed small-molecule compound that specifically antagonizes Hnf4a activity (Kiselyuk et al., 2012). With this compound, we tested the effect of Hnf4a downregulation in embryonic kidney organ culture (grown for 6.5 days to allow nascent PT formation), which recapitulates many characteristics of proximal tubule differentiation, including the acquisition of organic anion transport mediated by Oat1 and Oat3 (Sweet et al., 2006; Truong et al., 2008). Based on in vitro and in vivo knockout data, this is generally believed to be the main pathway for kidney elimination of many common drugs (e.g., antibiotics, antivirals, diuretics, nonsteroidal anti-inflammatory drugs) and toxins (e.g., mercury conjugates) (VanWert et al., 2010; Torres et al., 2011). This pathway has received increased attention given new FDA guidelines, and its role in neonatal drug handling is of considerable interest.
Hnf4a inhibition in kidney culture caused differential expression, mainly (but not exclusively) downregulation, of many representative phase I, II, and III drug-metabolizing genes (Fig. 7). Targets were selected based on exhibition of PT-specific expression in the kidney (Fig. 2), known expression in embryonic proximal tubules, presence of Hnf4a binding near or within the gene, and in some cases because they were regulated by Hnf4a in other tissues (Fig. 4). Some genes exhibited a dose-dependent effect in downregulation, while expression of others was maximally downregulated with the lower antagonist concentration, without further decrease at a higher concentration. Of the genes tested, several did not change or were upregulated, indicating that the antagonist had a selective effect on only a certain subset of PT DMEs, presumably those regulated by Hnf4a. This role of Hnf4a was further explored below by lentiviral transduction into cells.

Antagonism of Hnf4a in embryonic rat kidney culture leads to differential effects on phase I, II, and III DMEs. E13.5 rat kidneys were cultured on Transwell filters for 6.5 days, and treated with a small-molecule antagonist of Hnf4a or an analogous inactivated compound for 12 hours. (A) Schematic of embryonic kidney culture on Transwell filters. (B) Example of embryonic kidney cultured for 7 days (red, D. biflorus; green, E-cadherin; blue, DAPI). (C) Changes in expression in whole rat embryonic kidneys in response to Hnf4a inhibition with a small molecule antagonist, relative to treatment with carrier alone (dimethylsulfoxide).
Overexpression of Hnf1a and Hnf4a in Mouse Embryonic Fibroblasts Induces Expression of Proximal Tubule Phase I, II, and III DMEs.
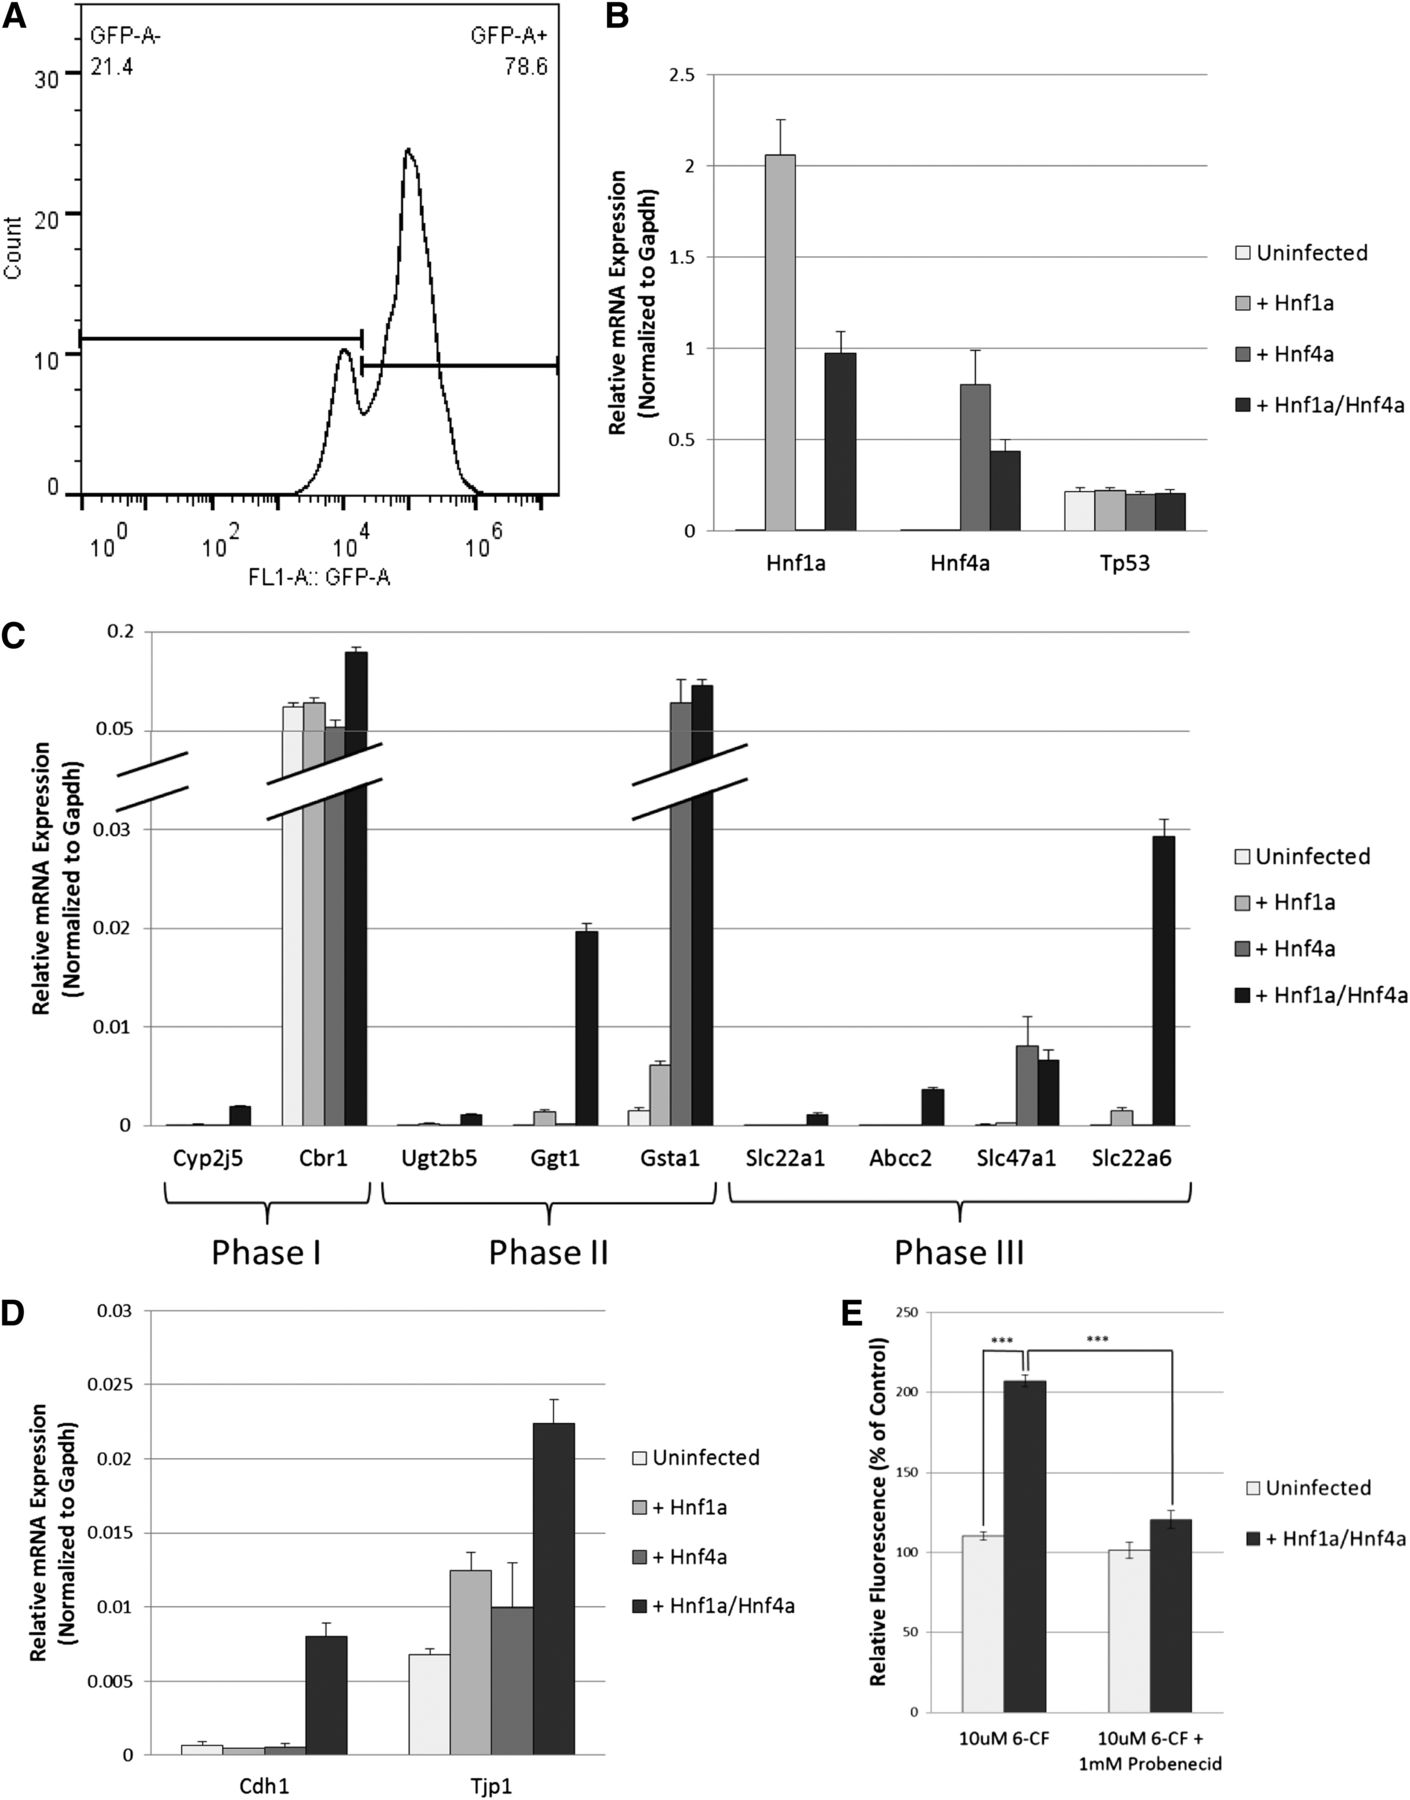
To further explore the role of Hnf4a, and the most highly associated coregulator, Hnf1a, we examined the capacity of these factors to induce expression of DMEs highly expressed in the proximal tubule in MEFs. Using lentiviral transduction, mouse Hnf1a and Hnf4a cDNA with downstream EGFP were introduced either individually or in combination into primary fibroblasts derived from E16.5 mouse embryos. Approximately 75% transduction efficiency was routinely achieved (Fig. 8A). As shown in Fig. 8B, transduction of Hnf1a did not induce expression of endogenous Hnf4a, or vice versa; however, both genes are expressed within the cell population upon transduction of both factors. Unaltered expression of p53 suggests the lack of apoptotic response from the genomic integrations or overexpressed proteins. As can be seen in Fig. 8, C and D, expression of a limited number of DMEs and epithelial markers [E-cadherin (Cdh1) and Tight junction protein 1 (Tjp1)] was induced to different extents by Hnf1a or Hnf4a alone. Importantly, expression of many genes was dependent on the presence of both Hnf4a and Hnf1a. We then sought to determine if the function of some genes relevant to drug metabolism by the proximal tubule upon transduction of Hnf1a and Hnf4a was consistent with their mRNA expression. To this end, we examined the ability of transduced MEFs to take up 6-carboxyfluorescein in a probenecid-sensitive manner, which is a classic indicator of Slc22a6 (Oat1) function. Oat1 is one of the major drug, toxin, and metabolite transporters in the developing and mature proximal tubule (Lopez-Nieto et al., 1997; Eraly et al., 2006, 2008; Ahn and Nigam, 2009; Wu et al., 2011). As shown in Fig. 8E, upon expression of Hnf1a and Hnf4a, transduced MEFs gained the ability to accumulate 6-CF through a function-specific transport mechanism (via Oat1). Although the bulk of the evidence suggests that the MEFs differentiated toward PT-like cells, without an exhaustive analysis of other tissue markers, we cannot exclude the possibility of characteristics overlapping with other cell types expressing Hnf4a and Hnf1a.

Hnf4a and Hnf1a induce expression of proximal tubule DMEs. (A) Flow cytometry was used to quantify transduction efficiency, which was routinely around 70–80% as judged by the fraction of green fluorescent protein (GFP+) live cells. (B) Uninfected cells do not express Hnf1a or Hnf4a, while lentiviral transduction leads to expression of the respective genes. Unaltered p53 expression levels indicate lack of toxicity and apoptotic response. (C) Phase I, II, and III genes expressed specifically in the proximal tubule are strongly induced upon expression of Hnf1a and Hnf4a in combination. (D) Hnf1a and Hnf4a upregulate expression of epithelial markers Cdh1 and Tjp1. (E) Slc22a6 exhibits function in transduced MEFs, as indicated by probenecid-sensitive uptake of organic anion 6-carboxyfluorescein.
Discussion
Even in such a well-studied organ as the liver, the developmental maturation of drug handling and metabolism—which depends on phase I and phase II enzymes, as well as phase III transporters—remains incompletely understood. Even less is known about other developing organs, including the kidney. To properly dose neonates and children, and to diminish adverse effects from drugs and environmental toxins, it is important to understand the molecular basis of drug and toxin handling. In this study, we have combined systems-, molecular-, and cellular-biology approaches to show that Hnf1a and Hnf4a cooperate to play a major role in the transcriptional initiation and maturation of genes in the developing and postnatal proximal tubule involved in phase I, II, and III drug metabolism.
To approach the problem of prenatal and postnatal proximal tubule maturation, we began with a broad approach, employing microarray data to study a broadly defined set of DMEs (Table 1) in the context of proximal tubule expression. Network analysis of transcriptional profiles of DMEs in nascent and mature mouse proximal tubules suggested roles for a small set of transcription factors that may be orchestrating the expression of phase I, II, and III genes in the proximal tubule (Fig. 1C). Further analysis of a time-series of expression in rat kidneys not only defined the dynamics of DME expression but revealed a significant role of DMEs in defining the proximal tubule–specific transcriptome in the kidney. This finding suggested that lineage-determining factors associated with PT-specific enhancers on a global scale would likely regulate expression of DMEs.
In our studies, transcription factor motifs present in enhancer regions marked by p300 suggested that Hnf4a, along with Hnf1a—a known transcriptional regulator of proximal tubule function (Pontoglio et al., 1996), might be the major regulators of PT expression of DMEs. We chose p300 over histone modifications to characterize enhancers due to two main advantages: 1) p300 cannot bind DNA directly, thus peaks represent presence of DNA-binding factors that recruited p300; 2) p300 peaks are more localized than histone modification, facilitating recognition of binding motifs of responsible targeting factors. Nevertheless, it is possible that additional information could be gained by examining other enhancer elements that lack p300 colocalization in future studies, which may offer additional clues regarding the contribution of other transcription factors, potentially including those identified in Fig. 1C.
Although there is good evidence that HNF4a can regulate transcription of a number of DMEs in the liver, there has been little direct evidence of this in the PT. A kidney-specific knockout has not been reported thus far, possibly because of an early defect in nephrogenesis that precedes PT differentiation (Kanazawa et al., 2010). Nevertheless, by restricting the list of targets downstream of Hnf4a in other tissues to those expressed in the prenatal or mature PT, we were able to suggest a subset of DMEs that are potentially basally or constitutively regulated by HNF4a in the proximal tubule (Fig. 4B; Supplemental Table 4). This subset had many phase I, II, and III genes known to carry out important reactions involved in drug metabolism. However, while many of these genes are likely to be regulated by Hnf4a in the PT, Fig. 4A shows that a substantial portion of targets are regulated in only a single tissue. Furthermore, it is important to note that some very important DMEs expressed in the PT fail to be detected by expression microarrays in these other tissues, such as Oat1and Oat3.
Given the evidence strongly suggesting that Hnf4a might be playing a critical role in DME regulation in the proximal tubule, and the tissue-specific nature of this regulation, we decided to characterize the genome-wide colocalization of Hnf4a in the developing kidney in vivo at three distinct developmental stages—prenatal differentiation, postnatal maturation, and adulthood. The time points chosen to represent these stages (E20, P13, and adult) were chosen mainly based on analysis shown in Fig. 2. However, the selection of time points was also supported by prior analysis of time-series microarray expression data from developing and adult kidneys (Tsigelny et al., 2008), as well as functional correlations such as the in vivo ability to transport classic organic anion substrates such as para-aminohippurate, which may be viewed as a surrogate for the capacity of the kidney to eliminate drugs and toxins by the Oat1 transporter (Sweeney et al., 2011).
As mentioned, it has been previously shown that Hnf4a plays a key role in morphogenesis during kidney development—cap mesenchyme survival (Kanazawa et al., 2010)—which occurs far before the differentiation and development of the PT; the role of Hnf4a in the maturation of the proximal tubule during late prenatal and postnatal development remained poorly defined. By using a recently developed small-molecule antagonist which has been shown to selectively inhibit Hnf4a (Kiselyuk et al., 2012), we were able to explore the consequences of Hnf4a downregulation in early proximal tubules in 7-day organ culture, which serves as a model for kidney development. These have been shown to express Slc22 transporters such as Oat1 and Oat3 and eventually become capable of organic anion transport function (Sweet et al., 2006). As predicted, Hnf4a inhibition by the compound (but not a structurally similar inactive compound) resulted in markedly diminished expression of important phase I, II, and III DMEs, including Oat1 and Oat3, suggesting that Hnf4a is required to maintain basal expression of many functionally important DMEs in the PT. Expression of a small group of DMEs, however, was unchanged or upregulated in response to the Hnf4a antagonist, potentially indicating reversal of Hnf4a-mediated repression. These experiments supported a key role for DME regulation by Hnf4a in the whole organ culture. Nevertheless, we also sought to prove this directly by lentiviral transduction of Hnf4a and Hnf1a into MEFs.
Overexpression of Hnf1a and Hnf4a in MEFs provided the final clues to help postulate a working model for the role of Hnf4a in the transcriptional regulation of PT development and function. For all of the tested genes aside from Gsta1 and Slc47a1 (Mate1), Hnf4a alone failed to induce expression of PT DME genes. Since we have also presented substantial data suggesting the involvement of Hnf1a (Figs. 1, B and C, and 3B), we also tested Hnf1a by itself. Hnf1a alone also showed little potential to induce expression of PT DMEs in MEFs. We were surprised to find that neither factor was able to induce the expression of the other one by itself, considering multiple lines of evidence for cross-regulation, and the fact that a set of clinically relevant phase III transporters—Slc22a6, Slc22a7, Slc22a8, and Slco1a1—are significantly downregulated in Hnf1a−/− mature kidneys (Maher et al., 2006). Remarkably, when introduced in combination, Hnf4a and Hnf1a were able to induce robust expression of many predicted DME targets in the PT (Fig. 8C).
Taking all of our findings into consideration, we suggest the following model. The primary role of Hnf4a is to set up basal and constitutive cis-regulatory enhancer elements, which then become accessible to other coregulators. Considering the fact that Hnf4a plays important but varying roles in the liver and other tissues, chromatin state and other factors are likely to be important in helping establish tissue-specific binding profiles of Hnf4a. Hnf1a and other coregulators may establish an additional layer of specificity in a combinatorial fashion, leading to the appropriate expression profiles in different tissues. Other coregulators might involve other members of the nuclear receptor family, which are known to play important roles in regulating metabolic function in the proximal tubule, as well as transcriptional repressors. Of note, a generic nuclear receptor binding motif was highly abundant and enriched within Hnf4a peaks (data not shown). It might be possible that nuclear receptors regulate target genes via Hnf4a-established enhancers, either by binding nearby or by competing for lower-affinity binding sites. In this context, it is worth pointing out that there were Hnf4a peaks at nonexpressed genes that might be important in later proximal tubule function [e.g., Car (Nr1i3), Pxr (Nr1i2)]; some of these may be poised enhancers, perhaps requiring stimulation by other transcription factors (including those implicated in Fig. 1C) in later life or during periods of stress. These nuclear receptors are thought to act as ligand-dependent “sensors” (Rosenfeld et al., 2006; Ahn and Nigam, 2009; Wu et al., 2011). According to the Remote Sensing and Signaling Hypothesis, “drug” transporters such as those regulated by nuclear receptors play a role in regulating inter-organ communication in normal physiology, after perturbation of homeostasis and possibly during development; in this context, it is conceivable that HNF4a and other nuclear receptors play a key role in the sensing-specific metabolic alterations, leading to the necessary changes in transporter and DME expression.
In summary, we have shown that Hnf4a is required for basal expression of DMEs in the proximal tubule. Furthermore, we demonstrated that, together, Hnf1a and Hnf4a are sufficient to induce the expression of representative proximal tubule phase I, II, and III drug-metabolizing genes, further supporting their roles in DME regulation in the developing PT. The data from this study should prove helpful in defining the steps involved in the transcriptional maturation of the proximal tubule that involve Hnf4a, Hnf1a and other transcription factors as they relate to the expression of drug transporters and phase I/II drug-metabolizing enzymes.
Acknowledgments
The authors thank Dr. Fred Levine and Seung-Hee Lee for helpful discussions and for providing the Hnf4a antagonist BI6015 and control compound BI6018. The authors also thank Dr. Lijian Hui for providing the lentiviral plasmids containing Hnf4a or Hnf1a cDNA inserts. Finally, the authors thank Jennifer Santini and the UCSD Neuroscience Microscopy Shared Facility (funded by P30 NS047101) for access to imaging training and equipment.
Authorship Contributions
Participated in research design: Martovetsky, Tee, Nigam.
Conducted experiments: Martovetsky.
Contributed new reagents or analytic tools: Martovetsky, Tee, Nigam.
Performed data analysis: Martovetsky.
Wrote or contributed to the writing of the manuscript: Martovetsky, Nigam.
Footnotes
- Received July 2, 2013.
- Accepted September 13, 2013.
The work was supported by the National Institutes of Health National Institute of Child Health and Human Development [Grant U54-HD07160]; the National Institutes of Health National Institute of General Medical Sciences [Grants R01-GM098449 and GM104098]; and Alberta Children’s Hospital Foundation establishment grant.
↵
 This article has supplemental material available at molpharm.aspetjournals.org.

Abbreviations
- BI6015
- 2-methyl-1-(2-methyl-5-nitrophenylsulfonyl)-1H-benzo[d]imidazole
- 6-CF
- 6-carboxyfluorescein
- Car
- constitutive androstane receptor
- ChIP
- chromatin immunoprecipitation
- ChIP-seq
- ChIP combined with massively parallel DNA sequencing
- DAPI
- 4′,6-diamidino-2-phenylindole
- DME
- drug-metabolizing enzyme/transporter
- DMEM
- Dulbecco’s modified Eagle’s medium
- EGFP
- enhanced green fluorescent protein
- FBS
- fetal bovine serum
- FC
- fold change
- Hnf1a
- hepatocyte nuclear factor 1α
- Hnf4a
- hepatocyte nuclear factor 4α
- IGEPAL
- octylphenoxypolyethoxyethanol
- IPA
- Ingenuity Pathway Analysis software suite
- MEFs
- mouse embryonic fibroblasts
- Oat
- organic anion transporter
- Oct
- organic cation transporter
- PCR
- polymerase chain reaction
- Pen/Strep
- penicillin/streptomycin
- PBS
- phosphate-buffered saline
- Pparα
- peroxisome proliferator–activated receptor α
- PT
- proximal tubule
- TSS
- transcription start site
- Copyright © 2013 by The American Society for Pharmacology and Experimental Therapeutics


