


Abstract
Interactions between the UGT2B7-catalyzed glucuronidation of zidovudine (AZT), 4-methylumbelliferone (4MU), and 1-naphthol (1NP) were analyzed using multisite and empirical kinetic models to explore the existence of multiple substrate and effector binding sites within this important drug metabolizing enzyme. 4MU and 1NP glucuronidation by UGT2B7 exhibit sigmoidal kinetics characteristic of homotropic cooperativity (autoactivation), which may be modeled assuming the existence of two equivalent, interacting substrate binding sites. In contrast, UGT2B7-catalyzed AZT glucuronidation follows hyperbolic (Michaelis-Menten) kinetics. Although 4MU and 1NP decreased the binding affinity of AZT, the kinetics of AZT glucuronidation changed from hyperbolic to sigmoidal in the presence of both modifiers. Data were well described by a generic two-substrate binding site model in which there is no interaction between the sites in the absence of 4MU or 1NP, but heterotropic cooperativity results from the binding of modifier. Inhibition of 4MU and 1NP glucuronidation by AZT and interactions between 4MU and 1NP required more complex three-site models, where the modifier acts via a distinct effector site to alter either substrate binding affinity or Vmax without affecting the homotropic cooperativity characteristic of 4MU and 1NP glucuronidation. It is noteworthy that 1NP inhibited 4MU glucuronidation, whereas 4MU activated 1NP glucuronidation. The results are consistent with the existence of two “catalytic” sites for each substrate within the UGT2B7 active site, along with multiple effector sites. The multiplicity of binding and effector sites results in complex kinetic interactions between UGT2B7 substrates, which potentially complicates inhibition screening studies.
Conjugation with glucuronic acid (“glucuronidation”) is responsible for the elimination and detoxification of a structurally diverse range of compounds that includes drugs, dietary chemicals, environmental pollutants, and endogenous compounds (Miners and Mackenzie, 1991; Radominska-Pandya et al., 1999; Tukey and Strassburg, 2000). Glucuronidation reactions are catalyzed by the enzyme UDP-glucuronosyltransferase (UGT). Consistent with its broad substrate profile, UGT comprises a “superfamily” of enzymes that has been further classified into two families, UGT1 and UGT2, based on evolutionary divergence (Mackenzie et al., 2005). Of the seventeen human UGT proteins characterized to date, UGT2B7 is arguably the most important in terms of drug metabolism. UGT2B7 catalyzes the glucuronidation of many opioids and nonsteroidal anti-inflammatory drugs, as well as some anticonvulsants, epirubicin, and zidovudine (Jin et al., 1993; Coffman et al., 1998; Radominska-Pandya et al., 1999; Tukey and Strassburg, 2000; Court et al., 2003). Furthermore, UGT2B7 metabolizes nondrug xenobiotics and numerous endogenous compounds that include bile acids, retinoids, steroid hormones, and fatty acids (Jin et al., 1997; Radominska-Pandya et al., 1999; Turgeon et al., 2001).
Despite the importance of UGT2B7 in the metabolism of xenobiotics and endogenous compounds, the molecular basis for substrate interactions with UGT2B7, and indeed UGTs more generally, remains poorly understood. Studies with chimeric and fusion proteins are generally consistent with the hypothesis that aglycone selection is determined by the amino terminal portion of UGT2B subfamily enzymes (Mackenzie, 1990; Ritter et al., 1992; Li et al., 1997; Lewis et al., 2007). Site-directed mutagenesis and NMR spectroscopy have further implicated a limited number of amino acids in the N-terminal region of UGT 2B7, 2B15, and 2B17 in substrate binding (Dubois et al., 1999; Coffman et al., 2003). However, the existence of multiple substrate binding domains within the UGT2B7 active site has not been explored in a systematic manner.
We have demonstrated previously that 4-methylumbelliferone (4MU) and 1-naphthol (1NP) glucuronidation by UGT2B7 exhibit sigmoidal kinetics characteristic of autoactivation (Uchaipichat et al., 2004). Kinetic data for both substrates were well modeled empirically by the Hill equation, and using a model that assumes binding of substrate at two equivalent sites. Application of the two-site model demonstrated that positive homotropic cooperativity was consistent with increased binding affinity upon binding of a second 4MU or 1NP molecule. In contrast to 4MU and 1NP, zidovudine (AZT) glucuronidation by UGT2B7 follows hyperbolic (Michaelis-Menten) kinetics (Court et al., 2003; Uchaipichat et al., 2006). Substrate-dependent autoactivation is a feature of several UGTs (Uchaipichat et al., 2004), and heterotropic activation of human liver microsomal estradiol 3-glucuronidation, a UGT1A1 catalyzed reaction, was observed with ethinylestradiol and anthraflavic acid as modifiers (Williams et al., 2002).
Like UGTs, several cytochrome P450 enzymes exhibit atypical kinetics in vitro. It is noteworthy that autoactivation is relatively common with CYP3A4 substrates (Houston and Kenworthy, 2000). Heterotropic interactions between alternate CYP3A4 substrates add another level of complexity. A modifier may act as an activator at low concentrations but an inhibitor at high concentrations, depending on interactions occurring at the active site and the involvement of an effector site(s) (Domanski et al., 2001; Kenworthy et al., 2001; Shou et al., 2001; Galetin et al., 2002). Thus, the effect of the modifier may vary from substrate to substrate. In general, the CYP3A4 kinetic data are consistent with the existence of three distinct binding domains: one for the substrate, one for the modifier, and one common to both (Hosea et al., 2000; Kenworthy et al., 2001; Galetin et al., 2003; He et al., 2003). These conclusions are broadly consistent with site-directed mutagenesis studies, which implicate distinct, but closely linked substrate and effector binding sites, along with “preferred” binding locations for different substrates (Domanski et al., 2001; He et al., 2003; Davydov et al., 2007). Recently solved crystal structures for substrate bound CYP3A4 provide evidence of a large active site cavity consistent with the possibility of multiple ligand binding (Johnson and Stout 2005).
As noted above, the structural features of UGTs that confer substrate binding are poorly understood and, in contrast to P450s, no X-ray crystal structure that includes the aglycone binding domain of a UGT is currently available. Kinetic modeling of interactions between CYP3A4 substrates has provided important insights into the existence of multiple substrate binding domains and effector sites. The differing kinetic behaviors observed for AZT, 4MU, and 1NP provide the opportunity to explore the existence of discrete substrate and effector binding sites within UGT2B7.
Materials and Methods
Materials. AZT (3′-azido-3′-deoxythymidine), GAZT (3′-azido-3′deoxythymidine 5′-β-d-glucuronide), 4MU (sodium salt), 4-methylumbelliferone-β-d-glucuronide (4MUG), 1NP, 1-naphthol-β-d-glucuronide (1NPG), and UDP-glucuronic acid (UDPGA; trisodium salt) were purchased from Sigma-Aldrich (St Louis, MO). Solvents and other reagents were of analytical reagent grade.
Expression of UGT2B7. A UGT2B7 cDNA (tyrosine-268) was stably expressed in a human embryonic kidney (HEK) 293 cell line as described previously (Stone et al., 2003; Uchaipichat et al., 2004). HEK293 cells were transfected with the UGT2B7 cDNA cloned into the pEF-IRES-puro6 expression vector and incubated in Dulbecco's modified Eagle's medium that contained puromycin (1.5 mg/l), 10% fetal calf serum, and penicillin G sodium (100 units/ml)/streptomycin sulfate (100 μg/ml) in a humidified incubator with an atmosphere of 5% CO2 at 37°C. After growth to at least 80% confluence, cells were harvested and washed twice in phosphate-buffered saline. The cells were subsequently lysed by sonication using a sonicator (Misonix, Farmingdale, NY) set at microtip limit of four. Cells were sonicated with four 1-s “bursts,” each separated by 3 min cooling on ice, centrifuged (12,000g for 1 min at 4°C), and the supernatant fraction was separated and stored at -80°C until use.
AZT Glucuronidation Assay. The formation of GAZT was measured using a modification of the method of Boase and Miners (2002). Incubation mixtures, in a total volume 0.2 ml, contained 0.1 M phosphate buffer, pH 7.4, 4 mM MgCl2, 5 mM UDPGA, AZT (Table 1), and HEK293 cell lysate expressing UGT2B7 (1.5 mg/ml). It should be noted that the UDPGA concentration employed in the AZT, 4MU, and 1NP (see 4MU and 1NP Glucuronidation Assays) glucuronidation assays is approximately an order of magnitude higher than the Km (493 μM) for UGT2B7. Reactions were initiated by the addition of UDPGA and performed at 37°C in a shaking water bath for 60 min. Under these conditions, the rate of GAZT formation was linear with respect to protein concentration and incubation time. After the addition of 10 μl of 24% HClO4, samples were centrifuged (5000g for 10 min), and a 30-μl aliquot of the supernatant fraction was analyzed by HPLC according to the method of Uchaipichat et al. (2006).
Substrate and modifier concentrations
4MU and 1NP Glucuronidation Assays. The incubation mixture (0.2 ml) contained 0.1 M phosphate buffer, pH 7.4, 5 mM UDPGA, 4 mM MgCl2, 4MU or 1NP (Table 1), and HEK293 cell lysate expressing UGT2B7 (0.25 and 0.5 mg/ml for the 4MU and 1NP assays, respectively). After initiation of reactions with UDPGA, incubations were performed at 37°C in a shaking water bath for 120 min. Rate of 4MUG and 1NPG formation were linear with respect to both protein concentration and incubation time under these conditions. Incubations were terminated as described (see AZT Glucuronidation Assay), and a 40-μl aliquot of the supernatant fraction was injected into the HPLC column. HPLC conditions were as described by Udomuksorn et al. (2007). 4MUG and 1NPG were quantified by comparison of peak areas to those of separate standard curves prepared over the concentration range 0.2 to 10 μM. Within-day overall assay reproducibility for each assay was assessed by measuring 4MUG or 1NPG formation in seven separate incubations of the same batch of cell lysate. Coefficients of variation were <5% for added 4MU concentrations of 50, 400, and 1500 μM and for added 1NP concentrations of 25, 200, and 800 μM.
Interactions between AZT, 4MU, and 1NP Glucuronidation by UGT2B7. Interaction studies were performed at incubation times and protein concentrations within the linear range of each individual substrate using the same batch of HEK293 cell lysate expressing UGT2B7. The substrate and modifier concentration ranges spanned the Km or S50 values of each substrate or modifier (from at least 0.25- to 3-fold Km or S50). Incubations were performed with five or six substrate concentrations in the absence and presence of six or seven modifier concentrations (Table 1). Experiments with 1NP as substrate or modifier contained 0.5% dimethyl sulfoxide, which has a negligible effect on UGT2B7 activity (Uchaipichat et al., 2004).

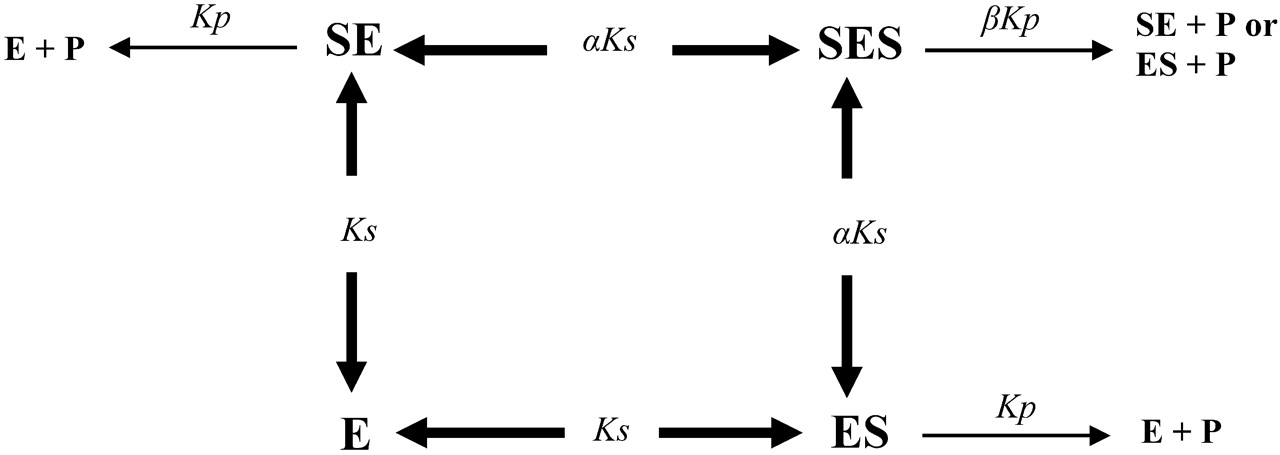
Kinetic model for an enzyme with two equivalent substrate binding sites, where the second substrate molecule binds cooperatively.
Data Analysis. Individual data points represent the mean of duplicate estimates (<10% variance). Kinetic data for AZT, 4MU, and 1NP glucuronidation by recombinant UGT2B7 were analyzed initially by fitting untransformed experimental data to the Michaelis-Menten (eq. 1) and Hill (eq. 2) equations, which describe hyperbolic and sigmoidal kinetics, respectively, using GraFit 5 (Erithacus Software, Horley, Surrey, UK):
where v is the rate of reaction, Vmax is the maximum velocity, Km is the Michaelis constant (substrate concentration at 0.5 Vmax), and [S] is the substrate concentration.
where S50 is the substrate concentration resulting in 50% of Vmax and nH is the Hill coefficient. Because AZT, 4MU, and 1NP do not bind nonspecifically to HEK293 cell lysate, no correction for binding was necessary.
A two-site model (Fig. 1, eq. 3) was also used for the preliminary analysis of sigmoidal kinetic data in the presence of increasing concentrations of the modifiers (Houston and Kenworthy, 2000). The model is based on a steady-state rapid equilibrium approach and the assumption that the two binding sites are equivalent:
where Ks is binding affinity and α is the interaction factor that reflects the change in Ks. The interaction factor (β) for the effective catalytic rate constant (Kp) is not incorporated in eq. 3 because β is equal to 2 for autoactivation (assuming the two substrate binding sites are equivalent) and Vmax equates to 2Kp[E]t, where [E]t is the total enzyme concentration.
To investigate the mechanisms involved in the interactions between AZT, 4MU, and 1NP, data were analyzed using various multisite kinetic models based on steady-state and rapid equilibrium approaches. The selection of an appropriate multisite kinetic model involved consideration of the rate profiles in the presence of a modifier and the changes in the kinetic parameters for the substrate of interest observed in the preliminary analysis. Complete data sets (36-42 activity measurements) in the presence and absence of modifier were subsequently fitted to the rate equations for multisite kinetic models using GraFit. The model with the least number of parameters that was consistent with the kinetic properties of both the substrate and modifier was selected. Goodness of fit was determined by comparison of statistical parameters (χ2 and Akaike information criterion values) between the models and a reduction in the standard errors of the parameter estimates. Kinetic parameter estimates generated from different multisite kinetic models were used to simulate velocity curves for metabolite formation. In contrast to the preliminary analysis (e.g., Hill plot), where individual fits are obtained for each specific concentration of modifier, multisite kinetic analysis allows the simultaneous fit of all the data covering the range of modifier concentrations.
Multisite Kinetic Equilibria Models. Variations of the generic CYP3A4 two-site model (Galetin et al., 2002) were applied to interpret the inhibition profiles observed for the interactions between the UGT2B7 substrates studied here. To characterize the effect of a certain modifier, different interaction factors are defined analogous to the previous analysis of interactions between CYP3A4 substrates and modifiers (Galetin et al., 2002 and 2003).
Two-Site Inhibition Model for a Substrate Exhibiting Michaelis-Menten Kinetics. The generic two-site model shown in Fig. 2A (eq. 4) represents the case in which modifier competes at both substrate binding sites. No interaction occurs between the substrate molecules in the absence of inhibitor, and hence Michaelis-Menten kinetics are observed. In the interactions with AZT as the substrate, modifiers caused changes in the binding affinity (Ks) defined by the factor δ. Because there were no changes in product formation (described by γKp), eq. 4 may be simplified by omitting γ. The factor α in this model defines the cooperative binding of the modifier.
Three-Site Inhibition Model for a Substrate Exhibiting Sigmoidal Kinetics. Interactions involving 4MU and 1NP as substrates were characterized by three-site kinetic models because of their sigmoidal kinetic behavior. The model presented in Fig. 2B and eqs. 5 and 6 describe the inhibition of a substrate showing sigmoidal kinetics, where substrate cooperativity remains in the presence of the inhibitor. Enzyme complexes containing inhibitor may or may not result in the formation of product from either substrate binding site. Equation 5 holds in the absence of an effect on product formation (that is, when there is no significant effect of the modifier on Vmax). In contrast, eq. 6 describes the situation in which enzyme complexes containing inhibitor do not result in product formation. Thus, inhibition occurs via a change in Vmax. Analogous to the two-site model, the catalytic sites of the models represented by Fig. 2B are assumed to be equivalent. Thus, β equals 2 and cancels out in the equations because Vmax is equal to 2Kp[E]t.

Three-Site Model for Heteroactivation.Figure 2B also describes the heteroactivation of a substrate exhibiting sigmoidal kinetics (Kenworthy et al., 2001), except that the inhibitor (Fig. 2B, I) now acts as an activator and Ki is replaced by the activation constant (Ka). Alteration in Ks by the factor α (<1) reflects cooperative binding of the substrate. The activator mimics the cooperative effects of the second substrate molecule and stimulates the metabolism of the substrate via a distinct effector site. The equation describing this model (eq. 7) is analogous to eq. 5; [A] denotes the concentration of the activator. Assuming the enzyme has two identical substrate binding sites, β = 2 and Vmax is equivalent to 2Kp[E]t.

A, generic two-site model for UGT2B7 interactions. The interaction factors α and δ are associated with changes in binding affinity (Ks or Ki) and reflect homotropic- and- heterotropic-cooperativity, respectively. β and γ are interaction factors associated with changes in the catalytic rate constant (Kp), from SES and SEI, respectively (adapted from Galetin et al., 2003). B, generalized multisite kinetic equilibrium model for the inhibition and heteroactivation of a substrate exhibiting sigmoidal kinetics, where substrate cooperativity remains in the presence of the modifier. The model accommodates a change or no effect in product formation in the presence of the inhibition.
Results
Kinetics of AZT, 4MU, and 1NP Glucuronidation by Recombinant UGT2B7. Consistent with previously published reports (Uchaipichat et al., 2004, 2006), AZT glucuronidation by UGT2B7 exhibited hyperbolic kinetics, whereas UGT2B7-catalyzed 4MU and 1NP glucuronidation followed sigmoidal kinetics (Fig. 3). Derived kinetic parameters for AZT, 4MU, and 1NP glucuronidation by UGT2B7 are shown in Table 2. Kinetic data for 4MU and 1NP glucuronidation were well described by either the Hill equation (eq. 2) or the equation for the two-site model (eq. 3). Fitting of the 4MU and 1NP kinetic data to the two-site model indicated enhanced affinity upon binding of the second substrate molecule (α = 0.06-0.09).
Kinetic parameters for 4MU, 1NP and AZT glucuronidation by UGT2B7
Kinetic parameters are shown as mean ± S.E. of parameter fit. Values for 4MU and 1NP use the Hill equation; those for AZT use the Michaelis-Menten equation.
Effects of 4MU and 1NP on AZT Glucuronidation. The effects of 1NP on the kinetics of AZT glucuronidation by UGT2B7 are shown in Fig. 4; results with 4MU as the modifier showed the same trends (data not shown). The application of empirical models suggested that both 4MU and 1NP inhibit UGT2B7-catalyzed AZT glucuronidation by decreasing substrate binding affinity, as demonstrated by steeper Eadie-Hofstee plots in the presence of both compounds (Fig. 4A), without an effect on Vmax. Km (or S50) values for AZT glucuronidation increased 7- to 9-fold; from 348 to 360 in the absence of modifier to 2338 and 3213 μM in the presence of the highest concentrations of 4MU (1000 μM) and 1NP (600 μM), respectively. It is noteworthy that AZT glucuronidation kinetics changed from hyperbolic (Michaelis-Menten) to sigmoidal in the presence of 1NP at concentrations above 10 μM (and with 4MU concentrations above 50 μM), which is evident from the curvature of Eadie-Hofstee plots (Fig. 4A) and changes in the clearance plots (Fig. 4B; plot of v/[S] versus [S]), where maximum values of CL (as v/[S]) occur at concentrations above the lowest substrate concentration employed.
The effects of 1NP and 4MU on AZT glucuronidation were generally consistent with competitive inhibition (i.e., increased Km or S50 without a change in Vmax). However, empirical models cannot accommodate the cooperativity observed for AZT glucuronidation at higher modifier concentrations. Thus, the generic two-site kinetic model (Fig. 2A and eq. 4) was employed to describe the inhibition mechanism and generate inhibition constants and the factors α and δ (Table 3). Ks values generated for AZT were essentially identical to the Km obtained in the absence of modifier (Tables 2 and 3). The simultaneous fit of AZT glucuronidation kinetic data generated in the absence and presence of 1NP is demonstrated in Fig. 4C.
Kinetic parameters for the interactions between 4MU, 1NP, and AZT glucuronidation by UGT2B7
Kinetic parameters are shown as mean ± S.E. of parameter fit.
Effects of AZT on 4MU and 1NP Glucuronidation. By way of example, effects of AZT on 4MU glucuronidation are shown in Fig. 5—similar trends were observed with 1NP as the modifier (data not shown). Rates of 4MU and 1NP glucuronidation by UGT2B7 decreased in the presence of increasing concentrations of AZT (Fig. 5A). Preliminary analysis of data using the Hill equation showed that S50 values for 4MU and 1NP glucuronidation ranged from 446 to 1124 μM and from 175 to 319 μM, respectively, in the absence and presence of the highest concentration (1500 μM) of AZT (Fig. 5B). However, Vmax values and the Hill coefficients for each substrate were essentially unchanged by AZT. Analysis based on the basic two-site kinetic model (eq. 3) yielded broadly similar trends. Binding affinities (Ks) for 4MU (5386 versus 1357 μM) and 1NP (1728 versus 858 μM) were 4- and 2-fold higher, respectively, at the highest (1500 μM) AZT concentration (compared with baseline), with <20% variation in Vmax. Values of α for 1NP and 4MU, which reflects homotropic cooperativity, ranged from 0.038 to 0.044 and 0.12 to 0.030, respectively, over the AZT concentration range 0 to 1500 μM. The minor effect of AZT on sigmoidicity and cooperativity from fitting to empirical and two-site models suggests that AZT inhibits 4MU and 1NP glucuronidation by binding at a distinct effector site, and kinetic data were fitted to the three-site model represented by Fig. 2B and eq. 5. The simultaneous fit of 4MU glucuronidation kinetic data in the absence and presence of AZT is shown in Fig. 5C, and derived kinetic constants for the effects of AZT on both 4MU and 1NP glucuronidation are given in Table 3.

Eadie-Hofstee plots for the glucuronidation of AZT (A), 4MU (B), and 1NP (C) by UGT2B7. Points are experimentally determined values, whereas solid lines show the fit of data to the Michaelis-Menten or Hill equations.

A and B, Eadie-Hofstee and clearance plots for AZT glucuronidation in the presence of increasing 1NP concentrations. Symbols represent 1NP concentrations: 0 (○), 10 (•), 25 (□), 75 (▪), 150 (▵), 300 (▴), and 600 μM (▿), respectively. C, kinetic profile for AZT glucuronidation by UGT2B7 in the presence of increasing 1NP concentrations (10-600 μM). Solid lines show the simultaneous fit of data to eq. 4. Symbols represent 1NP concentrations as in A and B.
Interactions between 4MU and 1NP Glucuronidation. UGT2B7-catalyzed 1NP glucuronidation was activated by 4MU (Fig. 6A). The increase in the rate of 1NP glucuronidation was greatest (approximately 400% of control value) at the lowest substrate concentration (25 μM), with lesser activation (5-30% of control value) at 1NP concentrations of 200 and 400 μM. No effect was observed at the highest (1000 μM) 1NP concentration. S50 values for 1NP glucuronidation generated using the Hill equation decreased from 180 μM in the absence of 4MU to 60 to 78 μM for 4MU concentrations above 100 μM, whereas Vmax values for 1NP glucuronidation varied <20% (compared with control) across the modifier concentration range. Values of the Hill coefficient decreased from 1.54 in the absence of 4MU to 1.23 at the highest modifier concentration, as demonstrated by the decreasing curvature of Eadie-Hofstee plots (Fig. 6B). In addition, the shape of clearance plots changed toward the profile expected for hyperbolic kinetics with increasing 4MU concentration (Fig. 6C). The decrease in the sigmoidicity associated with 1NP glucuronidation was confirmed by the decrease in cooperativity observed from fitting to the two-site kinetic model; α increased from 0.06 in the absence of modifier and to ≥0.24 at 4MU concentrations above 100 μM. 4MU activation of 1NP glucuronidation by UGT2B7 was well described by a three-site kinetic model (Fig. 3 and eq. 7) in which 4MU mimics the cooperative effects of a second substrate molecule and stimulates substrate metabolism via a distinct activator site. The simultaneous fit for 1NP glucuronidation data in the presence of 4MU obtained using eq. 7 is shown in Fig. 6D. The derived activation constant (Ka) was 432 μM.

A, rate of 4MU glucuronidation (as percentage of control activity) in the presence of increasing concentrations of AZT. Symbols represent substrate (4MU) concentrations: 50 (○), 100 (•), 200 (□), 400 (▪), 600 (▵), and 1000 μM (▴). B, Eadie-Hofstee plots for 4MU glucuronidation in the presence of increasing AZT concentrations. Symbols represent AZT concentrations: 0 (○), 100 (•), 300 (□), 600 (▪), 900 (▿), and 1500 μM (▴), respectively. C, kinetic profiles for UGT2B7-catalyzed 4MU glucuronidation in the presence of increasing AZT concentrations (100-1500 μM). Solid lines show the simultaneous fit of data to eq. 5. Symbols for the individual AZT concentrations are as in B.
In contrast, 4MU glucuronidation by UGT2B7 was inhibited by 1NP. Inhibition was similar over the 4MU concentration range (100-1000 μM); IC50 values for 1NP ranged from 76 to 103 μM (Fig. 7A). The Vmax for 4MU glucuronidation derived using the Hill equation decreased with increasing 1NP concentration (Fig. 7B), from 1219 (control) to 232 pmol/min · mg protein (in the presence of 600 μM 1NP). S50 values for 4MU glucuronidation were generally unchanged (661-687 μM) in the presence of low concentrations of 1NP (25-150 μM), although the S50 increased to approximately 1250 μM at higher 1NP concentrations (300 and 600 μM). Although sigmoidicity remained in the presence of 1NP, values of the Hill coefficient declined from 1.50 in the absence of modifier to 1.13 at the highest 1NP concentration (600 μM). Taken together, these data suggest that 1NP primarily inhibits 4MU glucuronidation at a distinct effector site by preventing product formation from the modifier-bound complex, and data were fitted to the three-site inhibition model represented by Fig. 2B and eq. 6. Model-fitted data are shown in Fig. 7C.

A, rate of 1NP glucuronidation (as a percentage of control) in the presence of increasing concentrations of 4MU. Symbols represent substrate (1NP) concentrations: 25 (▪), 100 (□), and 1000 (▴) μM. Eadie-Hofstee (B) and clearance (C) plots for 1NP glucuronidation in the presence of increasing 4MU concentrations. Symbols represent 4MU concentrations: 0 (○), 50 (•), 100 (□), 300 (▪), and 600 μM (▵). D, kinetic profiles for 1NP glucuronidation by UGT2B7 in the presence of increasing 4MU concentrations (50-600 μM). Solid lines show the simultaneous fit of data to eq. 7.
Discussion
Consistent with a previous report from this laboratory (Uchaipichat et al., 2004), 4MU and 1NP glucuronidation by UGT2B7 exhibited sigmoidal kinetics characteristic of autoactivation. Kinetic data for both substrates were well modeled empirically by the Hill equation and by using a model that assumes binding of substrate at two equivalent sites (Fig. 1). With this two-site model, positive homotropic cooperativity arises from increased affinity (αKs) upon binding of a second substrate molecule. The very low values of α obtained for 4MU and 1NP (Table 2) reflect 11- and 17-fold enhancement of their respective binding affinities.
In the absence of modifier, AZT glucuronidation by UGT2B7 exhibits hyperbolic (Michaelis-Menten) kinetics. Although both 4MU and 1NP competitively inhibit AZT glucuronidation, as shown by a decrease in Km or S50 without a change in Vmax, kinetic plots became sigmoidal at higher modifier concentrations. These data were described by the generic two-site model represented in Fig. 2A. Here, 4MU and 1NP compete at both AZT binding sites, with respective Ki values of 369 and 145 μM. There is no interaction between the two AZT binding sites in the absence of modifier; hence, Michaelis-Menten kinetics are observed. Although the interaction shows features of competitive inhibition, a single-site model cannot accommodate the cooperativity observed at higher modifier concentrations and changes in binding affinity reflected by the factor δ (0.31 and 0.39 for 4MU and 1NP, respectively). Likewise, values of α, which in the model described by eq. 4 represent the cooperative binding of modifier, were 0.08 and 0.10 for 1NP and 4MU, respectively, in agreement with the homotropic positive cooperativity observed for 1NP and 4MU glucuronidation by UGT2B7. Taken together, kinetic modeling provides evidence for the existence of two “catalytic” binding sites for each of the three UGT2B7 substrates investigated here.
Although AZT inhibited 4MU and 1NP glucuronidation, cooperativity was not substantially altered in the presence of increasing concentrations of AZT, suggesting that the inhibitor acts at a distinct effector site. Inhibition of 4MU and 1NP glucuronidation by AZT was well described by a three-site model (Fig. 2B) employed previously to describe the effects of diazepam and quinidine on testosterone 6β-hydroxylation (Kenworthy et al., 2001; Galetin et al., 2002). Differential effects on 4MU and 1NP cooperativity may occur depending on the binding affinity of the modifier in the active site, potential overlap with the 4MU/1NP binding sites, or whether binding occurs at an effector site. In this particular case, inhibition arises from binding of AZT at a distinct effector site without affecting the cooperativity of 4MU and 1NP binding. AZT is a more potent inhibitor of 4MU glucuronidation than 1NP glucuronidation (176 and 379 μM, respectively), consistent with the more potent inhibition of AZT glucuronidation by 1NP.

A, rate of 4MU glucuronidation (as percentage of control) in the presence of increasing concentrations of 1NP. Symbols represent substrate (4MU) concentrations: 50 (○), 100 (•), 200 (□), 400 (▪), 600 (▵), and 1000 μM (▴). B, Eadie-Hofstee plots for 4MU glucuronidation in the presence of increasing 1NP concentrations. Symbols represent modifier (1NP) concentrations: 0 (○), 25 (•), 75 (□), 150 (▪), 300 (▵), and 600 μM (▴), respectively. C, kinetic profiles for 4MU glucuronidation by UGT2B7 in the presence of increasing 1NP concentrations. Symbols represent 1NP concentrations: 0 (○), 25 (•), 75 (□), 150 (▪), 300 (▵), and 600 μM (▴). Solid lines show the simultaneous fit of data to eq. 6.
Like AZT, 1NP also inhibited 4MU glucuronidation by UGT2B7 without a substantial effect on substrate cooperativity (at least at low 1NP concentrations). However, inhibition resulted mainly from a decrease in Vmax. The model used to describe these data again assumes binding of inhibitor at a distinct effector site but with abolition of product formation from enzyme complexes containing inhibitor. As is evident from Fig. 7, A and C, rate of product formation approaches zero at high modifier concentration. Although experimental data were well described by the three-site model, the increase in S50 and decrease in Hill coefficient observed at the highest modifier concentrations suggests that 1NP may also act as a competitive inhibitor of 4MU glucuronidation.
In contrast to the inhibition of 4MU glucuronidation by 1NP, 4MU activated the formation of 1NPG by UGT2B7. Kinetic data were well described by the three-site model illustrated in Fig. 2B, where modifier binds at an effector site that is distinct to the two substrate binding sites. At high concentrations of modifier, the enzyme reaction is driven toward the rear face of the cube (Fig. 2B), and the velocity versus substrate concentration curve becomes more hyperbolic because the enzyme is already in an activated state when either one or two substrate molecules subsequently bind to the substrate-enzyme-activator complex, the enzyme-substrate-activator complex, or the enzyme-activator complex. This model is equivalent to the approach adopted to analyze the heteroactivation of 3-hydroxydiazepam formation by testosterone (Kenworthy et al., 2001).
Models employed throughout this work assume the existence of two equivalent substrate binding sites. Although models that assume distinct, nonequivalent binding sites have been used for modeling kinetic data for CYP3A4 substrates (e.g., Shou et al., 2001), the models depicted in Fig. 2 have proved successful in characterizing interactions between CYP3A4 substrates (Houston and Galetin, 2005). In addition, the two-site model (Fig. 1) has been used successfully to describe the homotropic positive cooperativity (autoactivation) and substrate inhibition observed for several reactions catalyzed by UGT enzymes (Stone et al., 2003; Miners et al., 2004; Uchaipichat et al., 2004). It is important in this regard that there is now strong evidence that UGT enzymes from both the UGT1A and UGT2B subfamilies exist as dimers (Meech and Mackenzie, 1997; Kurkela et al., 2003; Operaña and Tukey, 2007), and a putative dimerization domain of UGT2B7 has been identified (Lewis et al., 2007). It might be speculated that the two identical substrate domains arise from dimerization, although direct evidence for this is currently lacking. Based on the similarity of Km and Ki values generated for interactions between alternate UGT2B7 substrates, Rios and Tephly (2002) suggested the existence of a single substrate binding domain. However, limited actual data were presented, and the kinetic analyses seem to have been performed graphically.
4MU and 1NP are efficiently metabolized by several UGT enzymes and this has led to their use as substrate “probes” for measuring the activity of recombinant UGTs, including the screening for potential inhibition by drugs and other chemicals. However, the complex interactions observed here between 4MU, 1NP and AZT, including heterotropic activation, clearly indicates that data from inhibition screening studies need to be interpreted with care. Apart from the UGT2B7 inhibition/activation data reported here, Williams et al. (2002) previously observed differential modulation of estradiol 3-glucuronidation by alternate UGT1A1 substrates, suggesting that complex active- and effector-site interactions may occur more generally with human UGTs. It is noteworthy that there is evidence now demonstrating that the autoactivation and heterotropic activation observed in vitro may be of relevance to drug disposition in vivo. Autoactivation has been reported recently for the glucuronidation of valproic acid, a UGT2B7 substrate, in adult sheep and by sheep liver microsomes (Wong et al., 2007). Addition of quinidine to incubations of monkey hepatocytes and microsomes stimulates the CYP3A catalyzed oxidation of diclofenac, whereas coadministration of quinidine results in a short-term increase in diclofenac clearance in monkeys in vivo (Tang et al., 1999). Likewise, heteroactivation of the CYP3A catalyzed epoxidation of carbamazepine by felbamate provides a mechanism for the felbamate-carbamzepine interaction in humans in vivo (Egnell et al., 2003).
In summary, multisite modeling of kinetic and inhibition data are consistent with the existence of two “catalytic” sites for AZT, 4MU, and 1NP within the UGT2B7 substrate binding domain. The data further demonstrate the existence of distinct effector sites for each compound. The relationship between these various sites is currently unclear. Although competitive inhibition of AZT glucuronidation by 4MU and 1NP suggests a shared binding site, reciprocal competitive inhibition of 4MU and 1NP glucuronidation by UGT2B7 was not observed. Likewise, there was evidence to suggest competitive inhibition of 4MU glucuronidation by 1NP at high modifier concentrations, but again reciprocal competitive inhibition of 1NP glucuronidation by 4MU was not evident. The possibility remains, however, that the activation of 1NP glucuronidation observed with 4MU may obscure an element of competitive inhibition. Interactions involving a wider range of UGT2B7 substrates will be required to classify the various substrate binding and effector sites, as has occurred with CYP3A4. Finally, the complex interactions observed between UGT2B7 substrates, which includes activation and inhibition (due either to competitive displacement or changes in Ks or Vmax via an effector site), indicates that careful experimental design and kinetic interpretation is necessary for drug-drug interaction studies involving this enzyme.
Footnotes
-
This work was supported by grants from the National Health and Medical Research Council of Australia and Pfizer Global Research. V.U. is the recipient of a Flinders University International Postgraduate Research Scholarship.
-
ABBREVIATIONS: UGT, UDP-glucuronosyltransferase; 4MU, 4-methylumbelliferone; 1NP, 1-naphthol; AZT, zidovudine (3′-azido-3′-deoxythymidine); GAZT, zidovudine β-d-glucuronide (3′-azido-3′-deoxythymidine 5′-β-d-glucuronide); 3′-azido-3′-deoxythymidine 5′-β-d-glucuronide; 4MUG, 4-methylumbelliferone-β-d-glucuronide; 1NPG, 1-naphthol-β-d-glucuronide; UDPGA, UDP-glucuronic acid; HEK, human embryonic kidney; HPLC, high-performance liquid chromatography.
- Received May 5, 2008.
- Accepted July 21, 2008.
- The American Society for Pharmacology and Experimental Therapeutics


